당사 팬 페이지에 가입하십시오

Price prediction by Nearest Neighbor found by a weighted correlation coefficient - MetaTrader 5용 지표
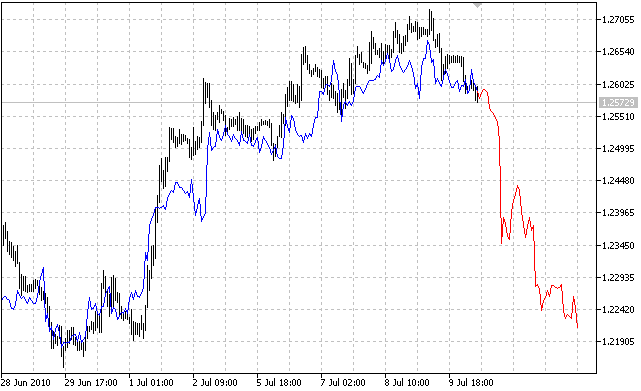
고전적인 최근접 이웃 알고리즘( https://www.mql5.com/ko/code/133 에서 구현 예시 참조)의 가장 큰 단점은 패턴 내의 모든 가격이 동일하게 취급된다는 것입니다. 즉, 이전 가격이 최신 가격과 미래에 동일한 영향을 미친다고 가정합니다. 이러한 단점을 극복하기 위해 이 버전의 가장 가까운 이웃 지표는 과거에 가장 가까운 패턴을 검색하는 동안 가장 최근 가격에 더 큰 가중치를 부여합니다. 이 지표는 가격 패턴 내에서 최신 가격에서 이전 가격으로 갈수록 가중치가 선형적으로 감소하는 가중 상관 계수를 사용합니다.
인디케이터의 입력 매개변수는 다음과 같습니다:
- Npast - 패턴 내 과거 막대 수입니다;
- Nfut - 패턴의 미래 막대 수(<Npast여야 함).
인디케이터는 두 개의 곡선을 표시합니다. 파란색 곡선은 가장 가까운 이웃의 과거 가격을 나타내고 빨간색 곡선은 같은 패턴의 미래 가격을 나타냅니다. 가장 가까운 이웃은 이 패턴과 현재 패턴 사이의 선형 회귀 기울기에 따라 스케일이 조정됩니다. 또한 인디케이터는 가장 가까운 이웃의 시작일과 현재 패턴과의 상관 계수에 대한 정보를 인쇄합니다. 예를 들어
2010.07.09 11:37:10 가장 가까운 이웃 - 가중 상관계수 (EURUSD,H1) 가장 가까운 이웃은 2003.02.21 13:00:00에 시작하여 2003.03.12 00:00:00에 끝납니다. 현재 패턴과의 상관 계수는 0.9521726745708775입니다.

MetaQuotes Ltd에서 영어로 번역함.
원본 코드: https://www.mql5.com/en/code/134
 Price prediction by Nearest Neighbor
이 지표는 k-NN이라고도 하는 가장 가까운 이웃 클러스터링 기법을 사용하여 역사상 가장 유사한 패턴을 검색하고 과거 가격을 현재 패턴 미래 가격의 예측으로 사용합니다.
 iS7N_TREND_1
간단한 스무딩 알고리즘이 적용된 추세 표시기는 흑백입니다.
 알파트렌드
알파트렌드
시장의 추세, 지지 및 저항 수준을 결정하는 데 사용되는 지표입니다. 거래량 데이터를 사용할 수 있는 경우 MFI를 사용하여 계산하고, 그렇지 않은 경우 RSI를 사용하여 계산합니다. 모멘텀: RSI 및 MFI 변동성: ATR
 Creating a Simple News Filter for XAUUSD Trading on MT5
XAUUSD (금) 거래는 종종 USD, GBP 또는 EUR 발표와 같은 주요 경제 뉴스 이벤트의 영향을 받습니다. 이러한 변동성이 큰 기간 동안 위험을 줄이려면 EA(Expert Advisor)에서 뉴스 필터를 사용하는 것이 필수적입니다. 이 글에서는 MT5에서 간단한 뉴스 필터를 만들어 XAUUSD 거래에 적용하는 방법을 알려드리겠습니다.