당사 팬 페이지에 가입하십시오
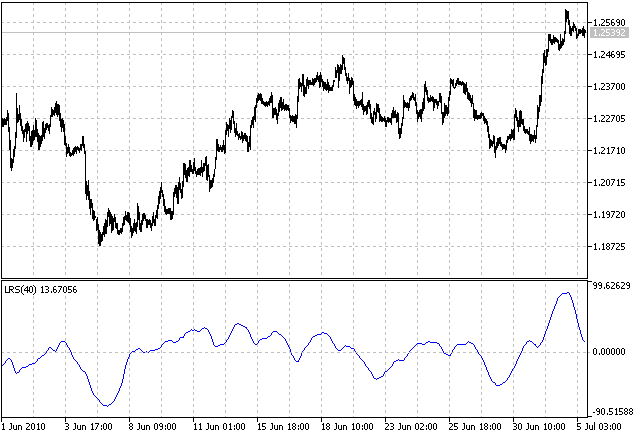
선형 회귀는 가격 데이터에 대해 다음과 같은 직선 방정식을 적용합니다:
y[x] = y0 + b*x
여기서
- x는 막대 번호입니다(x=1..n);
- y[x]는 해당 가격(시가, 종가, 중앙값 등)입니다;
- b는 비례 계수입니다.
- y0은 바이어스입니다.
이 지표에 의해 주어진 선형 회귀 기울기는 정규화된 버전의 계수 b와 같습니다.
b의 공식은 다음과 같습니다:
b = (n*Sxy - Sx*Sy)/(n*Sxx - Sx*Sx)
여기서
- Sx = Sum(x, x = 1..n)= n*(n + 1)/2;
- Sy = Sum(y[x], x = 1..n);
- Sxx = Sum(x*x, x = 1..n) = n*(n+1)*(2*n+1)/6;
- Sxy = Sum(x*y[x], x = 1..n);
- n은 LRS(입력 파라미터 Per)의 주기입니다.
b의 분모는 다음과 같이 단순화할 수 있습니다:
n*Sxx - Sx*Sx = n*n*(n-1)*(n+1)/12
마지막으로, b에 대한 전체 방정식은 다음과 같이 단순화할 수 있습니다.
b = 6*(2*Sxy/(n + 1) - Sy)/n/(n - 1)
계수 b는 정규화되지 않았습니다. 서로 다른 통화쌍에 대해 LRS의 범위가 거의 같게 하려면 정규화해야 합니다. b를 단순이동평균 (SMA) 또는 선형가중이동평균 (LWMA)으로 나누면 다음과 같이 정규화할 수 있어 편리합니다:
SMA = Sy/n
LWMA = 2*Sxy/n/(n + 1)
LRS의 해당 버전은 다음과 같습니다.
LRS_LWMA = b/LWMA = 6*(1 - (n + 1)*Sy/Sxy/2)/(n + 1)
이 두 가지 버전의 노멀라이제이션은 거의 구별할 수 없습니다. 따라서 지표에는 SMA 정규화가 선택되었습니다. 또한 LRS의 값이 매우 작기 때문에 지표 값은 대략 -100에서 +100 범위에 맞도록 10만 분의 1로 계산하여 표시합니다.

MetaQuotes Ltd에서 영어로 번역함.
원본 코드: https://www.mql5.com/en/code/127
 거짓 이별
거짓 이별
"거짓 돌파.mq5" 인디케이터는 지지와 저항의 거짓 돌파를 기준으로 매수 및 매도 지점을 시각적으로 식별하고 표시하는 MetaTrader 5용 도구입니다. 버퍼를 사용하여 매수(파란색) 및 매도(빨간색) 화살표, 지지선(파란색) 및 저항선(빨간색), 시장 고점 및 저점을 나타내는 추가 화살표를 표시합니다. 인디케이터의 주요 로직은 캔들의 고가와 저가를 기준으로 고점과 저점을 감지하고 지지와 저항 수준을 동적으로 업데이트하는 것으로 구성됩니다. 가격이 지지선 또는 저항선을 돌파했다가 되돌아오면 지표는 각각 매수 또는 매도 신호를 생성합니다. 잘못된 돌파를 기반으로 전략을 운영하는 트레이더에게 유용한 도구입니다.
 MeanReversionTrendEA
EA는 검증된 매개변수와 함께 추세 및 평균 복귀 신호에 따라 자동으로 거래합니다.
 AR extrapolation of price
이 지표는 자동 회귀 모델을 사용하여 가격을 추정합니다.
 Fourier extrapolation of price
이 지표는 가격에 삼각 모델을 적용하여 미래를 추정합니다.