 MetaTrader 5
 Experts
 지표
 스크립트
 라이브러리
 보관함
거래 로봇을 무료로 다운로드 하는 법을 시청해보세요
당사를 Twitter에서 찾아주십시오!
당사 팬 페이지에 가입하십시오
당사 팬 페이지에 가입하십시오
스크립트가 마음에 드시나요? MetaTrader 5 터미널에서 시도해보십시오

- 조회수:
- 44078
- 평가:
- 게시됨:
- 업데이트됨:
-
 이 코드를 기반으로 한 로봇이나 지표가 필요하신가요? 프리랜스로 주문하세요
프리랜스로 이동

Real author:
I have modified and combined the following materials:
- Harmonik_Ratios by "all traders";
- Support and Resistance Barry Stander;
- My own program.
This is the improved version of the "HarmonikManual", with more attractive and easier to use.
This indicator is made with the aim to:
- Detect the name of the pattern of the points that we place;
- Finding the possibility of emerging pattern;
- Automatically finding the possibility of reversal pattern.
How to use:
By clicking the button feature is located on the right top of the chart, we can set the utility as follows:
- "SEARCH" will find all the possible patterns that will happen next.
- "NEXT" will move the point "D" on the pattern obtained, to know the name.
- "ON / OFF" to turn the indicator on or off.
- "COLOUR / NONE" to change the color of the harmonic pattern, which is colored or not.
- "XABC" to put the point XABC to the nearest highest or lowest point.
- "RESET" when an error occurs that is not yet defined, press this button.
- "AUTO" search the possibility next pattern automatically.
- To move the location of the menu, press the key "M" for a while. After the key "M" is released, click the mouse button on the desired area.
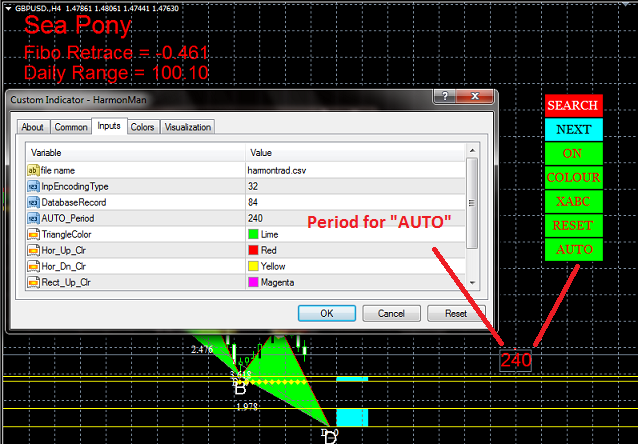
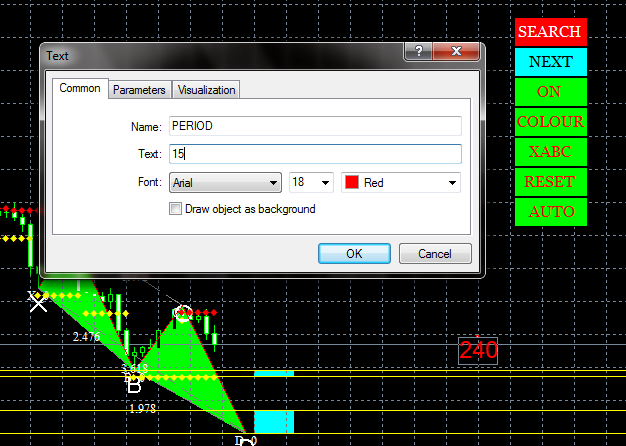
"AUTO", the feature "AUTO" will automatically create object property "TEXT" name "PERIOD" that show the PERIOD that will use to search the possibility of the next reversal pattern.
We can change the PERIOD to search, by changing the object property "TEXT" name "PERIOD" above.
Click the button "AUTO" again, and the result will shown as figure below.
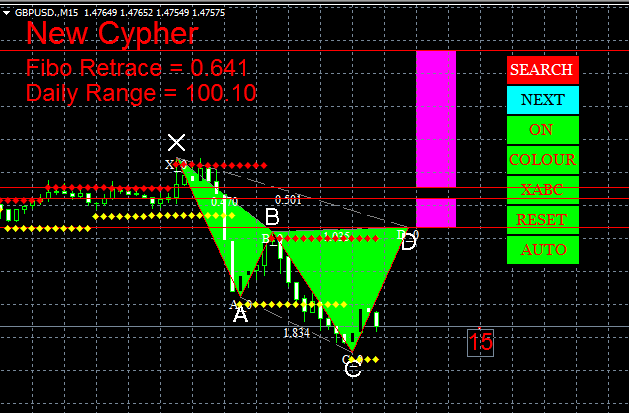
You also be able to change the database of "Harmonics Pattern" with your own database. By changing the input "file name" and "DatabaseRecord".
You do not have to worry that the number defined in "DatabaseRecord" is not appropriate, because the indicator will adjust if a given number is too large. And will only read the database records, according to the input number, if the number entered is too small.
Save your database file at <terminal_data_folder>\MQL4\Files.
 LivelliSR Now
The indicator shows support and resistance levels.
Price - EMAs
The indicator shows the distance between the open price and 3 different exponential moving averages (EMAs) in pips.
InfoLabel
A simple label that shows information like Ask & Bid, OHLC prices, volume, spread, remaining candle time, local & server time.
Overlay and Spread Charts for 2 symbols
Main chart shows the overlay chart of 2 symbols - while subchart displays the price spread line with spreadfactor.