Young Ho Seo / プロファイル
- 情報
|
11+ 年
経験
|
62
製品
|
1206
デモバージョン
|
|
4
ジョブ
|
0
シグナル
|
0
購読者
|
Harmonic Pattern Indicator - Repainting + Japanese Candlestick Pattern Scanner + Automatic Channel + Many more
https://www.mql5.com/en/market/product/4488
https://www.mql5.com/en/market/product/4475
https://algotrading-investment.com/portfolio-item/harmonic-pattern-plus/
Non Repainting and Non Lagging Harmonic Pattern Indicator – Customizable Harmonic + Japanese Candlestic Pattern Scanner + Advanced Channel + Many more
https://www.mql5.com/en/market/product/41993
https://www.mql5.com/en/market/product/41992
https://algotrading-investment.com/portfolio-item/profitable-pattern-scanner/
Supply Demand Indicator – Multiple Timeframe Scanning Added + Non Repainting + Professional Indicator
https://www.mql5.com/en/market/product/40076
https://www.mql5.com/en/market/product/40075
https://algotrading-investment.com/portfolio-item/ace-supply-demand-zone/
Momentum Indicator – Path to Volume Spread Analysis
https://www.mql5.com/en/market/product/30641
https://www.mql5.com/en/market/product/30621
https://algotrading-investment.com/portfolio-item/excessive-momentum-indicator/
Elliott Wave Indicator for the Power User
https://www.mql5.com/en/market/product/16479
https://www.mql5.com/en/market/product/16472
https://algotrading-investment.com/portfolio-item/elliott-wave-trend/
Forex Prediction - Turn Support and Resistance to the Advanced Strategy
https://www.mql5.com/en/market/product/49170
https://www.mql5.com/en/market/product/49169
https://algotrading-investment.com/portfolio-item/fractal-pattern-scanner/
MetaTrader 4 and MetaTrader 5 Product Page: https://www.mql5.com/en/users/financeengineer/seller#products
Free Forex Prediction with Fibonacci Analysis: https://algotrading-investment.com/2020/10/23/forex-prediction-with-fibonacci-analysis/
Free Harmonic Pattern Signal: https://algotrading-investment.com/2020/12/17/harmonic-pattern-signal-for-forex-market/
============================================================================================================================
Here are the trading education books. We recommend reading these books if you are a trader or investor in Forex and Stock market. In the list below, we put the easy to read book on top. Try to read the easy to read book first and try to read the harder book later to improve your trading and investment.
First Link = amazon.com, Second Link = Google Play Books, Third Link = algotrading-investment.com, Fourth Link = Google Books
Technical Analysis in Forex and Stock Market (Supply Demand Analysis and Support Resistance)
https://www.amazon.com/dp/B09L55ZK4Z
https://play.google.com/store/books/details?id=pHlMEAAAQBAJ
https://algotrading-investment.com/portfolio-item/technical-analysis-in-forex-and-stock-market/
https://books.google.co.kr/books/about?id=pHlMEAAAQBAJ
Science Of Support, Resistance, Fibonacci Analysis, Harmonic Pattern, Elliott Wave and X3 Chart Pattern (In Forex and Stock Market Trading)
https://www.amazon.com/dp/B0993WZGZD
https://play.google.com/store/books/details?id=MME3EAAAQBAJ
https://algotrading-investment.com/portfolio-item/science-of-support-resistance-fibonacci-analysis-harmonic-pattern/
https://books.google.co.kr/books/about?id=MME3EAAAQBAJ
Profitable Chart Patterns in Forex and Stock Market (Fibonacci Analysis, Harmonic Pattern, Elliott Wave, and X3 Chart Pattern)
https://www.amazon.com/dp/B0B2KZH87K
https://play.google.com/store/books/details?id=7KrQDwAAQBAJ
https://algotrading-investment.com/portfolio-item/profitable-chart-patterns-in-forex-and-stock-market/
https://books.google.com/books/about?id=7KrQDwAAQBAJ
Guide to Precision Harmonic Pattern Trading (Mastering Turning Point Strategy for Financial Trading)
https://www.amazon.com/dp/B01MRI5LY6
https://play.google.com/store/books/details?id=8SbMDwAAQBAJ
http://algotrading-investment.com/portfolio-item/guide-precision-harmonic-pattern-trading/
https://books.google.com/books/about?id=8SbMDwAAQBAJ
Scientific Guide to Price Action and Pattern Trading (Wisdom of Trend, Cycle, and Fractal Wave)
https://www.amazon.com/dp/B073T3ZMBR
https://play.google.com/store/books/details?id=5prUDwAAQBAJ
https://algotrading-investment.com/portfolio-item/scientific-guide-to-price-action-and-pattern-trading/
https://books.google.com/books/about?id=5prUDwAAQBAJ
Predicting Forex and Stock Market with Fractal Pattern: Science of Price and Time
https://www.amazon.com/dp/B086YKM8BW
https://play.google.com/store/books/details?id=VJjiDwAAQBAJ
https://algotrading-investment.com/portfolio-item/predicting-forex-and-stock-market-with-fractal-pattern/
https://books.google.com/books/about?id=VJjiDwAAQBAJ
Trading Education Book 1 in Korean (Apple, Google Play Book, Google Book, Scribd, Kobo)
https://books.apple.com/us/book/id1565534211
https://play.google.com/store/books/details?id=HTgqEAAAQBAJ
https://books.google.co.kr/books/about?id=HTgqEAAAQBAJ
https://www.scribd.com/book/505583892
https://www.kobo.com/ww/en/ebook/8J-Eg58EDzKwlpUmADdp2g
Trading Education Book 2 in Korean (Apple, Google Play Book, Google Book, Scribd, Kobo)
https://books.apple.com/us/book/id1597112108
https://play.google.com/store/books/details?id=shRQEAAAQBAJ
https://books.google.co.kr/books/about?id=shRQEAAAQBAJ
https://www.scribd.com/book/542068528
https://www.kobo.com/ww/en/ebook/X8SmJdYCtDasOfQ1LQpCtg
About Young Ho Seo
Young Ho Seo is an Engineer, Financial Trader, and Quantitative Developer, working on Trading Science and Investment Engineering since 2011. He is the creator of many technical indicators, price patterns and trading strategies used in the financial market. He is also teaching the trading practice on how to use the Supply Demand Analysis, Support, Resistance, Trend line, Fibonacci Analysis, Harmonic Pattern, Elliott Wave Theory, Chart Patterns, and Probability for Forex and Stock Market. His works include developing scientific trading principle and mathematical algorithm in the work of Benjamin Graham, Everette S. Gardner, Benoit Mandelbrot, Ralph Nelson Elliott, Harold M. Gartley, Richard Shabacker, William Delbert Gann, Richard Wyckoff and Richard Dennis. You can find his dedicated works on www.algotrading-investment.com . His life mission is to connect financial traders and scientific community for better understanding of this world and crowd behaviour in the financial market. He wrote many books and articles, which are helpful for understanding the technology and application behind technical analysis, statistics, time series forecasting, fractal science, econometrics, and artificial intelligence in the financial market.
If you are interested in our software and training, just visit our main website: www.algotrading-investment.com
Young Ho Seo
XAUUSD Market Outlook
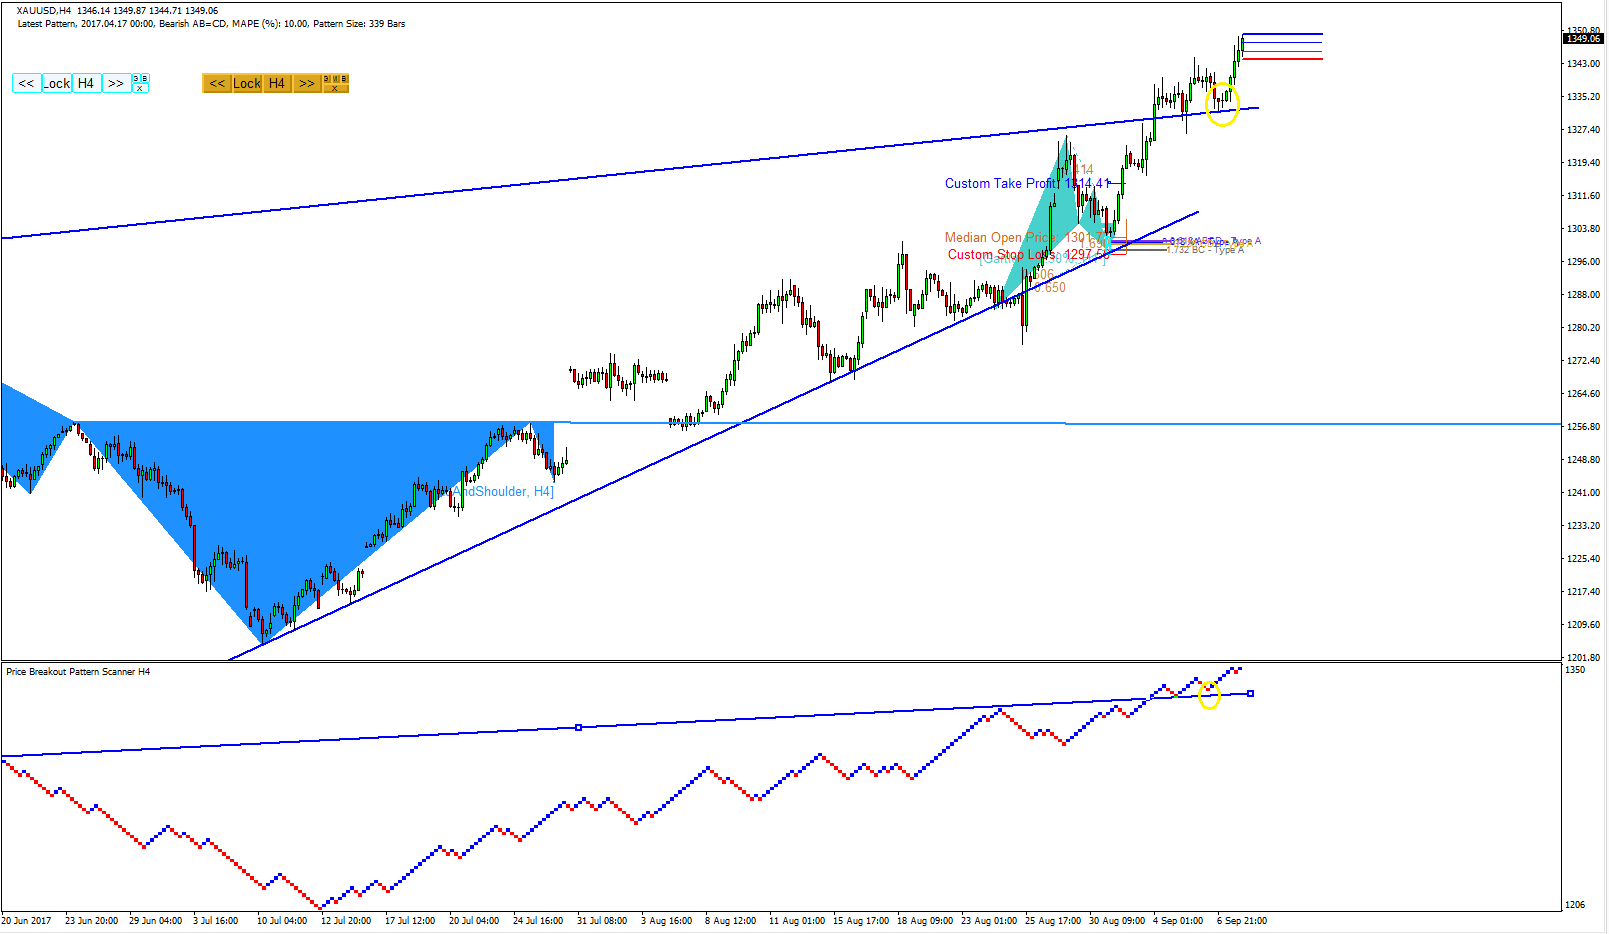
It seems that Gold is the most benefited from these days increasing uncertainty in the financial market. After the formation of Reverse head and shoulder patterns, Gold price gone up nearly 100 US dollar. After the formation of Gartley, Gold price gone up nearly 50 US dollar. After the Price dipped in the support line we have drawn earlier, Gold price gone up nearly 20 US dollar. Each land mark was detected using our price pattern scanner and harmonic pattern plus and smart renko combination.
Visit our site to get powerful trading system and strategy.
https://www.mql5.com/en/users/financeengineer/seller#products
http://algotrading-investment.com/

Young Ho Seo
EURUSD Market Outlook
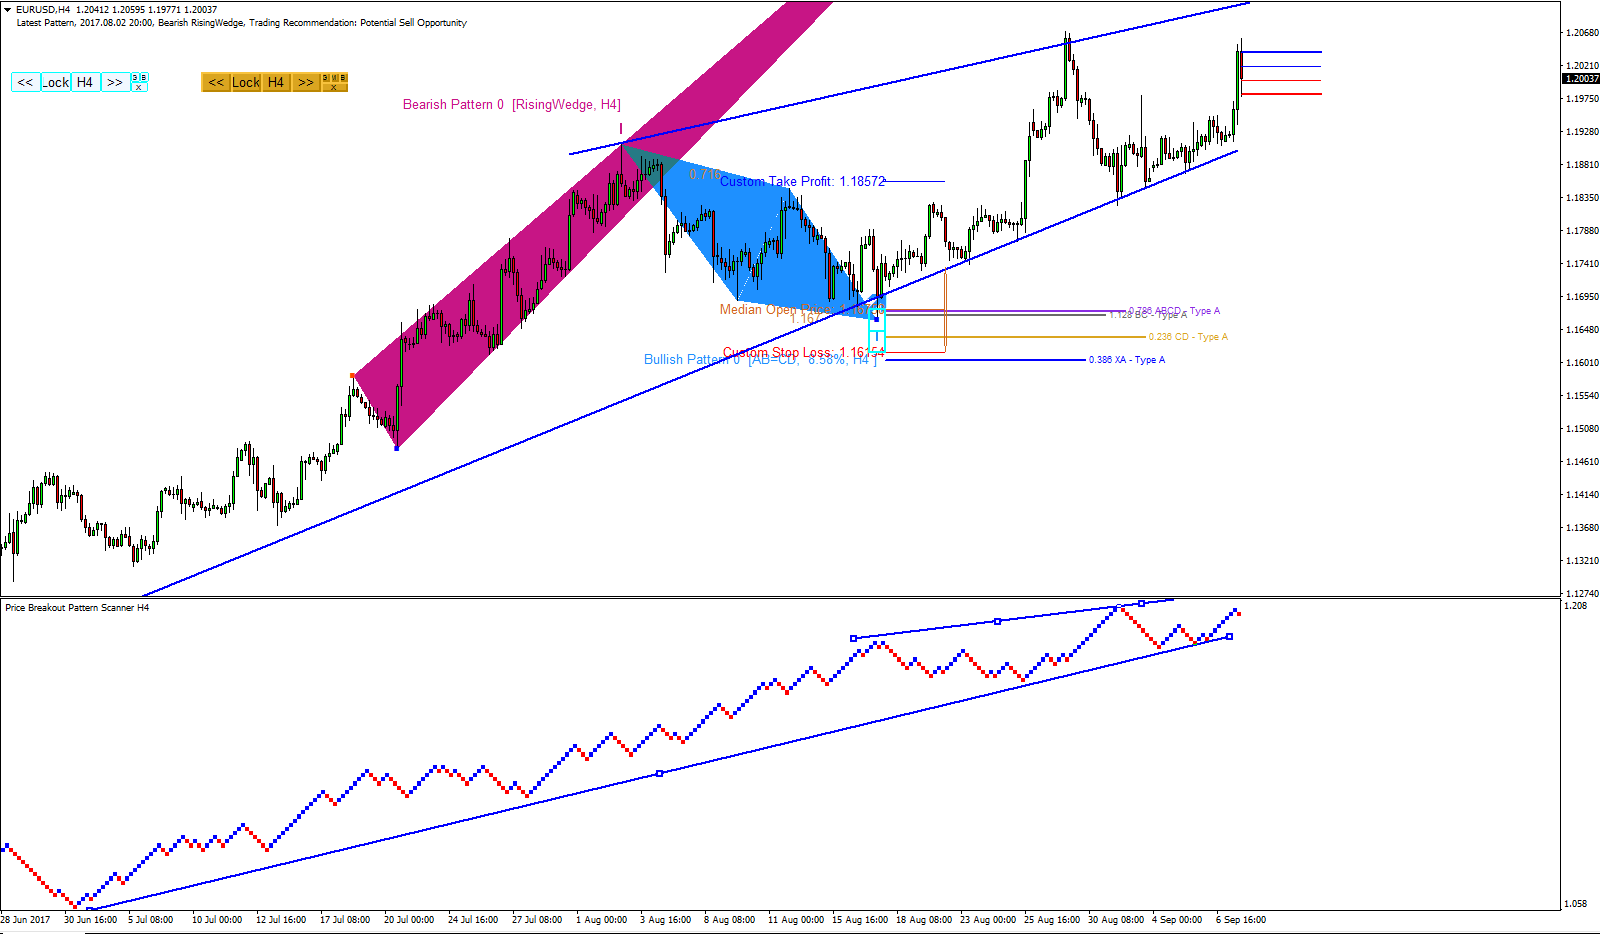
USD was penalized from its soaring Jobless claims plus added effect on revised nonfarm productivity data release. It is not so hard to deduct the similar effect with Irma based on their relative strength to Harvey. Currently EURUSD is taking the minor correction after the bullish breakout. Still EURSUD is inside the boundary we have marked up earlier.
Visit our site for powerful trading system and strategy.
http://algotrading-investment.com/
https://www.mql5.com/en/users/financeengineer/seller#products

Young Ho Seo
EURUSD Market Outlook
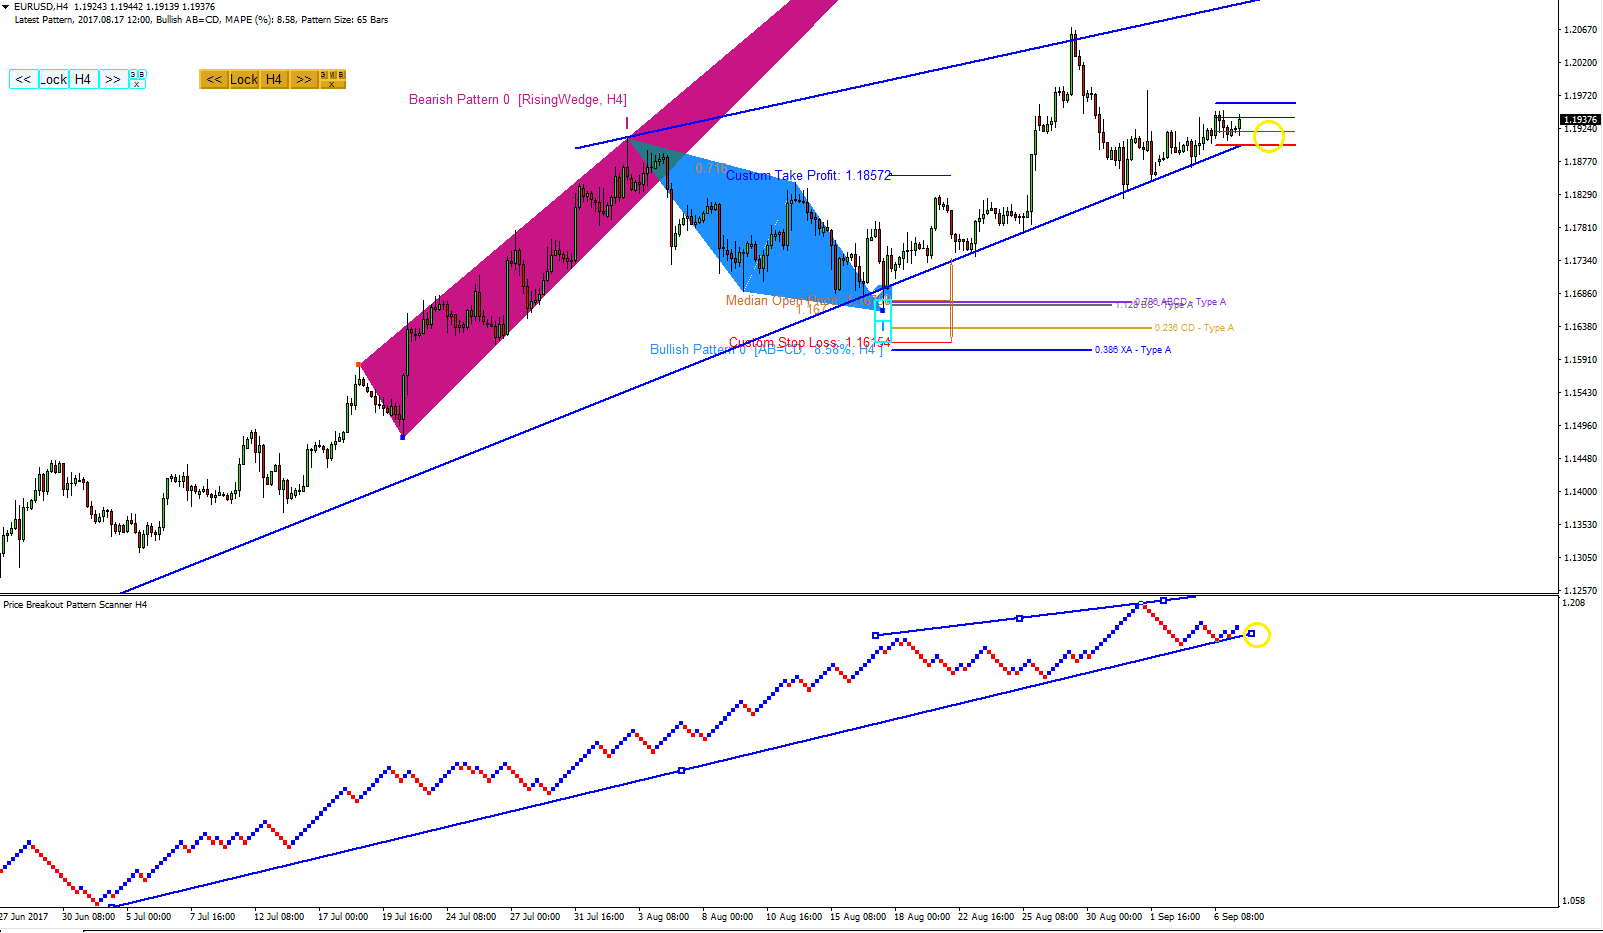
Currently EURUSD is low in trading volume. EURUSD slowly moves along with the support line we have drawn earlier.
So Irma is coming and panicking have been increased. It is just because we have a nightmare with Harvey few weeks ago and US have not fully recovered the footage of Harvey yet. Another monstrous hurricane approach can surely increase the concern of the many people.
Unfortunately we do really hope that Irma will not harm any one but we are not sure until the news come around.
Still watch out the support line we have drawn earlier.
Visit our website for powerful trading system and strategy. Meet the trading system used by thousands of profitable traders world wide.
https://www.mql5.com/en/users/financeengineer/seller#products
http://algotrading-investment.com

Young Ho Seo
AUDUSD Market Outlook
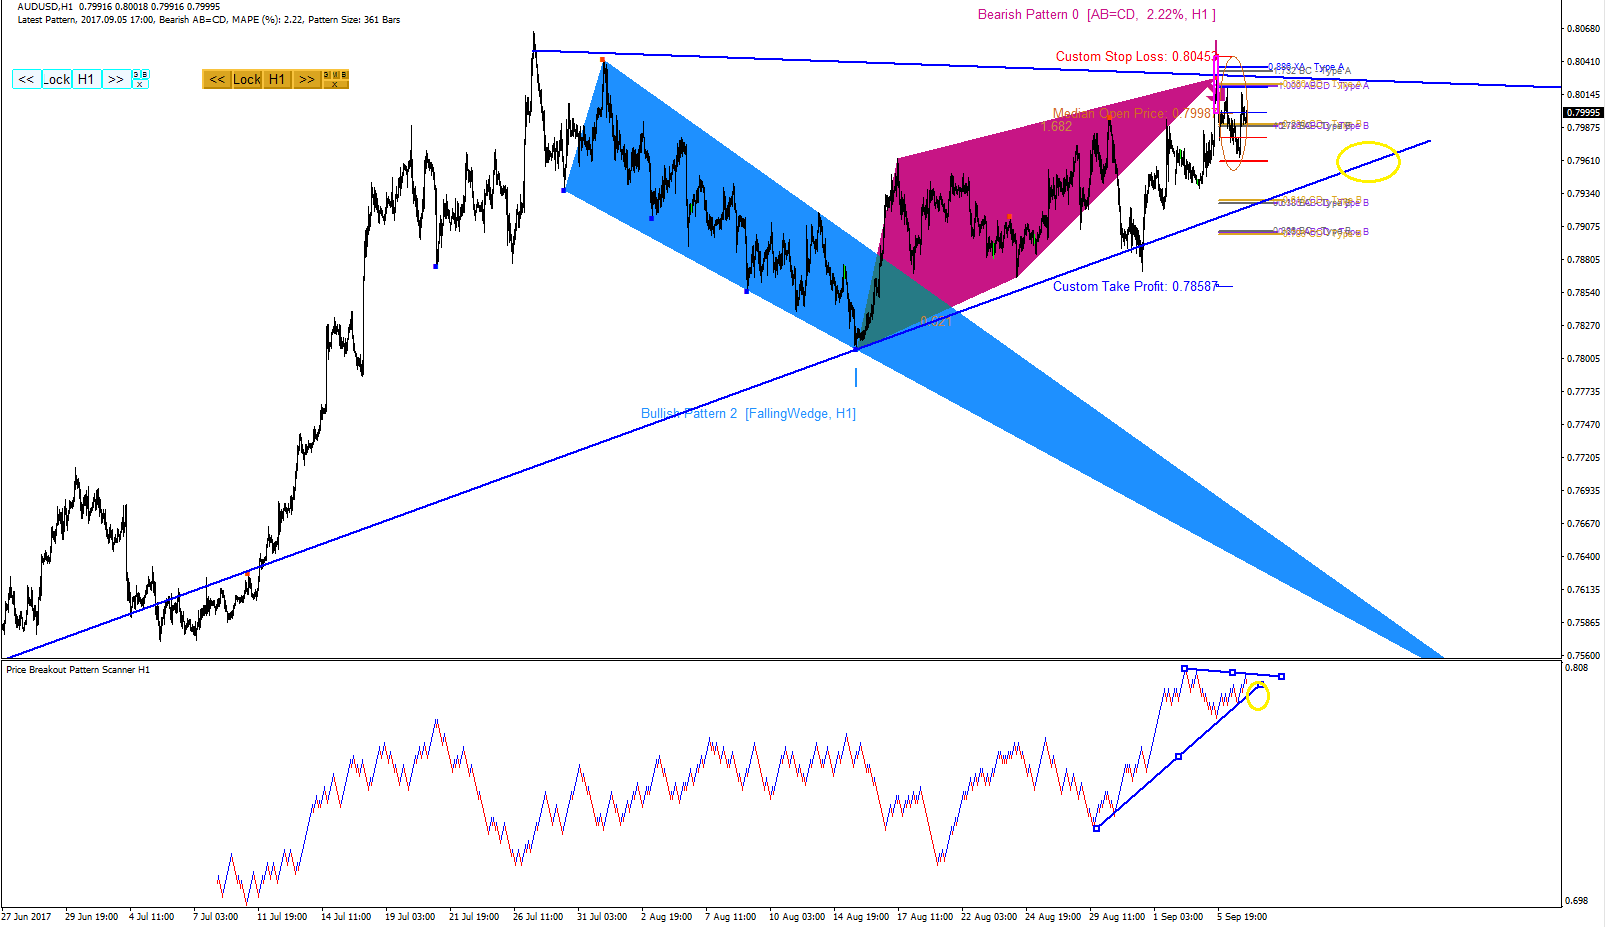
With increasing market uncertainty last two weeks, AUDUSD have showed some bullish movement. Currently we have ABCD pattern formed in sensible place. Although PCI (=Pattern Completion Interval) have just covered potential double top area, still there was bearish correction after the formation of ABCD pattern.
We have also outlined the important support line we have detected through our Smart Renko for your trading (circled in yellow).
Visit our site for powerful trading system and trading strategy.
http://algotrading-investment.com/
https://www.mql5.com/en/users/financeengineer/seller#products

Young Ho Seo
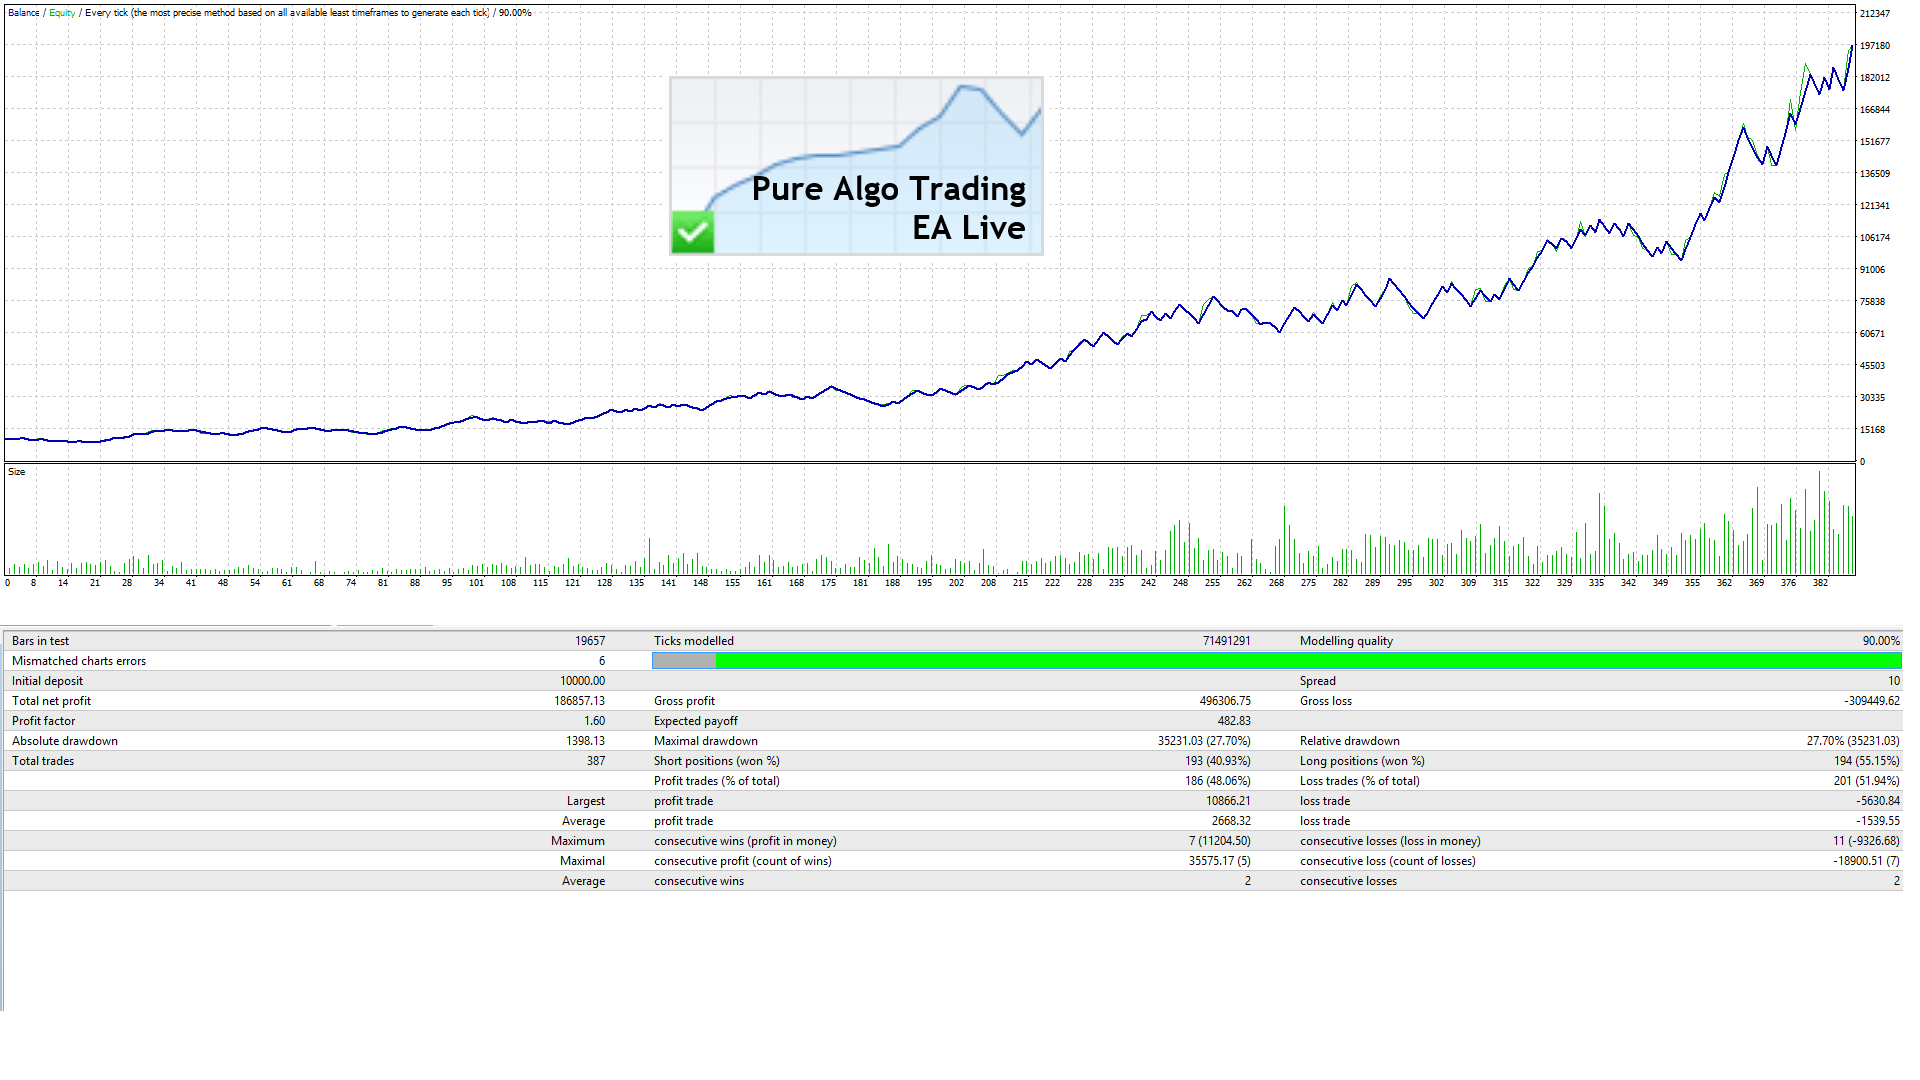
Pure Algo Trading Signal
Currently our Pure Algo Trading signal managed to make another 6% in the beginning of the September. So far, the performance was steady last three month from June 2017 with less than 4% drawdown.
https://www.mql5.com/en/signals/103405
We recommend this signal:
•if you have realistic profit goals for your investment from your past investment experience
•You have blown up your account many times subscribing fast growing high risk signal before. You want to stop blowing your account.
•if you know that trading and investment involves some risk
In addition please note that the safety is important for this signal. Therefore, we are not producing fast growing profit, which will blow your account finally. This signal aims to grow steady and safe. Also know that there are some good time and bad time for this signal. It is not bullet proof system.
Here is the link for our Pure Algo Trading Signal on Meta Trader Signal Service Market Place. You can directly subscribe to this signal if you want.
https://www.mql5.com/en/signals/103405
Visit our website to find out the powerful trading tools and strategy.
https://www.mql5.com/en/users/financeengineer/seller#products
http://algotrading-investment.com/

Young Ho Seo
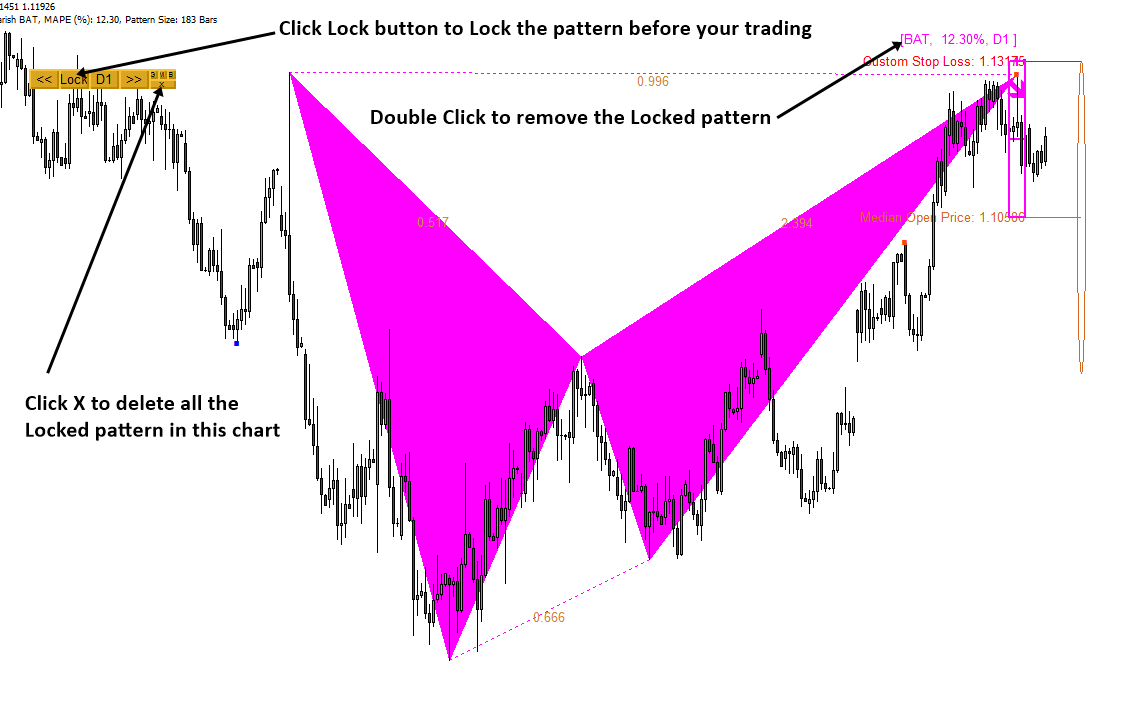
How to save Harmonic Patterns in your chart
With our Harmonic Pattern Plus and Harmonic Pattern Scenario Planner, you can perfectly control the repainting and redrawing issues of the classic Price Action and Pattern Trading. Beside this powerful feature, the highly precise pattern recognition feature of our Harmonic Pattern Plus and Harmonic Pattern Scenario Planner makes these tools to stand out from rest.
Let us show the simple steps to save the Harmonic Pattern in your chart for future reference purpose. Firstly press "Lock" button in your chart to save the Harmonic Patterns. If you want to remove the locked patterns from your chart, then there are two ways of doing it.
Firstly you can click X button to remove the entire locked patterns. Secondly, you can double click over the name of the patterns to remove the individual patterns from your chart. You might remove the individual patterns by double click on the edge of the pattern occasionally (However, somehow, in MetaTrader, this feature is not perfect. Try to click the edge of the pattern not inside. )
Now here is some advanced trading tips. Saving (locking) the pattern in your chart is very useful because you can take them to lower or higher timeframe too. This naturally reinforce your multiple timeframe pattern analysis. If you want to double confirm your trading signal in both lower and higher timeframe, this feature is very useful.
As usual, this tips are applicable to both Harmonic Pattern Plus and Harmonic Pattern Scenario Planner.
Do not miss our Powerful Trading system which can help your trading enormously.
https://www.mql5.com/en/market/product/4488
https://www.mql5.com/en/market/product/4475
https://www.mql5.com/en/market/product/6240
https://www.mql5.com/en/market/product/6101
http://algotrading-investment.com/portfolio-item/harmonic-pattern-plus/
http://algotrading-investment.com/portfolio-item/harmonic-pattern-scenario-planner/

Young Ho Seo
Gold Market Outlook
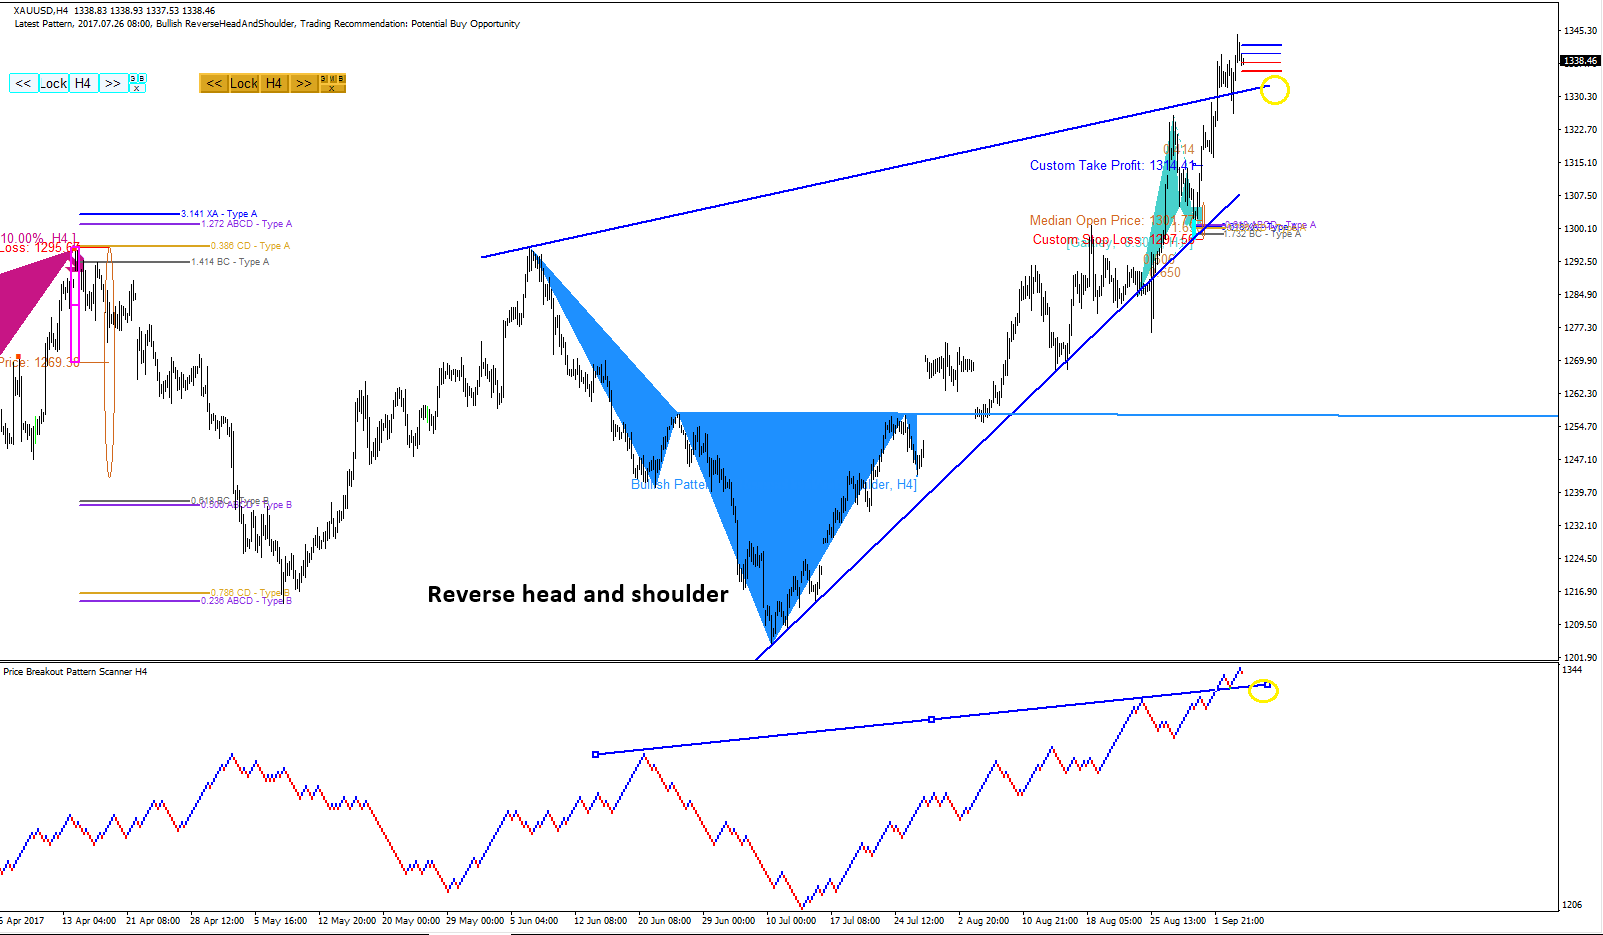
This week we talk a lot about increasing the military equipment between US and their alias in regards to the NK issue. Military confliction is definitely not the best option. Increasing military weapons and equipment are the potential triggers for increasing military conflicts in the future.
In spite of many of news like this, Gold is rather slow this week. Well, we know that the financial market like to move in the unexpected way. So I am not surprised. This week only Gold was up only 1300 points. We have outlined important support and resistance lines for your future trading.
Looking for powerful trading system and strategy, visit our website
https://www.mql5.com/en/users/financeengineer/seller#products
http://algotrading-investment.com/

Young Ho Seo
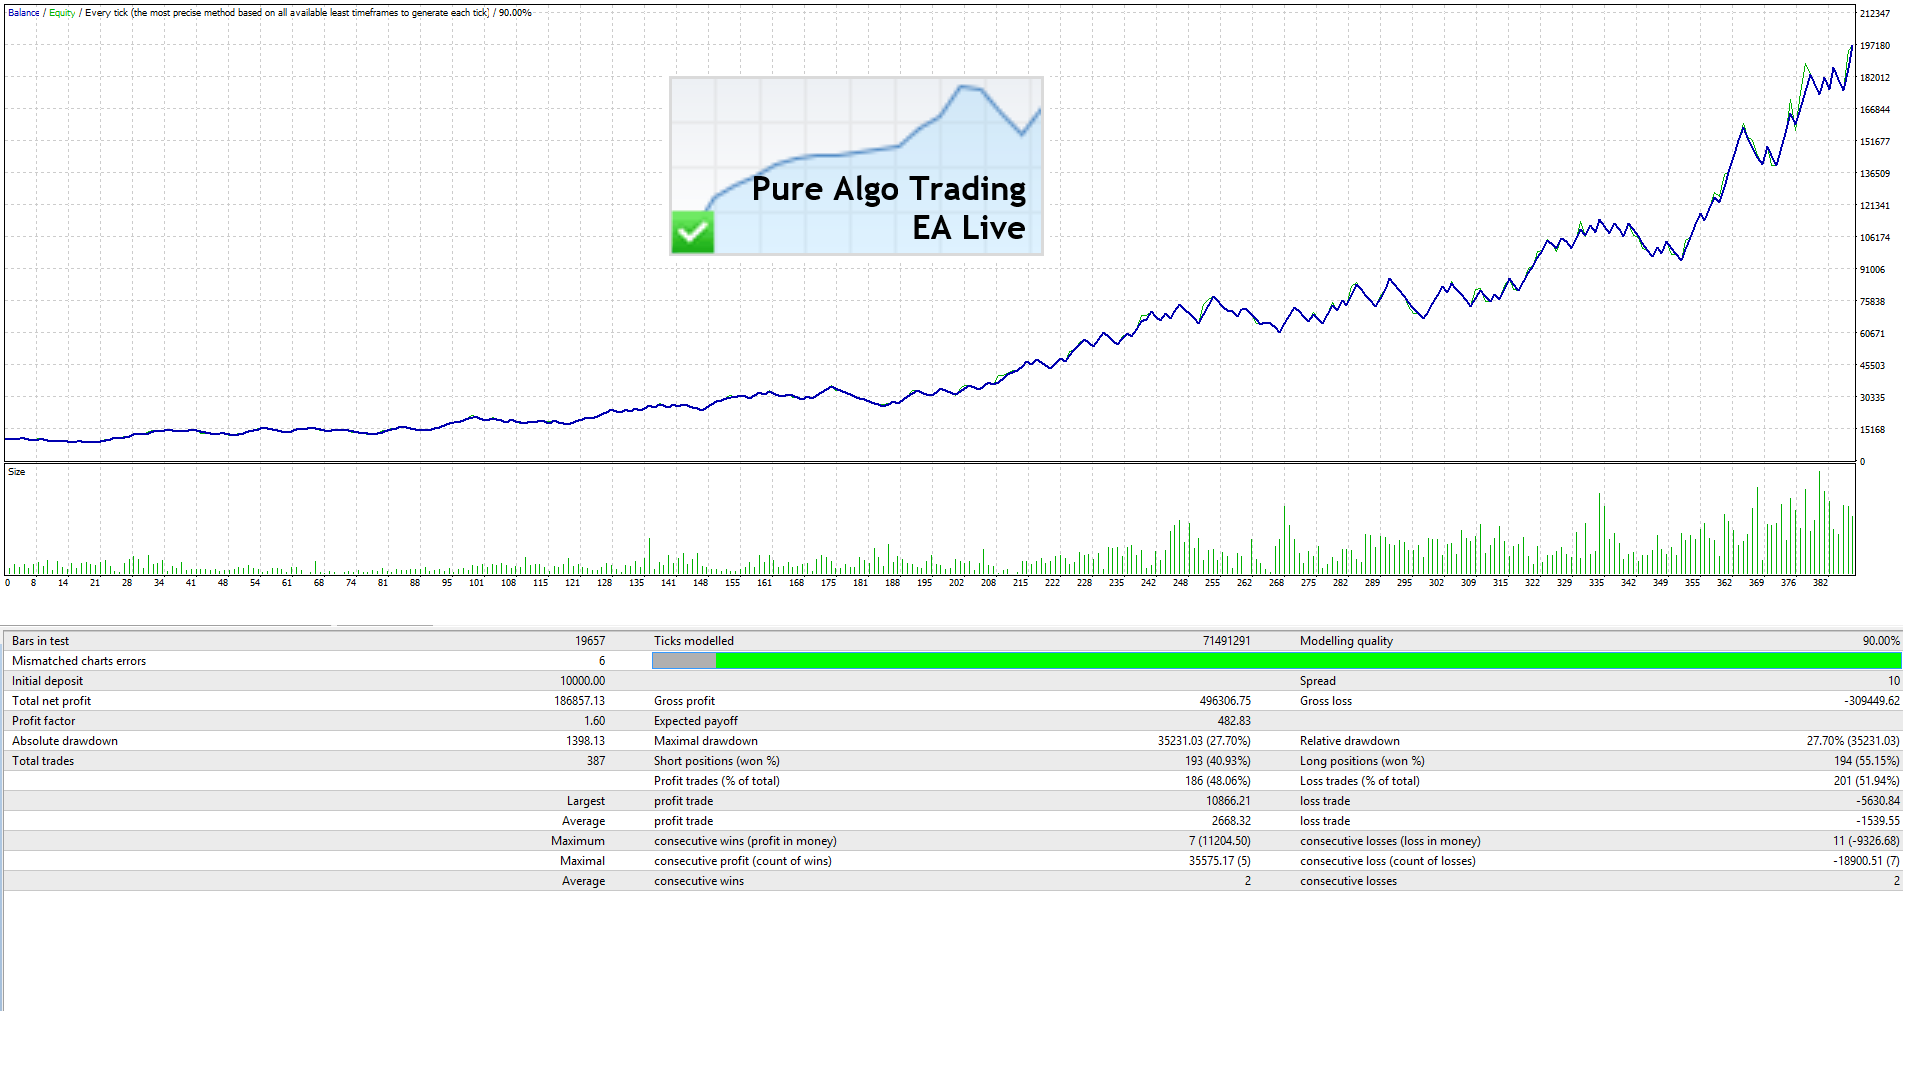
Pure Algo Trading Signal
Currently our Pure Algo Trading signal managed to make another 6% in the beginning of the September. So far, the performance was steady last three month from June 2017 with less than 4% drawdown.
We recommend this signal:
•if you have realistic profit goals for your investment from your past investment experience
•You have blown up your account many times subscribing fast growing high risk signal before. You want to stop blowing your account.
•if you know that trading and investment involves some risk
In addition please note that the safety is important for this signal. Therefore, we are not producing fast growing profit, which will blow your account finally. This signal aims to grow steady and safe. Also know that there are some good time and bad time for this signal. It is not bullet proof system.
Here is the link for our Pure Algo Trading Signal on Meta Trader Signal Service Market Place. You can directly subscribe to this signal if you want.
https://www.mql5.com/en/signals/103405
Feel free to visit our website to find out the powerful trading tools and system for you.
https://www.mql5.com/en/users/financeengineer/seller#products
http://algotrading-investment.com/

Young Ho Seo
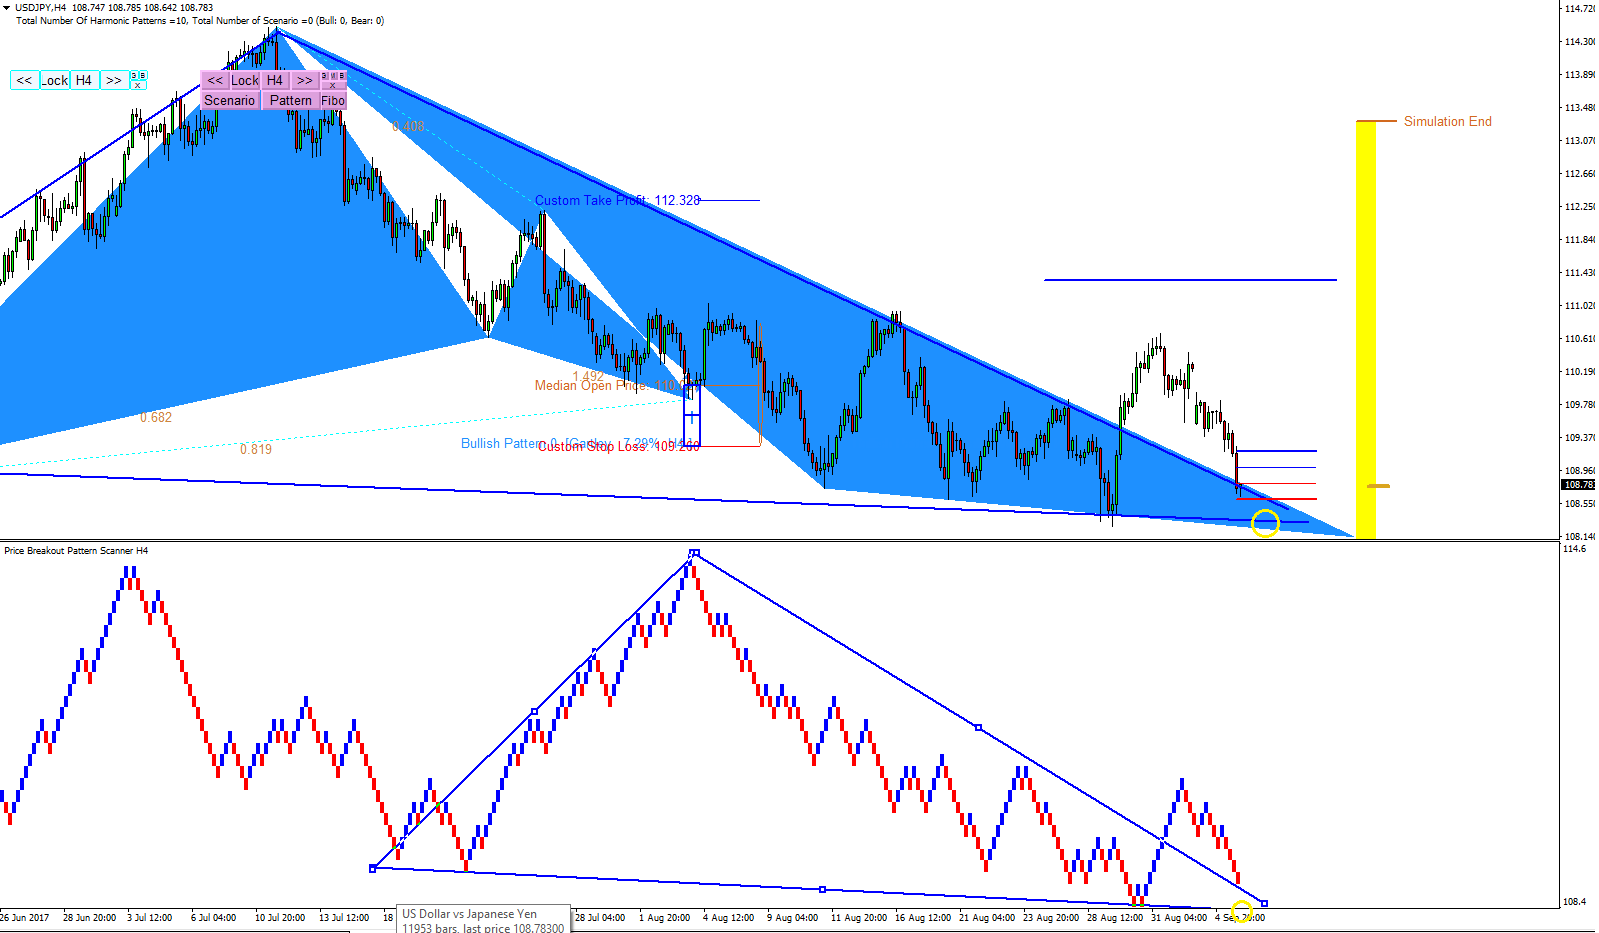
USDJPY Market Outlook
In regards to our last analysis, USDJPY come down around 50 pips. It is about to test the triangle again, we have outlined in our earlier analysis. With 20 pip further down (1 down brick), it would go inside triangle. If so, we have also outlined the next important levels for your trading.
Visit our site if you need powerful trading system and strategy:
http://algotrading-investment.com/
https://www.mql5.com/en/users/financeengineer/seller#products

Young Ho Seo
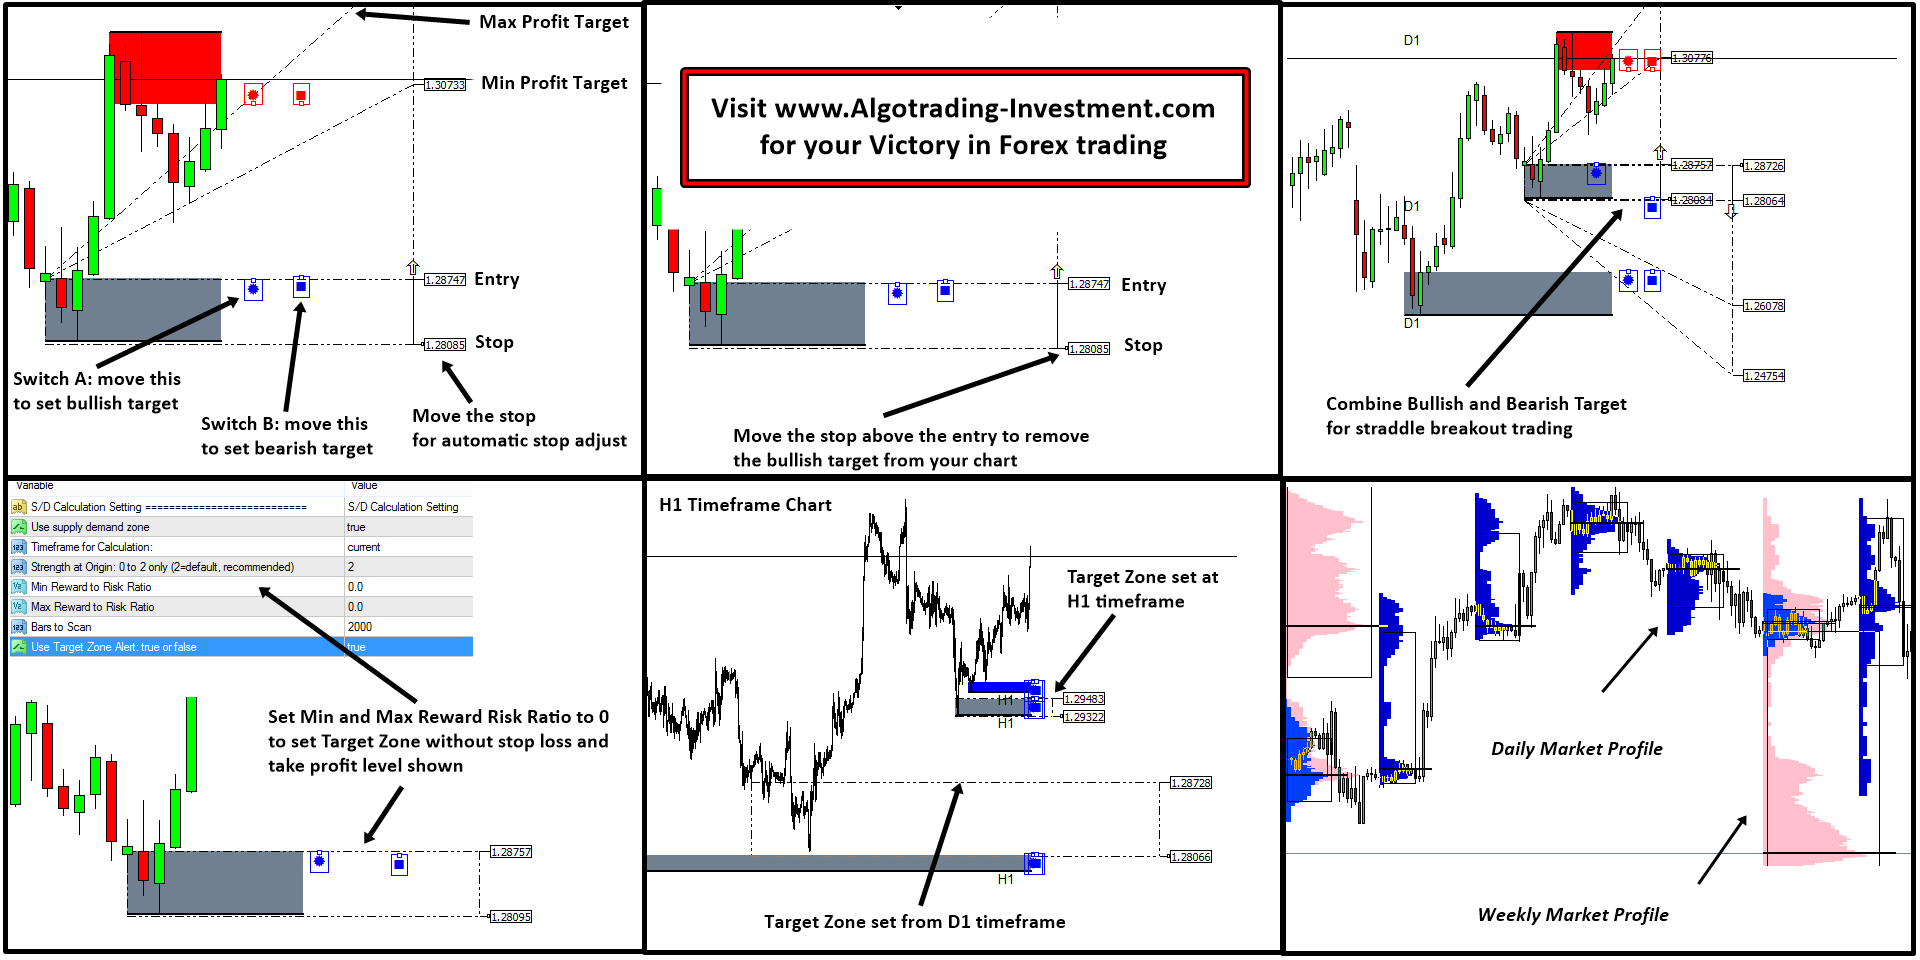
Mean Reversion Supply Demand
We have many sophisticated trading system to construct the sound portfolio of your investment and trading.
Mean Reversion Supply Demand is one of those powerful tool you can add in your collection. With the built in Market Profile indicator, the tool provide flexible and accurate control of your entry and risk management especially around the significant trading zone in your chart.
Highly automated feature can help you to readily set your profit target and even more sophisticated analysis in your chart.
Meet the unique and powerful trading system at our sites:
http://algotrading-investment.com/
https://www.mql5.com/en/users/financeengineer/seller#products

Young Ho Seo
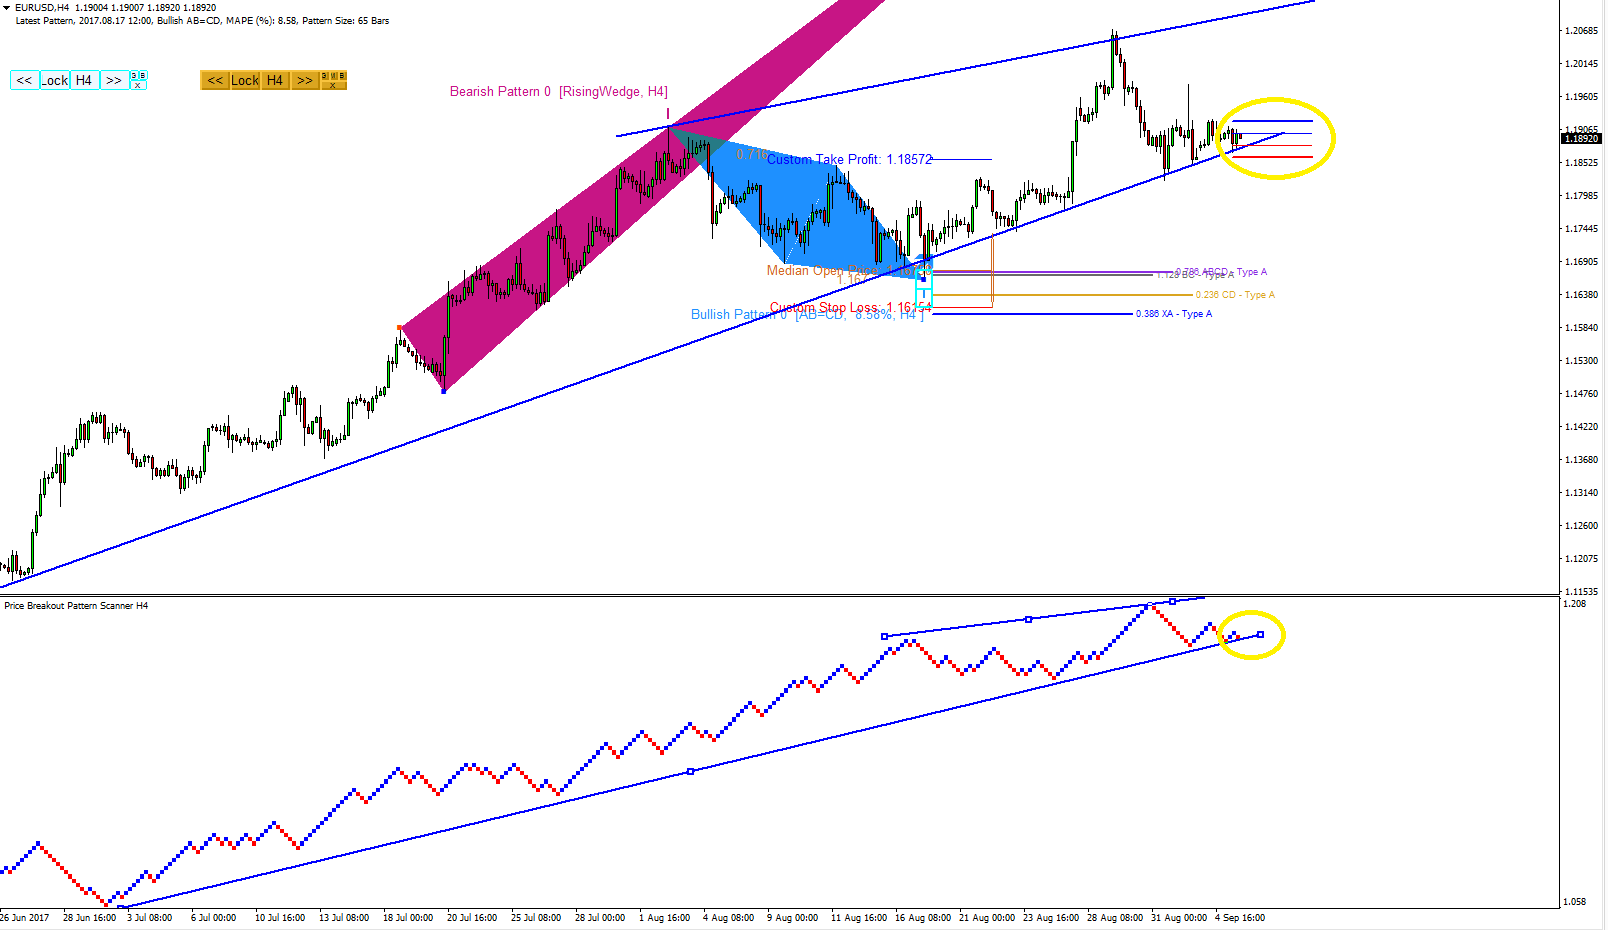
EURUSD Market Outlook
In general the Asian session and European session we had a quite market. EURUSD have not got far from its open price. However, EURUSD have been regressing to the support line for several hours now trying to find some supports for future movement. EURUSD have not shown a lot of passion to breakdown the support line yet. EURUSD need around 60 pips to completely move out side wedge pattern. At the same time, EURUSD have around 200 pips range to reach the top of the wedge pattern.
Visit our website for powerful trading system and strategy.
http://algotrading-investment.com/
https://www.mql5.com/en/users/financeengineer/seller#products

Young Ho Seo
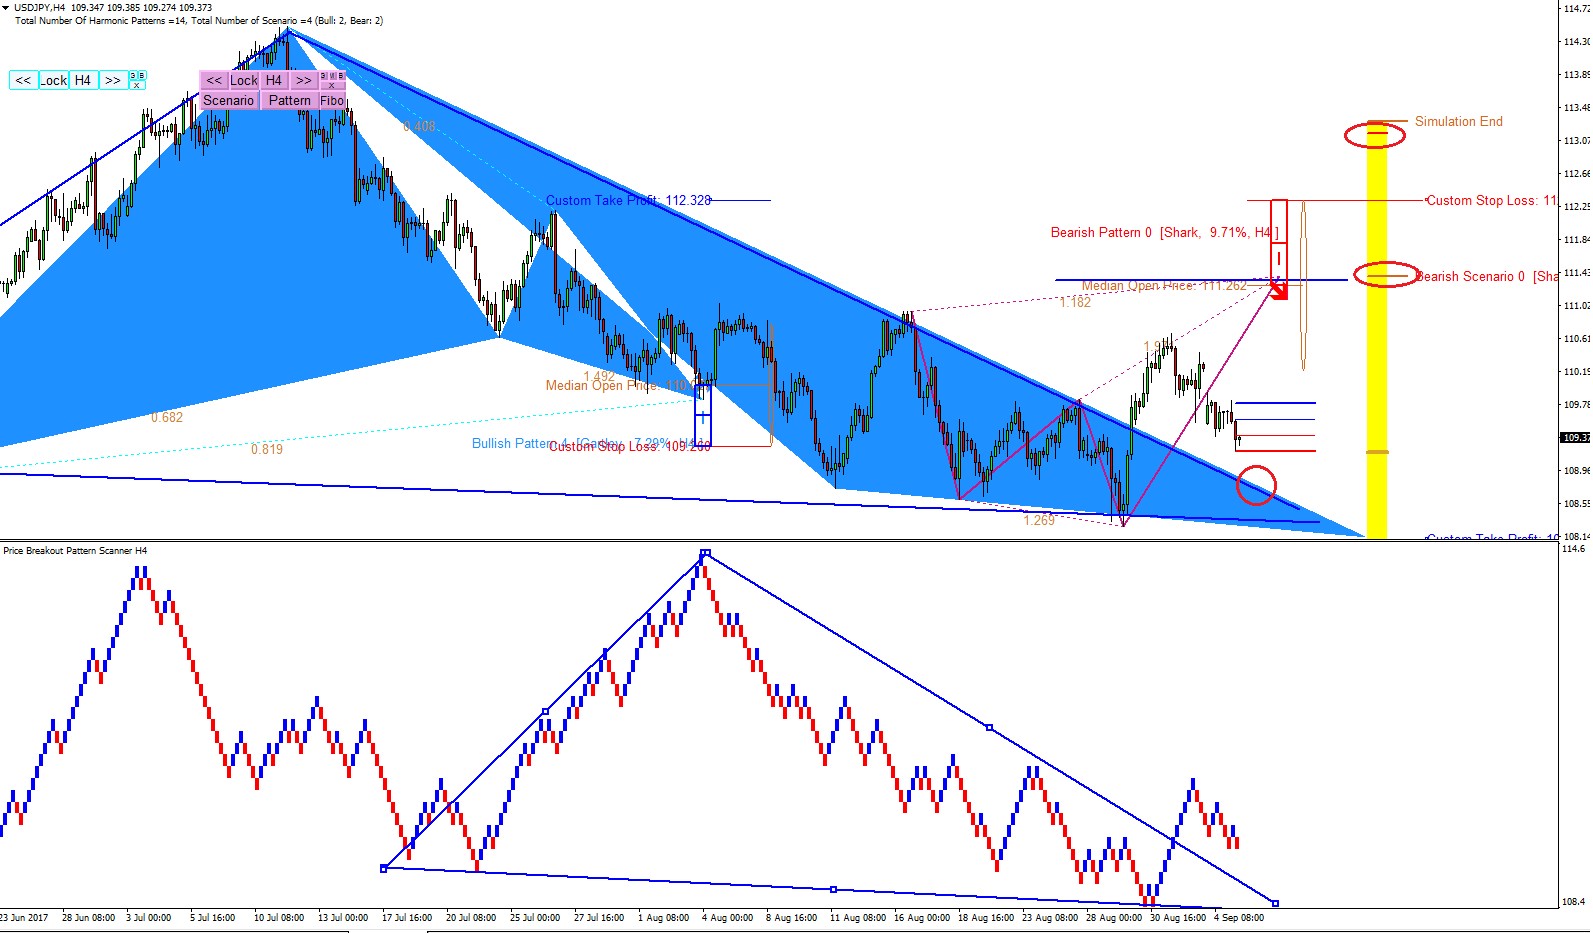
USDJPY Market Outlook
On Monday USDJPY started with little greater gap than EURUSD and GBPUSD. With lesser correction, USDJPY made a firm bearish movement on Monday.
With help of Harmonic Pattern Scenario Planner and Price Breakout Pattern Scanner, we were able to spot few important levels for your trading.
The top of the triangle are where two triangles are overlapping and USDJPY will like this angle once again in the near future. At the same time, Harmonic Pattern Scenario Planner showed two potential (future) patterns at 111.37 and 113.15.
Visit our website for many powerful trading system and strategy:
http://algotrading-investment.com/
https://www.mql5.com/en/users/financeengineer/seller#products

Young Ho Seo
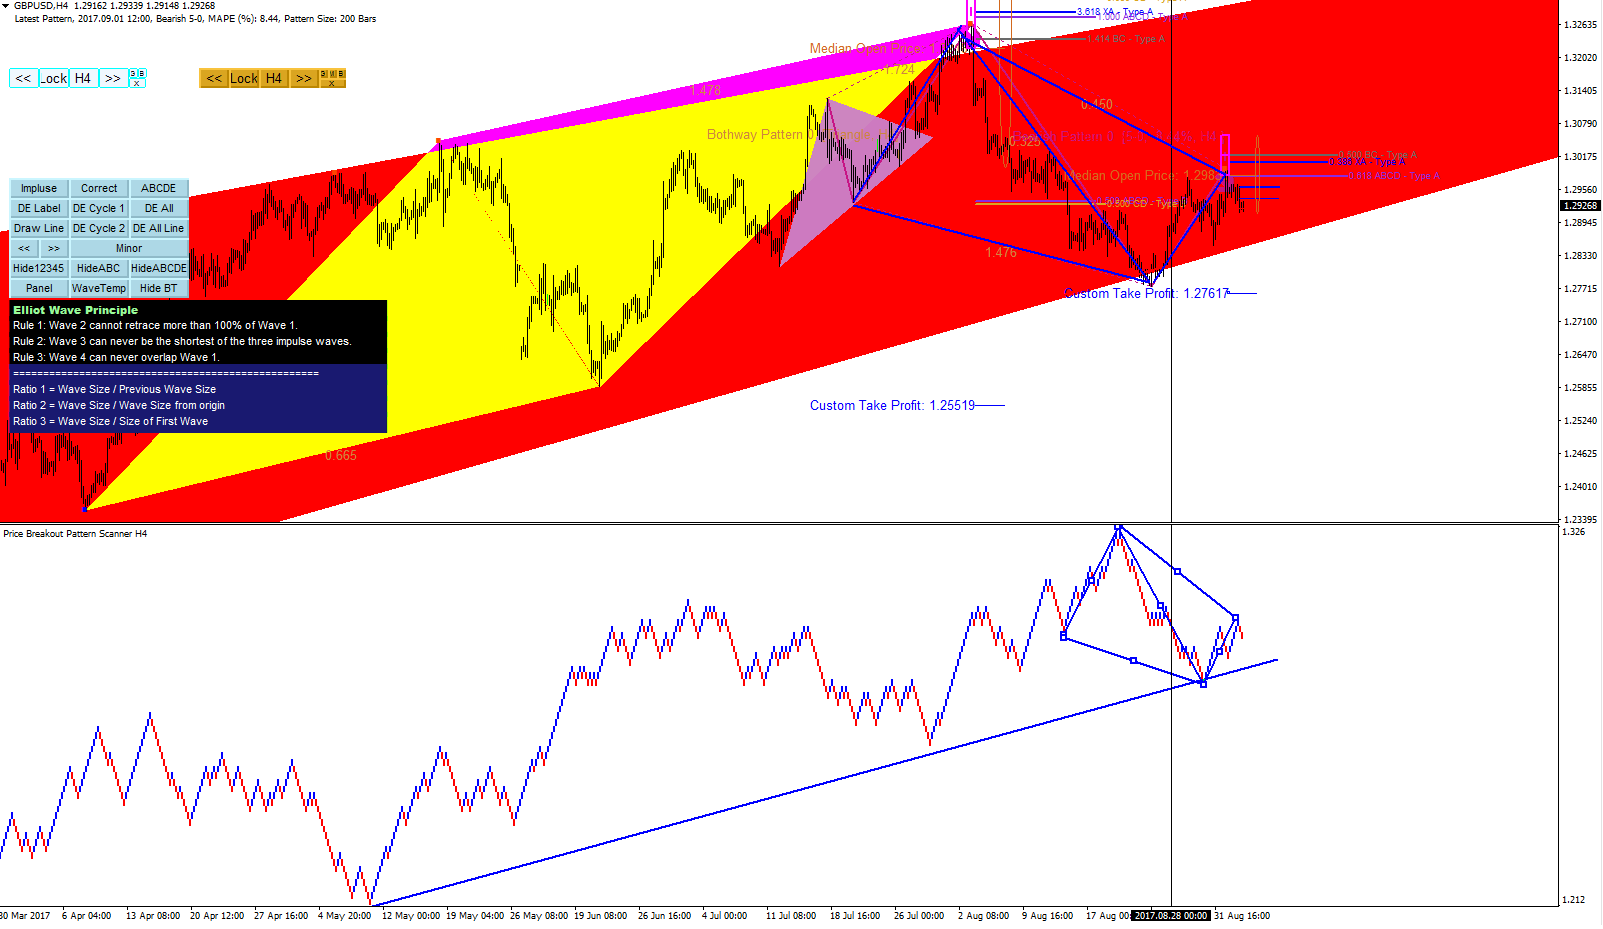
GBPUSD Market Outlook
In spite of the fact that GBPUSD started with the upwards gap on its open, GBPUSD made a bearish move on Monday. It seems that the formation of bearish 5-0 provided a good turning point for GBPUSD on Monday although the volatility was not great. We can expect more volatility today and tomorrow as US will reveal more option with the current NK situation.
If you are looking for powerful trading system, do not miss to visit our website:
http://algotrading-investment.com
https://www.mql5.com/en/users/financeengineer/seller#products

Young Ho Seo

Special Offer Available on Advanced Price Pattern Scanner
It is a good time to get this advanced Price Pattern Scanner at discounted Price. Experience the superb pattern scanning ability for your trading.
http://algotrading-investment.com/latest-offer/
http://algotrading-investment.com/product/advanced-price-pattern-scanner-mt4/
If you have any question regards to this special offer,
feel free to contact on sales@algotrading-investment.com.

Young Ho Seo
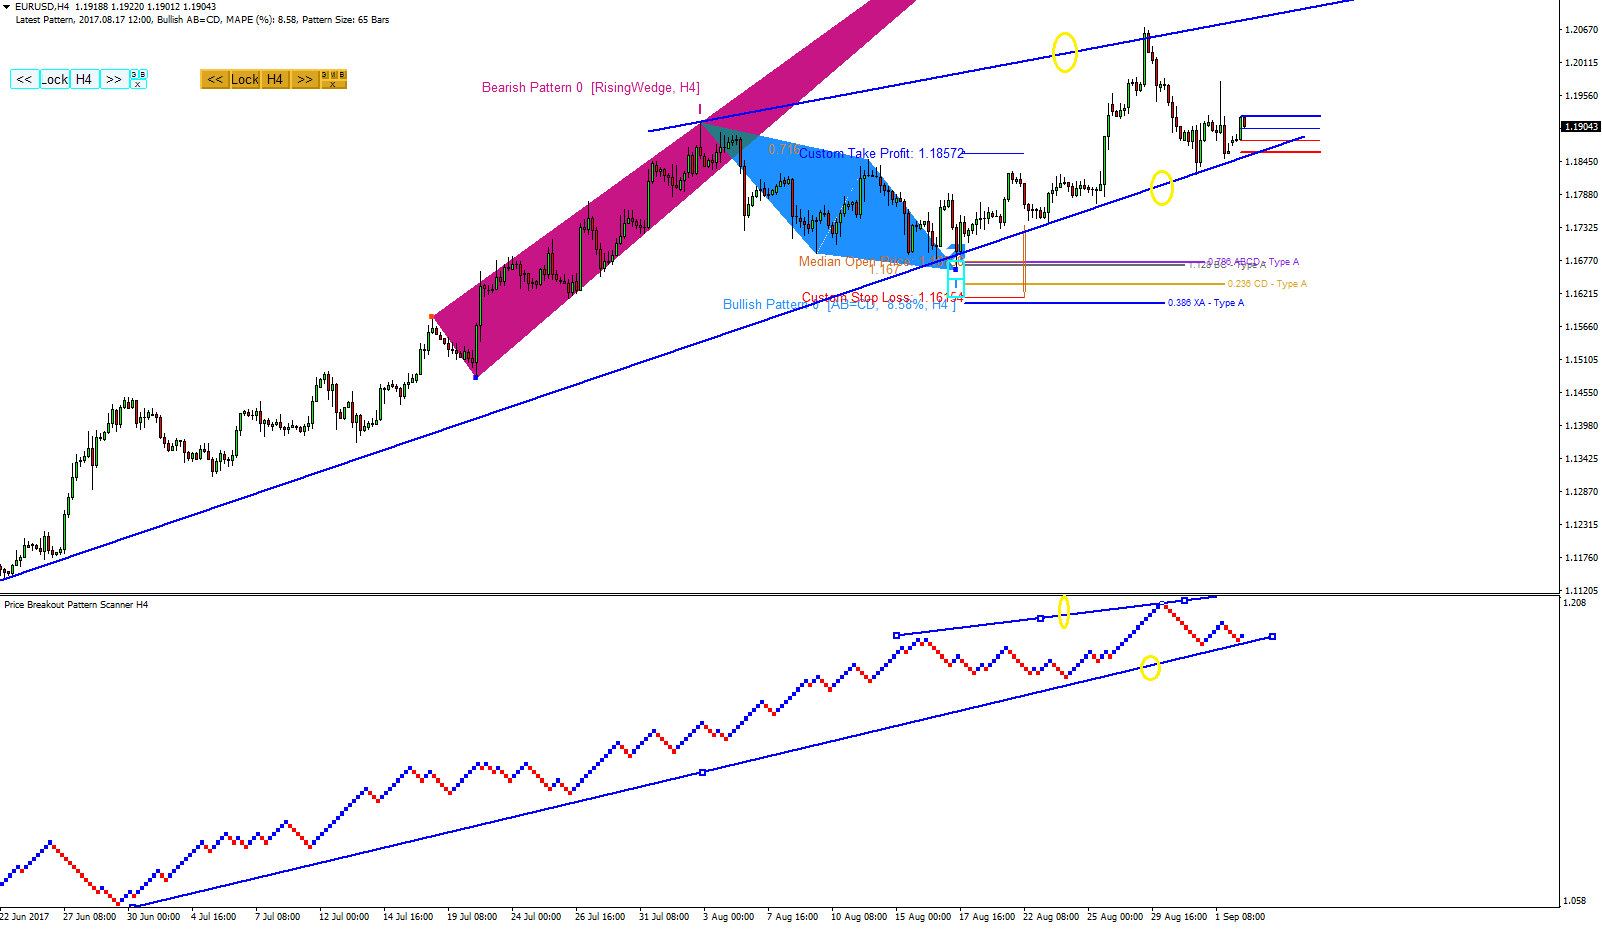
EURUSD Market Outlook
With the new outlook on the North Korean Tension, we have also changed our Market Outlook of EURUSD. As we have mentioned earlier, it is very unlikely that NK will give up what they were developing before. At the same time, the role of china and Russia will become more and more important for the current situation. I think the tension will definitely influence the financial markets next few weeks. So we recommend to watch out these new support and resistance lines for EURUSD next few weeks. Currently EURUSD made the first up brick after the 200 pip minor correction earlier.
If you are looking for powerful trading system and strategy, do not miss to visit our website:
http://algotrading-investment.com
https://www.mql5.com/en/users/financeengineer/accounting

Young Ho Seo
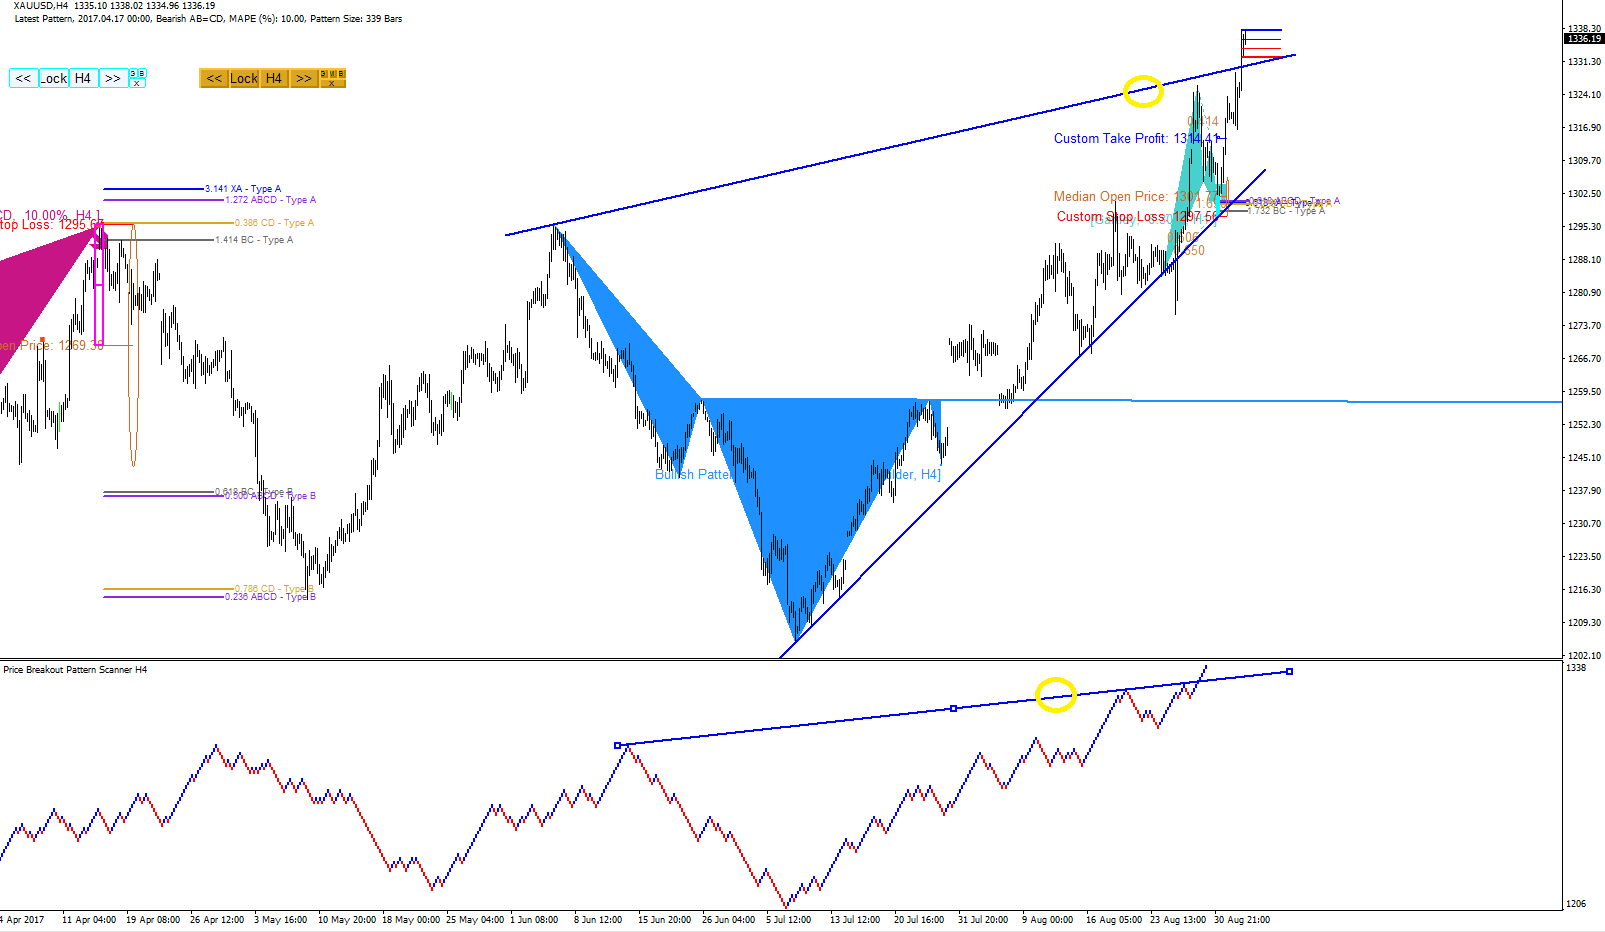
XAUUSD Market Outlook
Since the reverse head and shoulder pattern in July, Gold price was consistently going up. With the tension getting greater with North Korea, Gold price was bullish through out the August too.
After the minor correction in End of August, Gartley pattern indicated another bullish turning point in Gold price. Currently it has broken significant resistance lines at 1330.00.
Currently it is 800 points above the critical level (circled in yellow).
If you are looking for powerful trading system and strategy, do not miss to visit our website:
http://algotrading-investment.com
https://www.mql5.com/en/users/financeengineer/accounting

Young Ho Seo
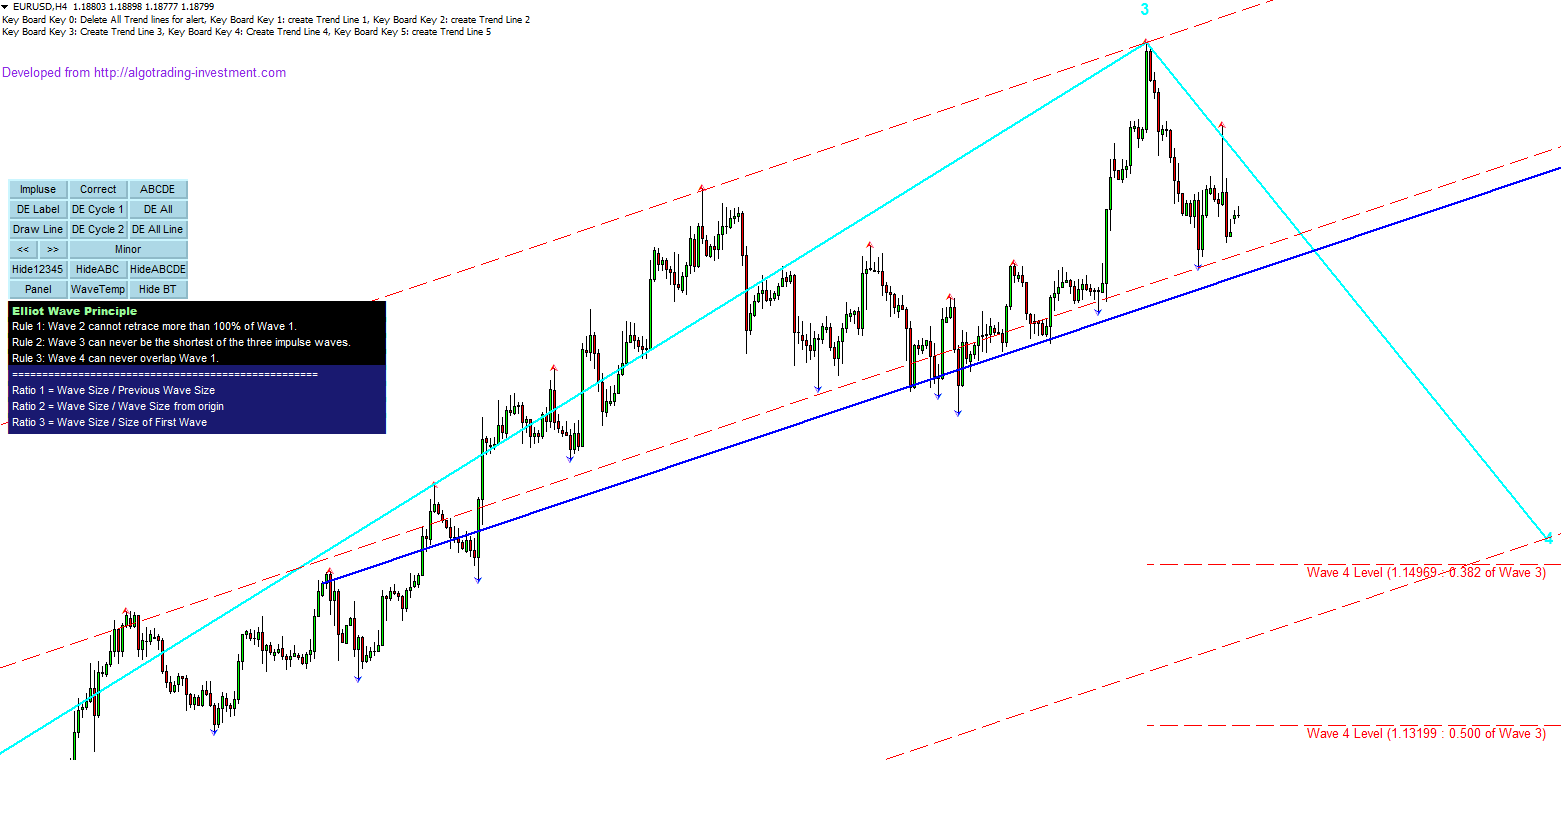
Forex Market Outlook
As we have discussed in our previous post, all the forex Market have been kicked with volatile start.
As we expected, US responsed with rather strong statement to the 6th Nuclear testing from North Korea.
As a results, we had EURUSD and USDJPY started with gap. Gold have been also gaining a lot at its opening.
If you are looking for powerful trading system and strategy, then do not miss to visit our website:
http://algotrading-investment.com
https://www.mql5.com/en/users/financeengineer/seller#products

Young Ho Seo
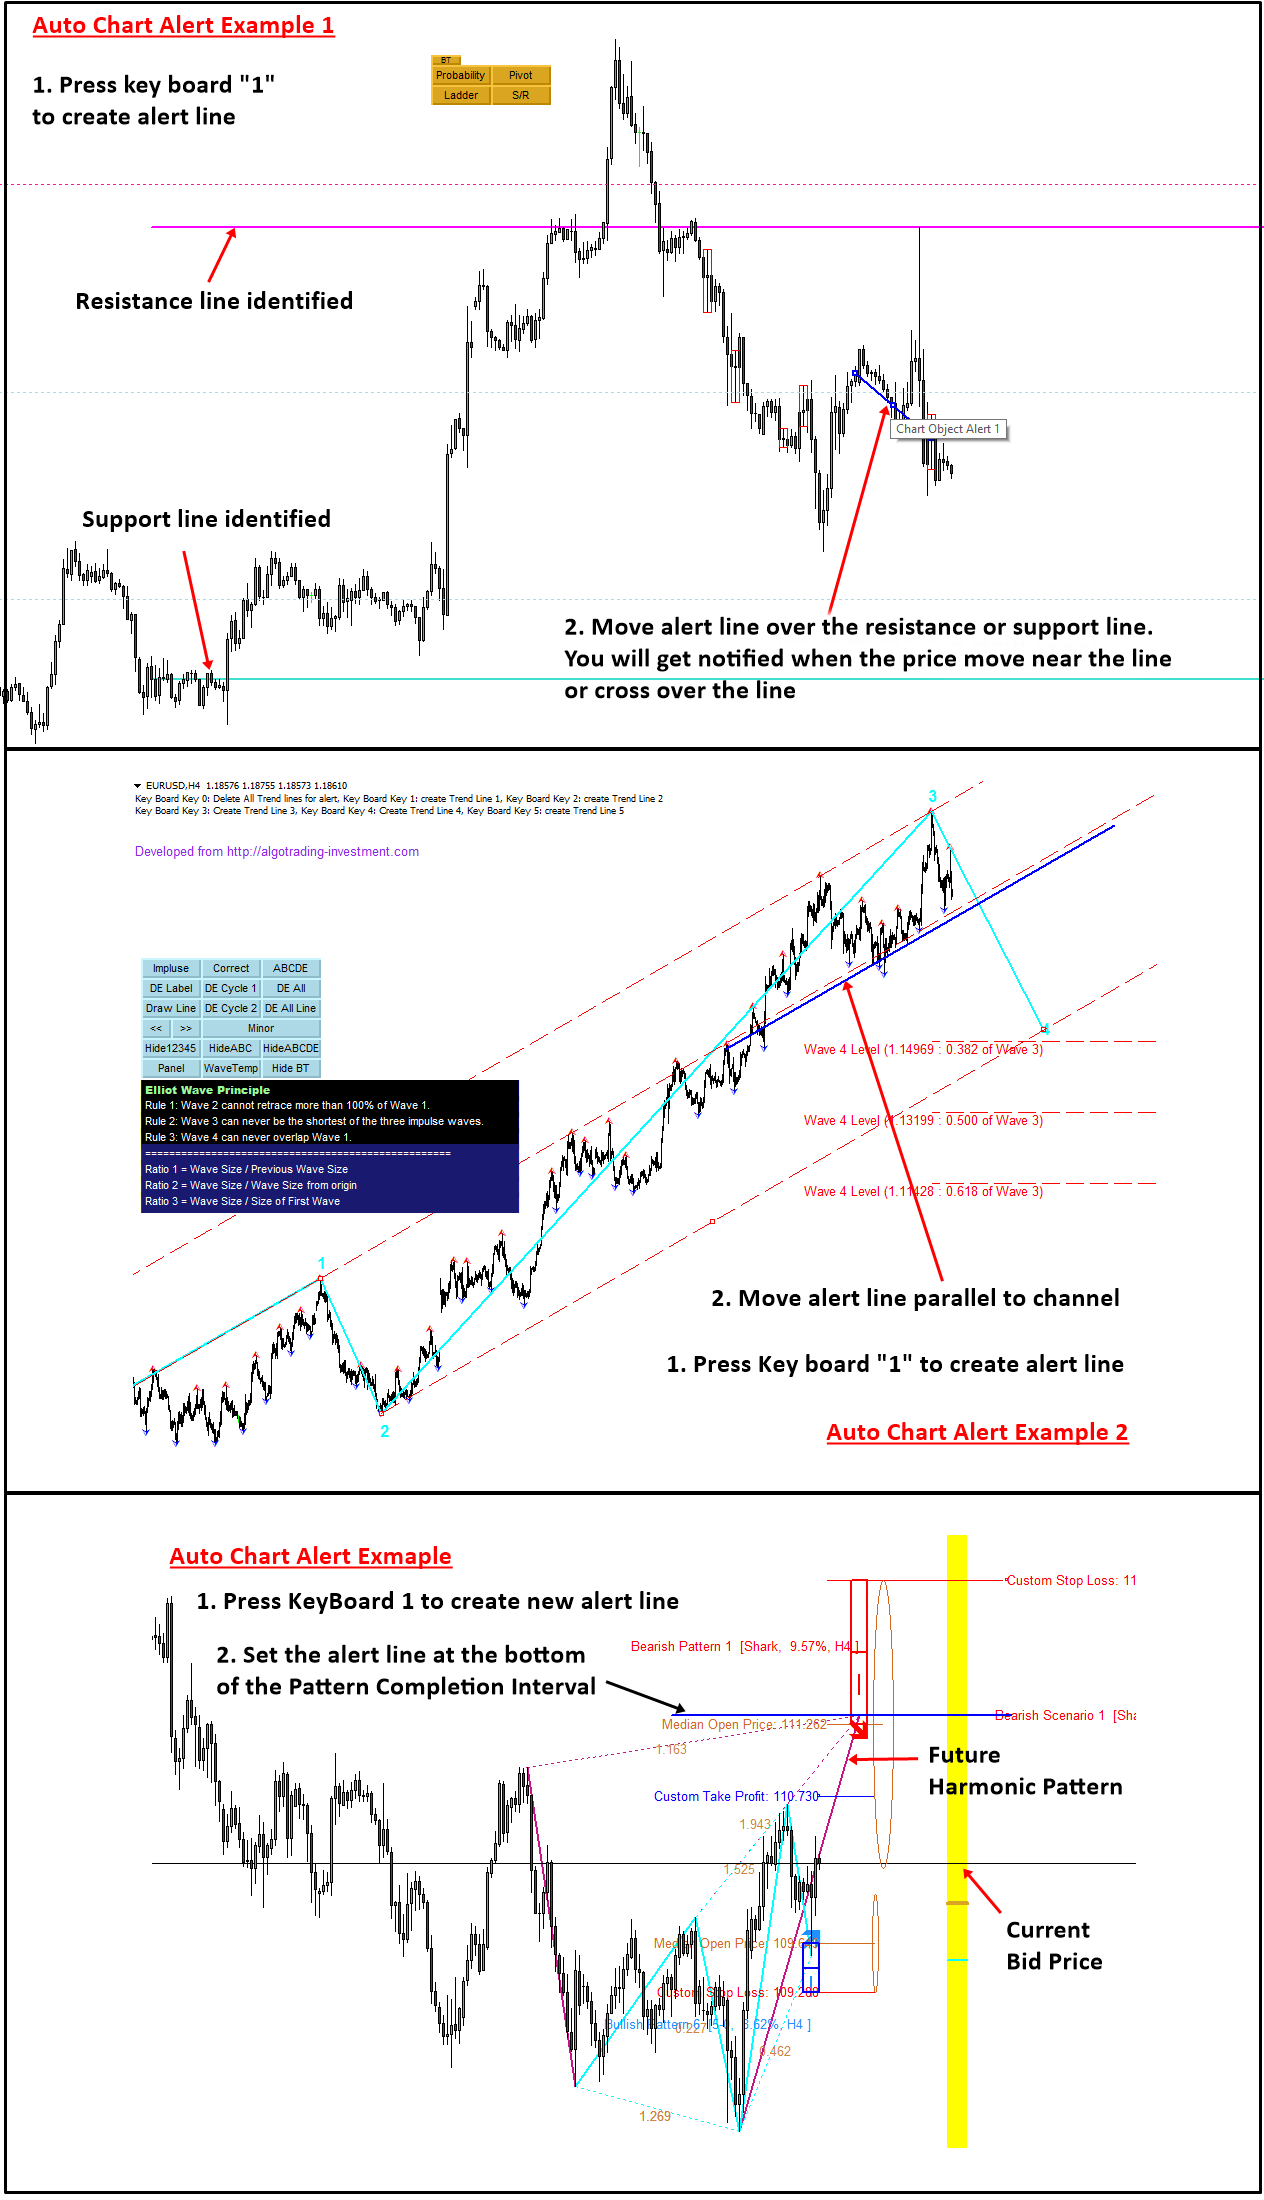
New Product Auto Chart Alert Released
Finally we have released new product Auto Chart Alert.
http://algotrading-investment.com/portfolio-item/auto-chart-alert-2/
Auto Chart Alert is a convenient tool to set alert for your trading in your chart. With Auto Chart Alert, you can set the alert line in few seconds in your desired location in your chart. After that, you can receive the sound alert, email and push notification when the price hit the alert line at you desired location.
You can also set your alert lines in any shaped you like.
Auto Chart Alert is great trading solution for Price Action and Pattern Trading. You can use the Auto Chart Alert for the following trading strategy or system.
•Traditional support and resistance trading
•Round number (psychological number) trading
•Price Breakout Pattern Scanner (Advanced Price Pattern Scanner)
•Harmonic Pattern Plus
•Sideways market analyser
•Any other Price Action and Pattern Trading system
http://algotrading-investment.com/portfolio-item/auto-chart-alert-2/
If you are looking for powerful trading system or trading strategy, visit our website:
http://algotrading-investment.com/
https://www.mql5.com/en/users/financeengineer/seller#products

Young Ho Seo
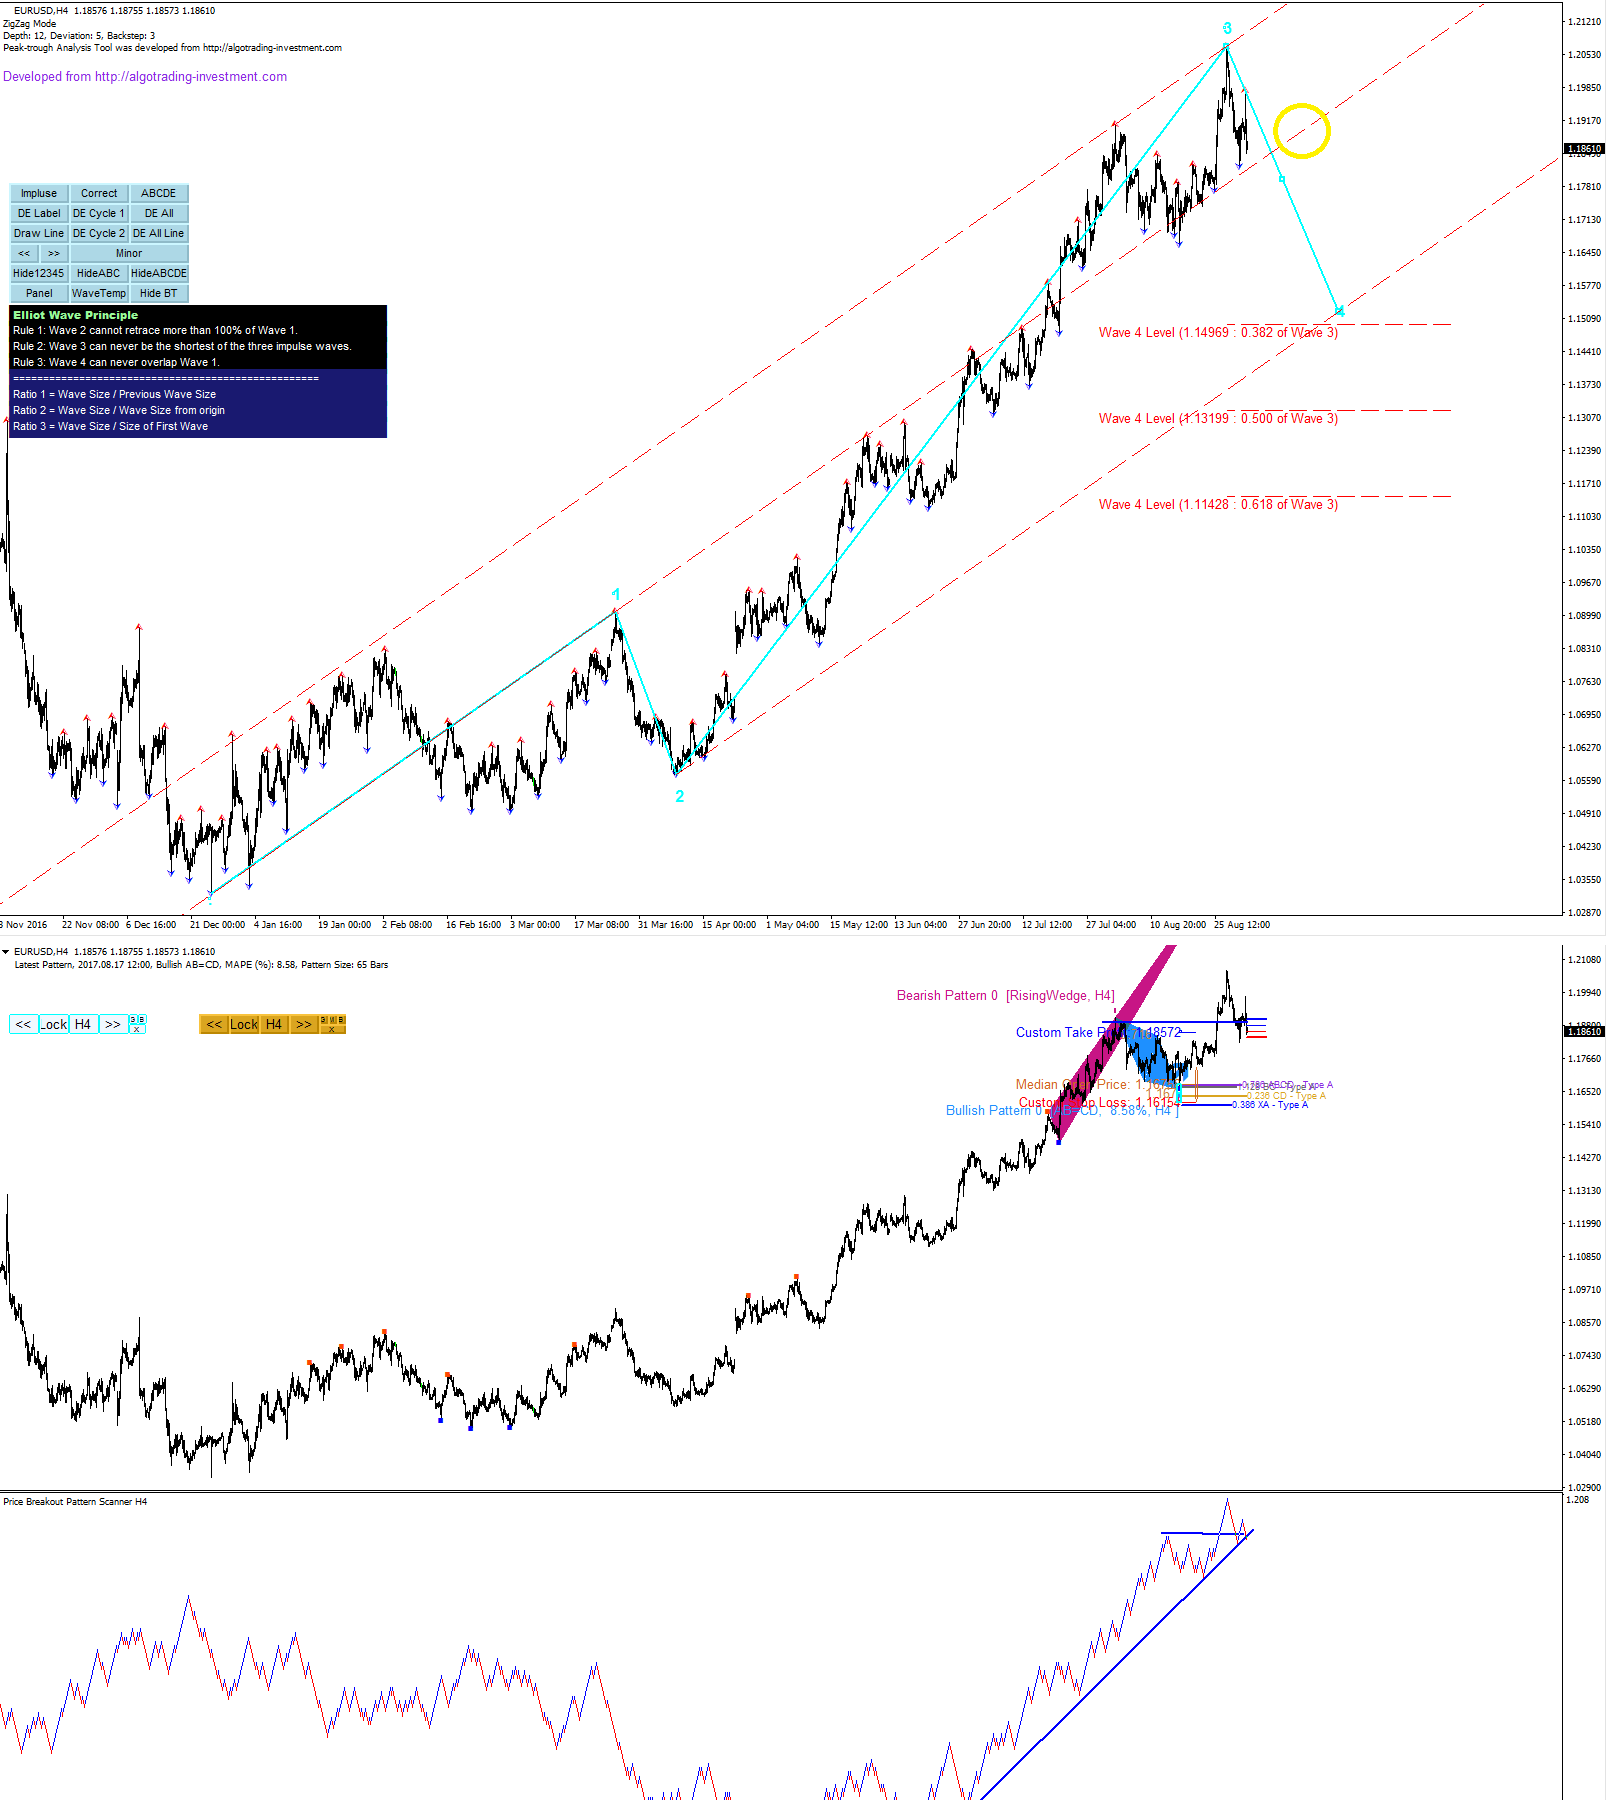
EURUSD Market Outlook
Today, an earthquake of magnitude around 6 have been detected from North Korea near the nuclear test site in Pung-Gye-Ri.
Apparently North Korea claimed that they have succeeded in making a more developed hydrogen bomb and mounting it on the tip of a long-range missile.
So how threatening is this hydrogen bomb testing from NK? If the hydrogen bomb was really developed and they are mountable on the long range missile, I think this is very serious threatening. This would be even more threatening than the previous missile firing across Japan. At least, the combined effect of past two missile firing and this hydrogen bomb testing will stir the financial market quite a lot in next few weeks.
NK do look like playing some political game with US and the rest of the world. However, in my personal opinion, they are no more than following the development plan of the nuclear missile in the timely order from the very beginning. They can change the time interval between the testing either slowing it down or making it faster. The fact is that they will never stop until they really got one.
US and the rest of the worlds are amused only on this exchanging of words in this political game whereas NK was stick with more factual output of developing nuclear missile. So who would be winner as time goes?
Soon we will hear more from US about what options are on the table.
If you are looking for powerful trading system, do not forget to visit our website:
http://algotrading-investment.com/
https://www.mql5.com/en/users/financeengineer/seller#products

Young Ho Seo
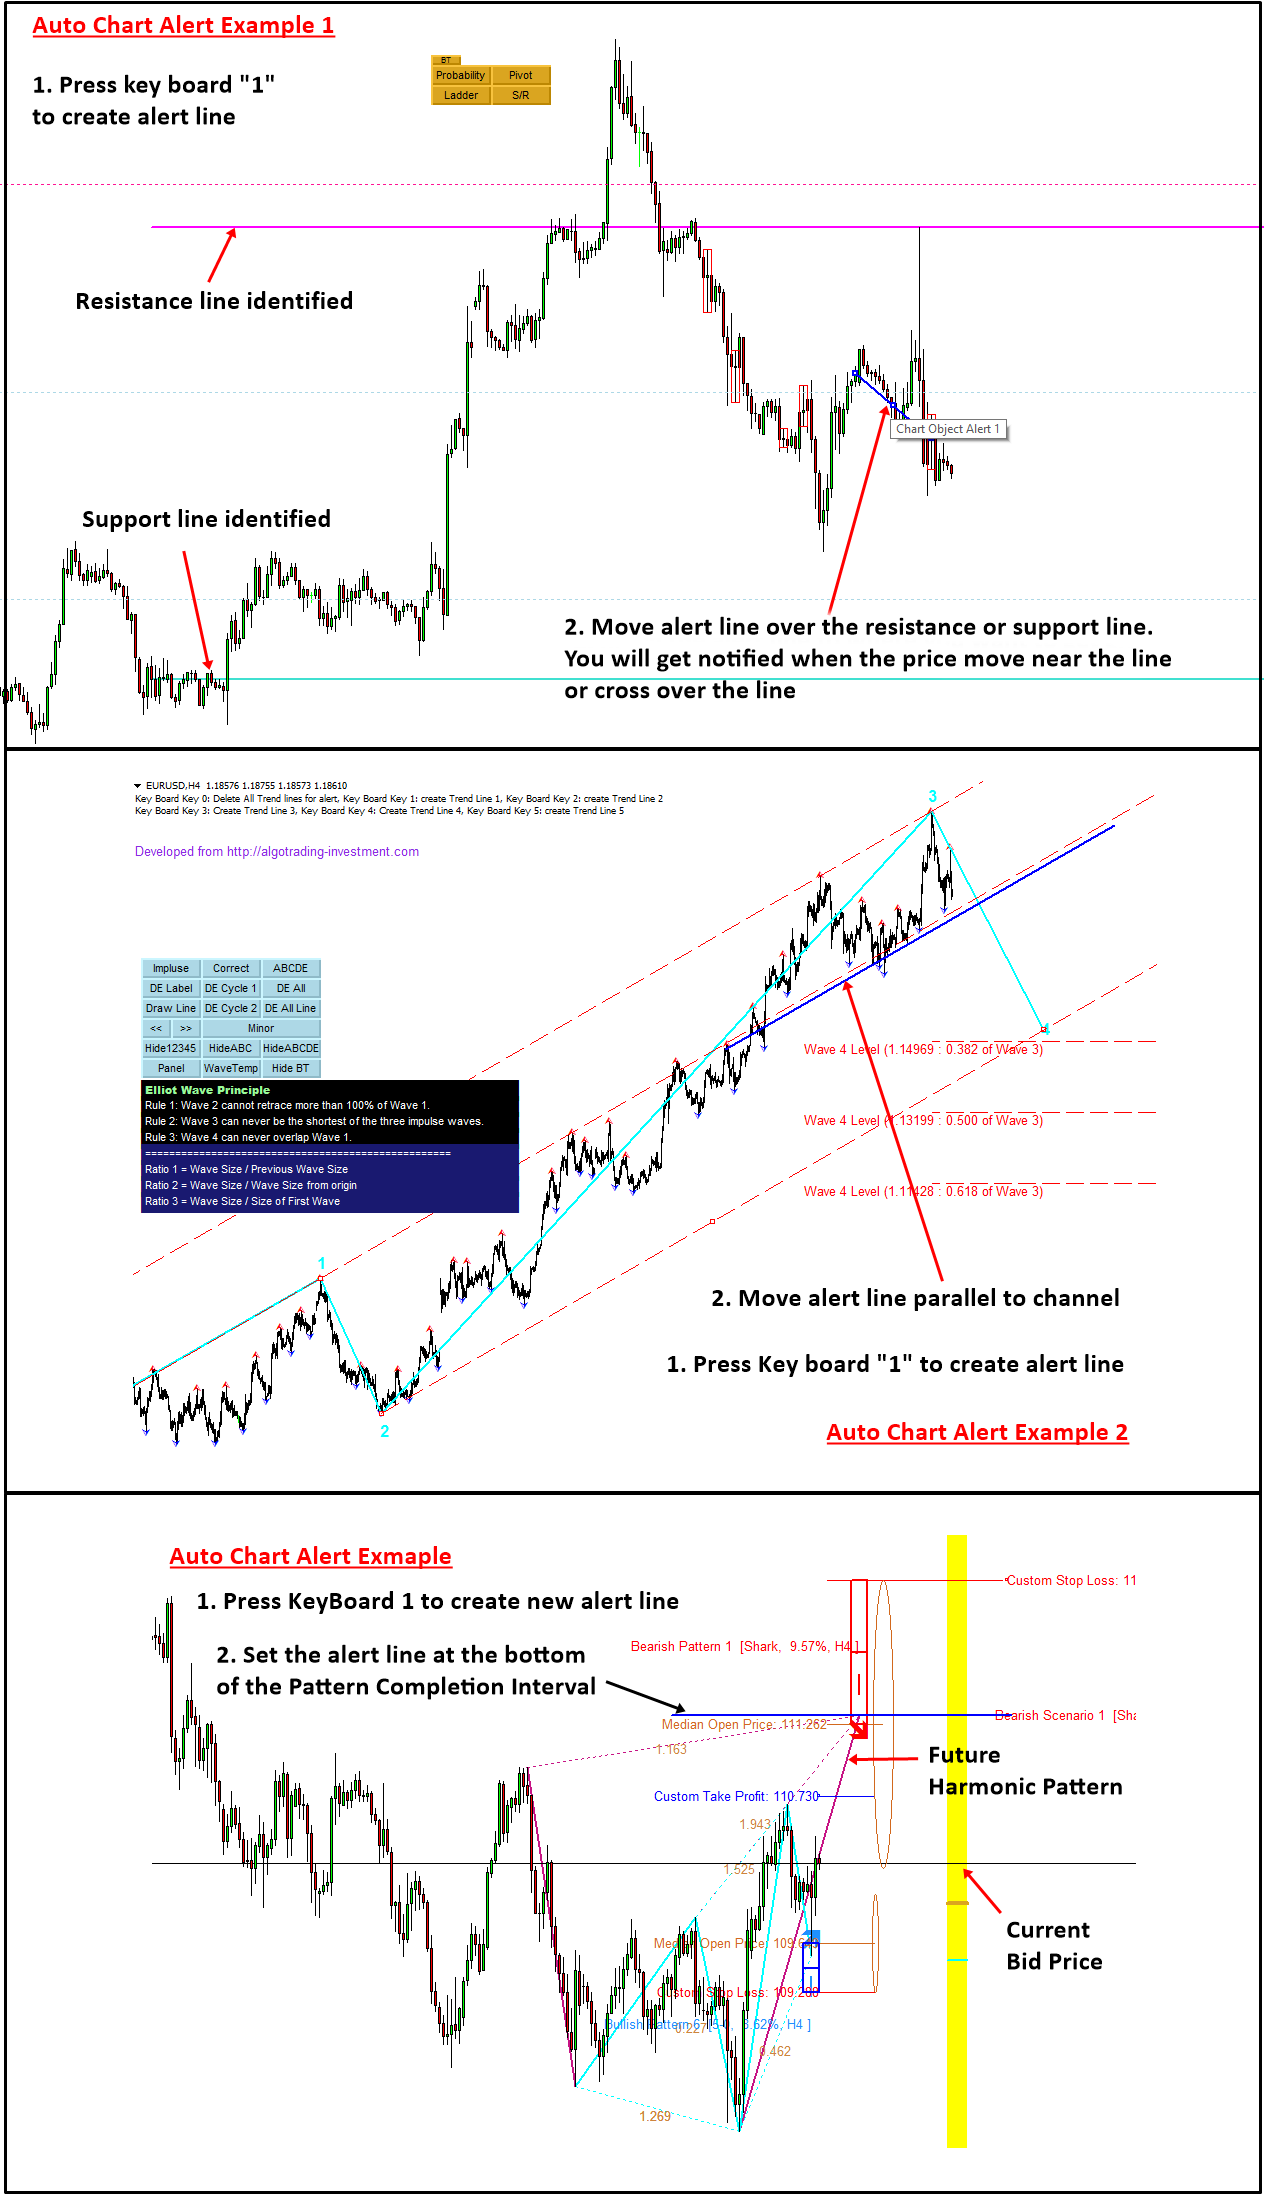
How to Use Auto Chart Alert
In your trading, alert is one important tool that helps you not to miss the important trading opportunity. In addition, alert can save your time for sitting in front of your screen. Auto Chart Alert is very flexible alert solution. You can extend your alert for push notification or email with our Auto Chart Alert.
There are many ways you can incorporate this useful alert tool in your trading. In one of the simple example, you can use this tool for simple support resistance trading. You can simply set one of the alert line around support or resistance lines by following the steps:
1.Press Keyboard "1" to create new alert line
2.Move the alert line to support or resistance line in your chart. So you will get alert when price move near the alert line.
If you wish you can set multiple alert lines in your chart. For example, to create 2nd and 3rd alert line, Press Keyboard "2" and "3". Make sure that you are creating another one after moving the previous alert line to the desired location first. To delete all the alert lines, just Press Keyboard "0".
In another simple example, imagine that you are doing some Elliott Wave analysis to decide your trading. Assume that you have counted on Elliott Wave 123 pattern and you want to trade on Elliott Wave 4. Once analysis is done, set the alert line for your trading following the steps below:
•Press Keyboard "1" to create new alert line
•Move the alert line in parallel to channel. So you will get alerted when the price come near the channel line.
Likewise, you can apply Auto Chart Alert for any trading system including Price Breakout Pattern Scanner, Sideways Market Analyser, Harmonic Pattern Plus, etc. It can be even used for other trading system outside our market place.
One interesting application can be applying the alert line to the future Harmonic Pattern from Harmonic Pattern Scenario Planner. That way you can be notified when the future Harmonic Pattern become realized in your chart.
If you are looking for powerful trading system, visit our website:
http://algotrading-investment.com
https://www.mql5.com/en/users/financeengineer/seller#products

: