Young Ho Seo / プロファイル
- 情報
|
12+ 年
経験
|
62
製品
|
1207
デモバージョン
|
|
4
ジョブ
|
0
シグナル
|
0
購読者
|
Harmonic Pattern Indicator - Repainting + Japanese Candlestick Pattern Scanner + Automatic Channel + Many more
https://www.mql5.com/en/market/product/4488
https://www.mql5.com/en/market/product/4475
https://algotrading-investment.com/portfolio-item/harmonic-pattern-plus/
Non Repainting and Non Lagging Harmonic Pattern Indicator – Customizable Harmonic + Japanese Candlestic Pattern Scanner + Advanced Channel + Many more
https://www.mql5.com/en/market/product/41993
https://www.mql5.com/en/market/product/41992
https://algotrading-investment.com/portfolio-item/profitable-pattern-scanner/
Supply Demand Indicator – Multiple Timeframe Scanning Added + Non Repainting + Professional Indicator
https://www.mql5.com/en/market/product/40076
https://www.mql5.com/en/market/product/40075
https://algotrading-investment.com/portfolio-item/ace-supply-demand-zone/
Momentum Indicator – Path to Volume Spread Analysis
https://www.mql5.com/en/market/product/30641
https://www.mql5.com/en/market/product/30621
https://algotrading-investment.com/portfolio-item/excessive-momentum-indicator/
Elliott Wave Indicator for the Power User
https://www.mql5.com/en/market/product/16479
https://www.mql5.com/en/market/product/16472
https://algotrading-investment.com/portfolio-item/elliott-wave-trend/
Forex Prediction - Turn Support and Resistance to the Advanced Strategy
https://www.mql5.com/en/market/product/49170
https://www.mql5.com/en/market/product/49169
https://algotrading-investment.com/portfolio-item/fractal-pattern-scanner/
MetaTrader 4 and MetaTrader 5 Product Page: https://www.mql5.com/en/users/financeengineer/seller#products
Free Forex Prediction with Fibonacci Analysis: https://algotrading-investment.com/2020/10/23/forex-prediction-with-fibonacci-analysis/
Free Harmonic Pattern Signal: https://algotrading-investment.com/2020/12/17/harmonic-pattern-signal-for-forex-market/
============================================================================================================================
Here are the trading education books. We recommend reading these books if you are a trader or investor in Forex and Stock market. In the list below, we put the easy to read book on top. Try to read the easy to read book first and try to read the harder book later to improve your trading and investment.
First Link = amazon.com, Second Link = Google Play Books, Third Link = algotrading-investment.com, Fourth Link = Google Books
Technical Analysis in Forex and Stock Market (Supply Demand Analysis and Support Resistance)
https://www.amazon.com/dp/B09L55ZK4Z
https://play.google.com/store/books/details?id=pHlMEAAAQBAJ
https://algotrading-investment.com/portfolio-item/technical-analysis-in-forex-and-stock-market/
https://books.google.co.kr/books/about?id=pHlMEAAAQBAJ
Science Of Support, Resistance, Fibonacci Analysis, Harmonic Pattern, Elliott Wave and X3 Chart Pattern (In Forex and Stock Market Trading)
https://www.amazon.com/dp/B0993WZGZD
https://play.google.com/store/books/details?id=MME3EAAAQBAJ
https://algotrading-investment.com/portfolio-item/science-of-support-resistance-fibonacci-analysis-harmonic-pattern/
https://books.google.co.kr/books/about?id=MME3EAAAQBAJ
Profitable Chart Patterns in Forex and Stock Market (Fibonacci Analysis, Harmonic Pattern, Elliott Wave, and X3 Chart Pattern)
https://www.amazon.com/dp/B0B2KZH87K
https://play.google.com/store/books/details?id=7KrQDwAAQBAJ
https://algotrading-investment.com/portfolio-item/profitable-chart-patterns-in-forex-and-stock-market/
https://books.google.com/books/about?id=7KrQDwAAQBAJ
Guide to Precision Harmonic Pattern Trading (Mastering Turning Point Strategy for Financial Trading)
https://www.amazon.com/dp/B01MRI5LY6
https://play.google.com/store/books/details?id=8SbMDwAAQBAJ
http://algotrading-investment.com/portfolio-item/guide-precision-harmonic-pattern-trading/
https://books.google.com/books/about?id=8SbMDwAAQBAJ
Scientific Guide to Price Action and Pattern Trading (Wisdom of Trend, Cycle, and Fractal Wave)
https://www.amazon.com/dp/B073T3ZMBR
https://play.google.com/store/books/details?id=5prUDwAAQBAJ
https://algotrading-investment.com/portfolio-item/scientific-guide-to-price-action-and-pattern-trading/
https://books.google.com/books/about?id=5prUDwAAQBAJ
Predicting Forex and Stock Market with Fractal Pattern: Science of Price and Time
https://www.amazon.com/dp/B086YKM8BW
https://play.google.com/store/books/details?id=VJjiDwAAQBAJ
https://algotrading-investment.com/portfolio-item/predicting-forex-and-stock-market-with-fractal-pattern/
https://books.google.com/books/about?id=VJjiDwAAQBAJ
Trading Education Book 1 in Korean (Apple, Google Play Book, Google Book, Scribd, Kobo)
https://books.apple.com/us/book/id1565534211
https://play.google.com/store/books/details?id=HTgqEAAAQBAJ
https://books.google.co.kr/books/about?id=HTgqEAAAQBAJ
https://www.scribd.com/book/505583892
https://www.kobo.com/ww/en/ebook/8J-Eg58EDzKwlpUmADdp2g
Trading Education Book 2 in Korean (Apple, Google Play Book, Google Book, Scribd, Kobo)
https://books.apple.com/us/book/id1597112108
https://play.google.com/store/books/details?id=shRQEAAAQBAJ
https://books.google.co.kr/books/about?id=shRQEAAAQBAJ
https://www.scribd.com/book/542068528
https://www.kobo.com/ww/en/ebook/X8SmJdYCtDasOfQ1LQpCtg
About Young Ho Seo
Young Ho Seo is an Engineer, Financial Trader, and Quantitative Developer, working on Trading Science and Investment Engineering since 2011. He is the creator of many technical indicators, price patterns and trading strategies used in the financial market. He is also teaching the trading practice on how to use the Supply Demand Analysis, Support, Resistance, Trend line, Fibonacci Analysis, Harmonic Pattern, Elliott Wave Theory, Chart Patterns, and Probability for Forex and Stock Market. His works include developing scientific trading principle and mathematical algorithm in the work of Benjamin Graham, Everette S. Gardner, Benoit Mandelbrot, Ralph Nelson Elliott, Harold M. Gartley, Richard Shabacker, William Delbert Gann, Richard Wyckoff and Richard Dennis. You can find his dedicated works on www.algotrading-investment.com . His life mission is to connect financial traders and scientific community for better understanding of this world and crowd behaviour in the financial market. He wrote many books and articles, which are helpful for understanding the technology and application behind technical analysis, statistics, time series forecasting, fractal science, econometrics, and artificial intelligence in the financial market.
If you are interested in our software and training, just visit our main website: www.algotrading-investment.com
Young Ho Seo
EURUSD Market Outlook 2 - 20 Feb 2018
So we have few analysis about EURUSD. Especially we have mentioned, that there is possibility of forming the bearish triple top in EURUSD. If you missed our previous post, then simply visit the link below:
http://tradeinvestsmart.com/2018/02/eurusd-market-outlook-2-19-feb-2018/
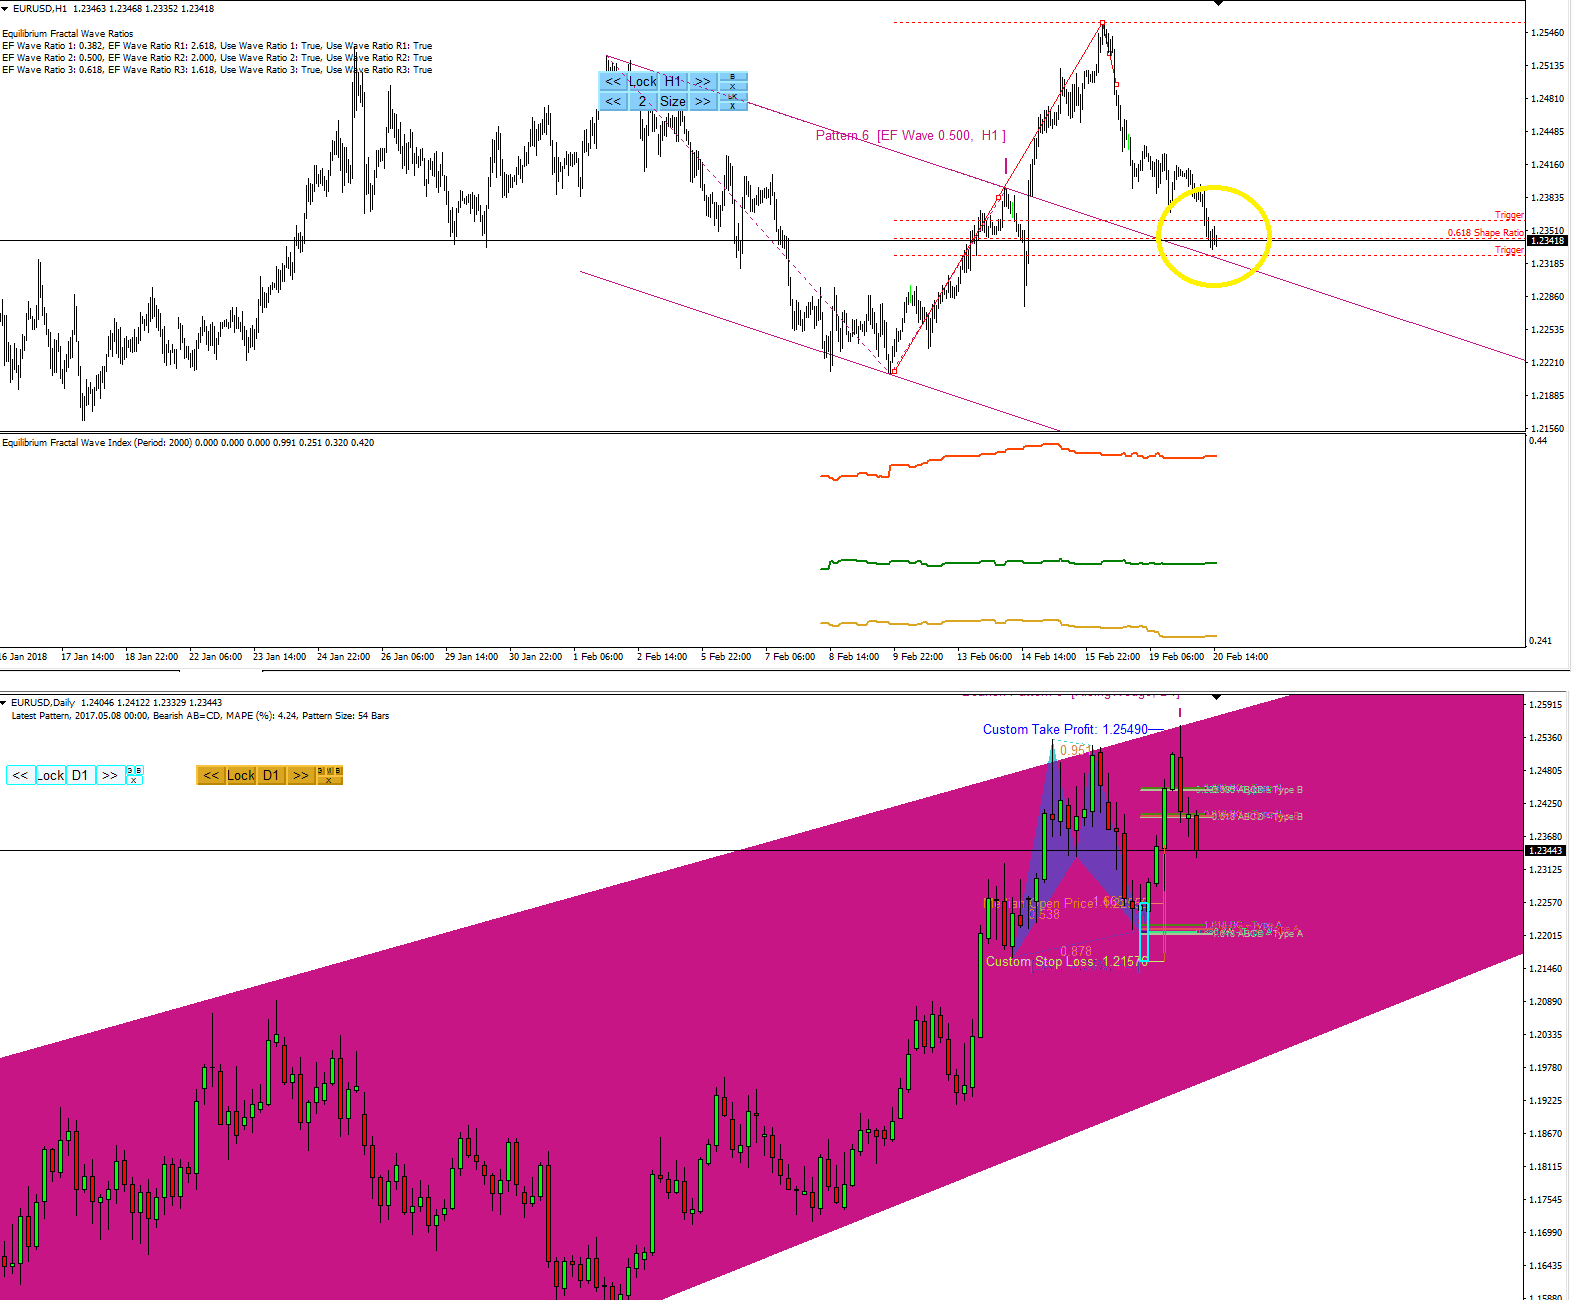
Now, as we discussed in our previous post, the EURUSD broke down below the PRZ Type B (2nd PRZ levels of the BAT pattern.) EURUSD become suddenly quite after some bearish run. Why? Here is why. EFW Channel and Shape ratio have shown that EURUSD is at critical junction. I have circled. So USA session is coming soon. If you need any action to make, then you might refer to this analysis.
http://algotrading-investment.com/
https://www.mql5.com/en/users/financeengineer/seller#products

Young Ho Seo
Buy Price Action and Pattern Trading Tools and Design the Profitability for your Trading
The difference between good and bad trading tools is based on their precision. Our Price Action and Pattern Trading Tools are highly precise and developed by the experienced quantitative developer. When you buy our list of products below, we can help you to design your profitability with our products (This free advice is applied to new customers from 20 Feb 2018. This free advice will last until we ends.). You can get this free advice from us when you buy the full version of the following products:
•Harmonic Pattern Plus
•Harmonic Pattern Scenario Planner
•Price Breakout Pattern Scanner
•Turning point detector
•Mean Reversion Supply Demand
•Advanced Price Pattern Scanner
•Elliott Wave Trading
•Pair Trading Station
•Equilibrium Fractal Wave Analytics
•Double Harmonic Volatility Indicator
•Precision Support Resistance
Simply drop us an email after you have purchased our products from mql5.com or from algotrading-investment.com. When you contact us. Please state your available trading hours per day and per week. Also state your trading experience.
Above products can be found from the links below:
http://algotrading-investment.com/
https://www.mql5.com/en/users/financeengineer/seller#products

Young Ho Seo

New Article "Golden Ratio and Financial Trading" Released
This is very useful artice for your finanical trading for both forex and stock market. Please read them for your own goods.
The article is located on this link below:
http://algotrading-investment.com/2018/02/20/golden-ratio-financial-trading/
http://tradeinvestsmart.com/2018/02/golden-ratio-and-financial-trading/

Young Ho Seo
EURUSD Market Outlook 2- 19 Feb 2018
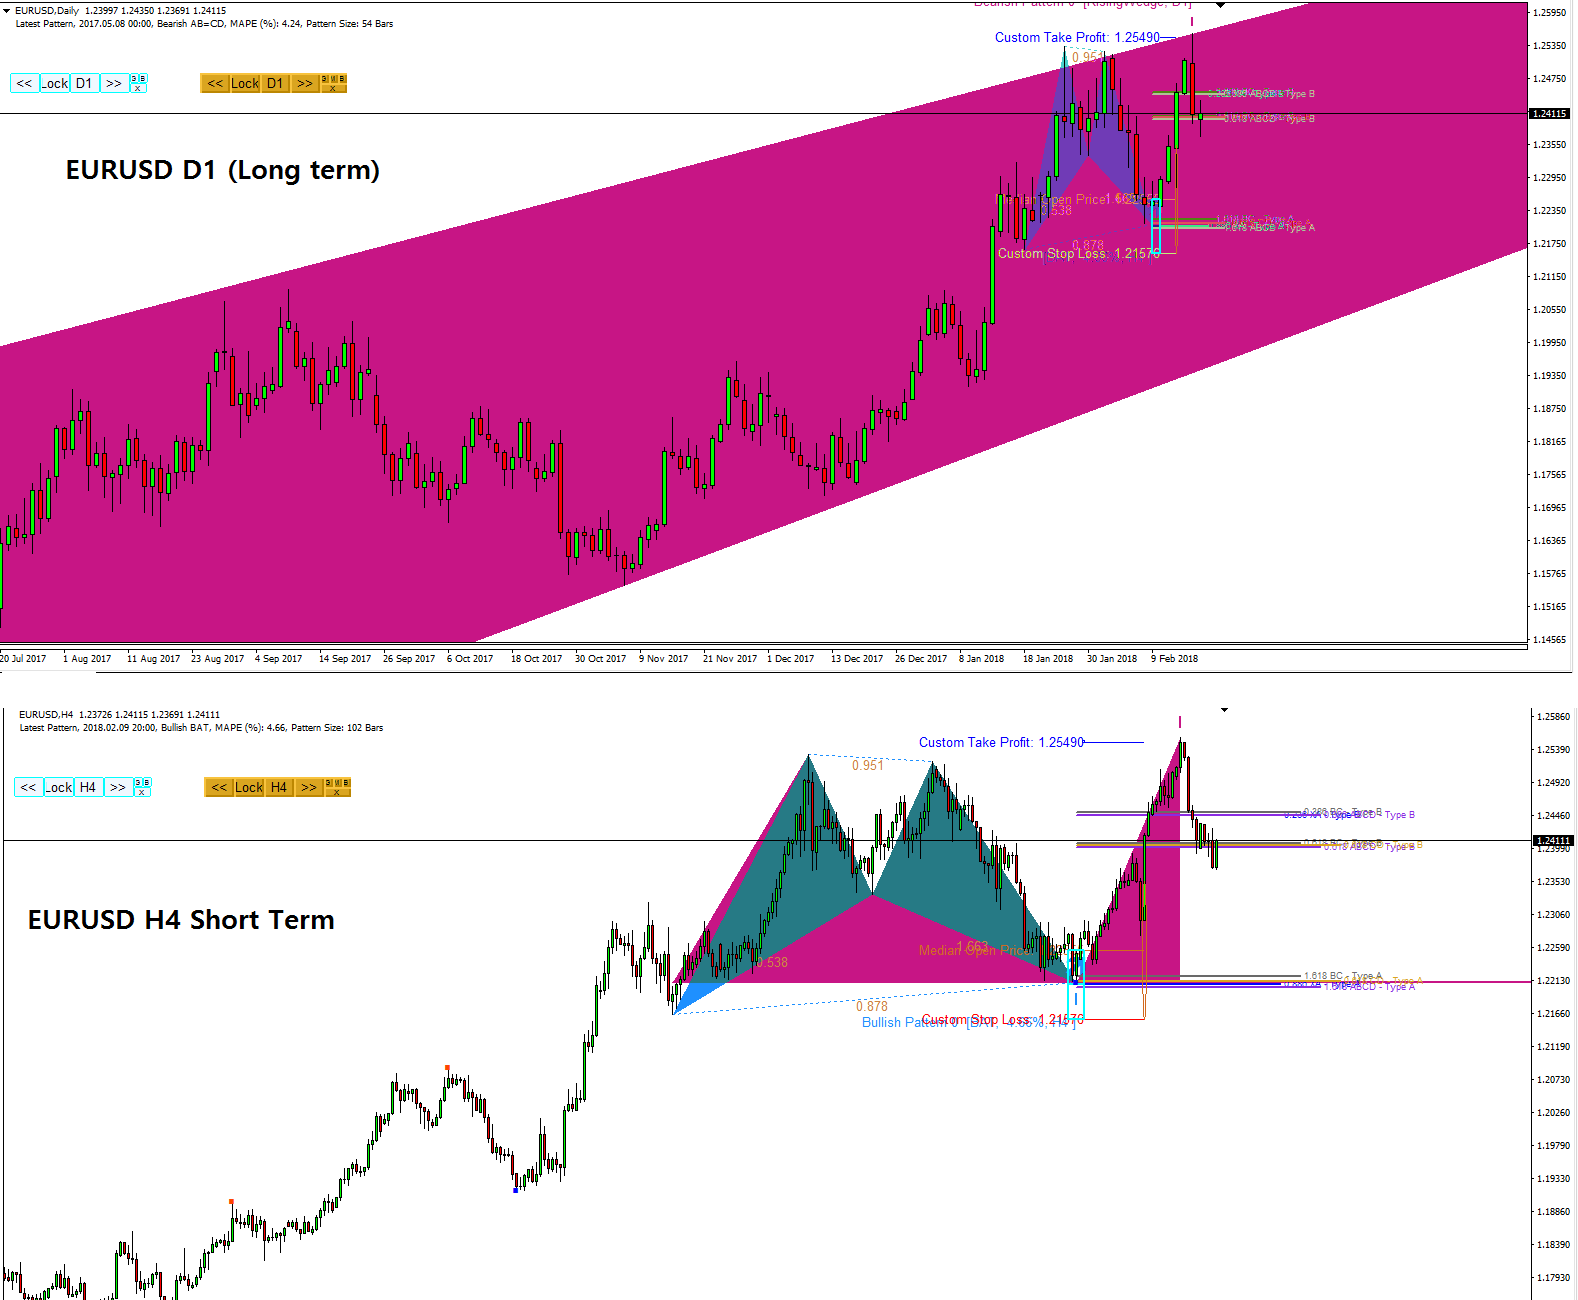
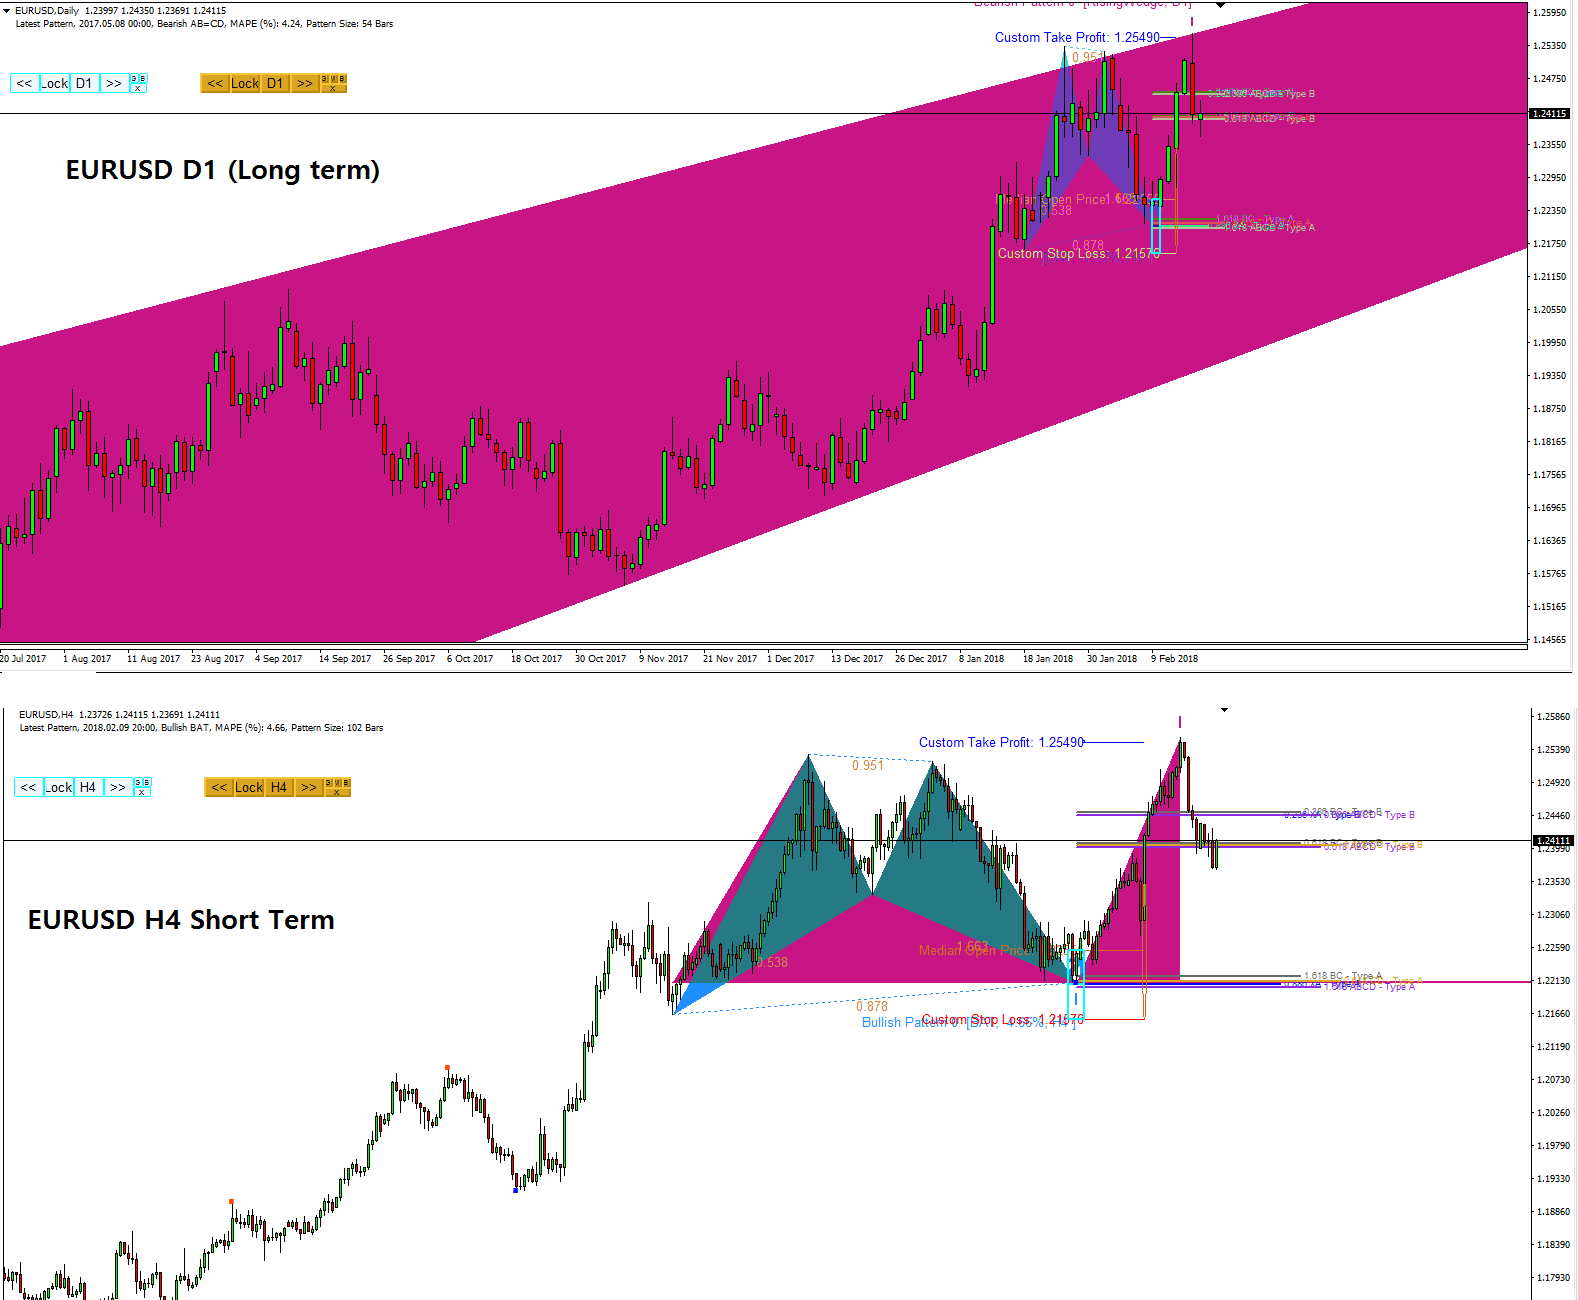
We have already made a analysis for EURUSD few times. This is both long term and short term market outlook of EURUSD.
http://algotrading-investment.com/
https://www.mql5.com/en/users/financeengineer/seller#products
We have already made a analysis for EURUSD few times. This is both long term and short term market outlook of EURUSD.
http://algotrading-investment.com/
https://www.mql5.com/en/users/financeengineer/seller#products

Young Ho Seo

EURUSD Market Outlook 19 Feb 2018
Market started on Monday rather quite. EURUSD did not make big reaction around the PRZ Type B level yet. But it is rather sitting over the level 1.2400. If the EURUSD penetrate below 1.2400 then there is a good chance to form a triple top bearish pattern further. If not, then market could rally up to 1.2550 after penetrating the first PRZ Level at 1.2450. The analysis was generated using the combination of Harmonic Pattern Plus and Price Breakout Pattern Scanner.
http://algotrading-investment.com/
https://www.mql5.com/en/users/financeengineer/seller#products

Young Ho Seo
Equilibrium Fractal Wave Analytics Powerful Update released (Version 3.1)
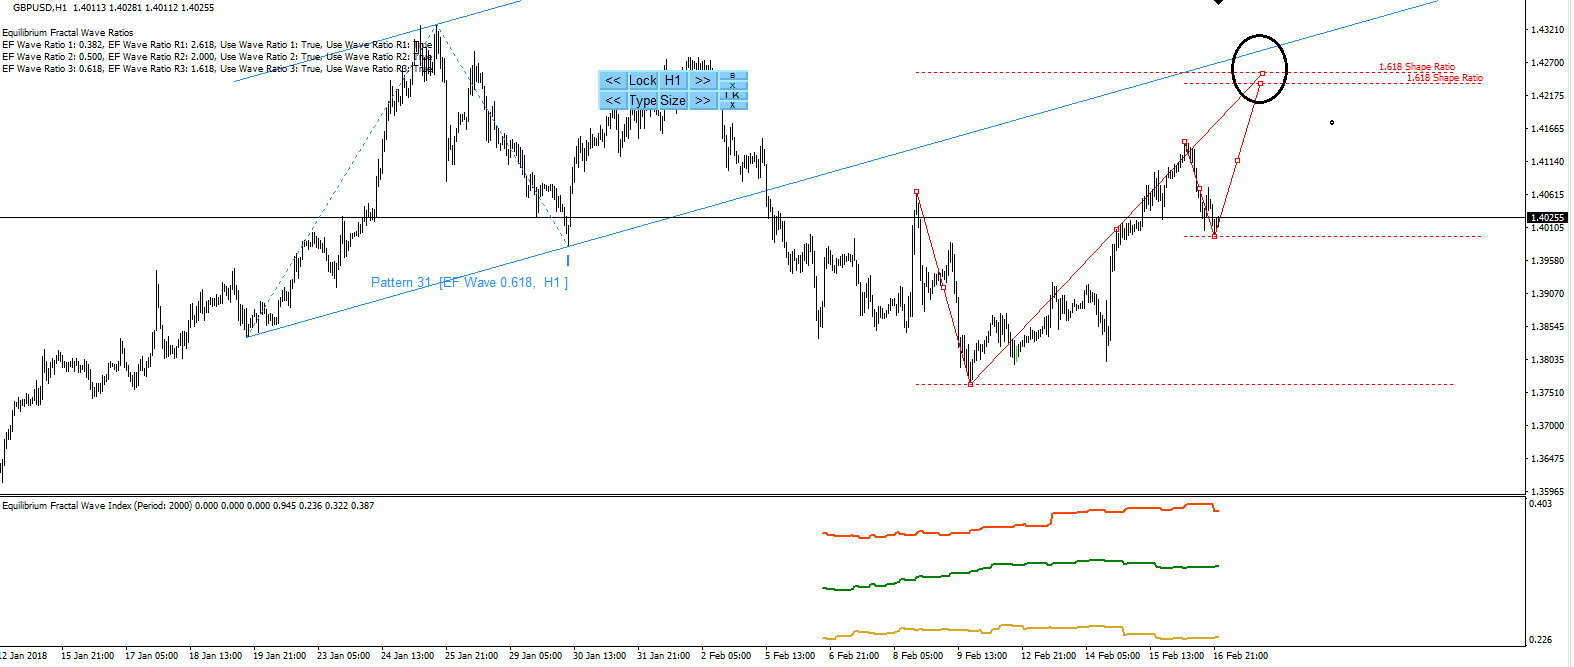
We have added another powerful feature to our Equilibrium Fractal Wave Analytics. In the new version you will be able to lock the shape ratio in your chart. This means that you can use several shape ratio at the same time. How to use is really simple. Look for 2 shape ratio overlapping together as shown in the screenshot. The screenshot shows the 2 shape ratios confirming your trading level. You can further add EFW channel for your trading on top of these. To lock the shape ratio in your chart, just press the small LK button on right.
If you have bought our products from http://algotrading-investment.com/, you will be notified this update through automatic installer.
For mql5.com customers, the update is in the processing stage. So please stay tuned. We will notify you when the new update is available.
http://algotrading-investment.com/
https://www.mql5.com/en/users/financeengineer/seller#products

Young Ho Seo
GBPUSD Market Outlook-18 Feb 2018
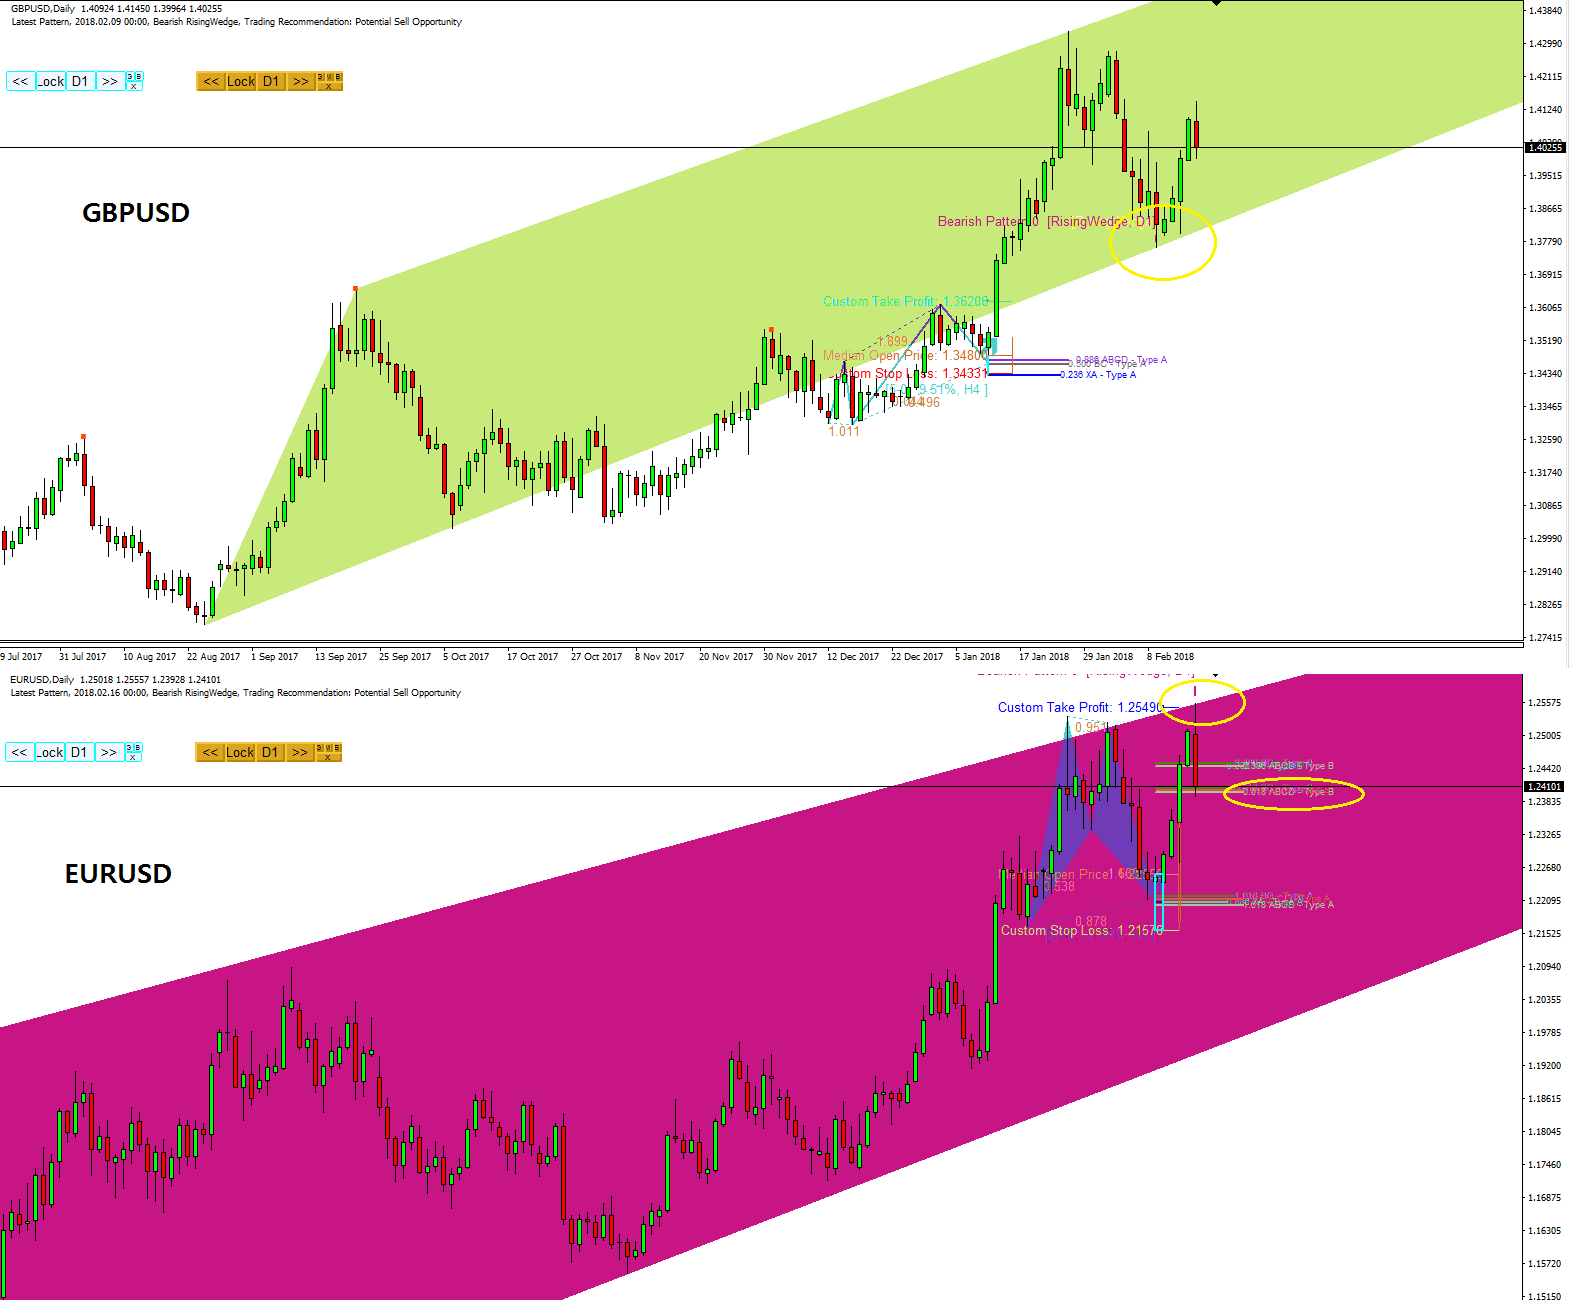
GBPUSD was in downtrend since 25 January. This might be considered as the corrective phase after the formation of 5-0 bullish pattern. One interesting finding is that GBPUSD was bounced off at the bottom of the rising wedge pattern whereas EURUSD was bounced off at the top of the rising wedge pattern. Typically EURUSD and GBPUSD are correlated positively. We are seeing some decoupling effect last week. We believe that the bottom of the rising wedge will act as an important support for GBPUSD in the future. So closely watch out for your trading.
http://algotrading-investment.com/
https://www.mql5.com/en/users/financeengineer/seller#products

Young Ho Seo
EURUSD Market Outlook - 18 Feb 2018
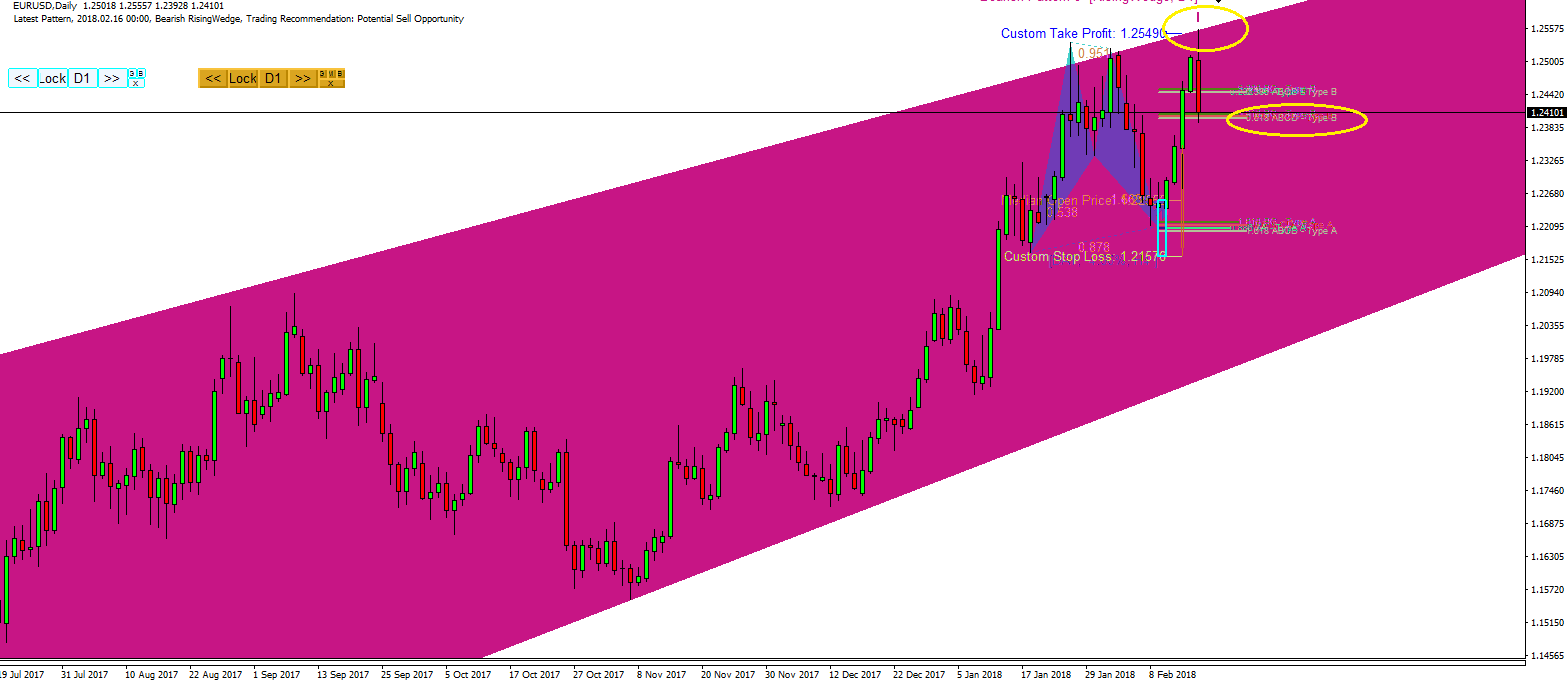
EURUSD enjoyed some bullish move after the formation of BAT pattern last week. Last week, we were concerned if EURUSD had a momentum to go further bullish. However, EURUSD made a strong bearish reaction at the top of the rising wedge (D1, Price Breakout Pattern scanner). It made around 150 pips down on the last Friday. EURUSD just stopped around the second PRZ Type B levels at 1.2400 (H4, Harmonic Pattern Plus). We got to watch out its further reaction around this second PRZ type B level next week open.
http://algotrading-investment.com
https://www.mql5.com/en/users/financeengineer/seller#products

Young Ho Seo

How to get our EBook Gift Free Offer
Just take the normal purchasing process on our products from algotrading-investment.com or from mql5.com. Please note that you can only receive the Exclusive deal once per customer. You can not receive the Exclusive deal for multiple times for multiple purchase. Customers from mql5.com must contact us to receive these ebooks since Algotrading-Investment.com are not informed your purhcase from mql5.com. Upon your request, we are happy to send you the ebooks. For any inquires on this EBook Gift Free Offer, write us on:
customer.support@algotrading-investment.com
Product link for Algotrading-Investment.com:
http://algotrading-investment.com/main-products/
Product link for MQL5.com:
https://www.mql5.com/en/users/financeengineer/seller#products

Young Ho Seo

Happy New Year 2018
Many Asian countries celebrate the new year in the moon calendar still ( that is Chinese new year). So for so many people we are also entering into the festive period again. It is strange to say Happy new year twice in a year but still why not. It is a happy festival and holidays. So here we go.
Please have a very best time in this festive period with your family and friends. Have a great 2018. I wish this to all traders and investors in the world. During this holiday period, do not forget to visit our website if you need powerful trading system and strategies and educations for your trading and investment.
http://algotrading-investment.com/
https://www.mql5.com/en/users/financeengineer/seller#products

Young Ho Seo

Remote Trade Copier Setup
Here are some remote trade copier setup you can possibly do with our remote trade copier. To achieve this, you do not need any other local copier because remote trade copier can be used as the local trade copier too. Check the screenshot.
For your information, we also offer Light Commercial package for signal provider too. Please request if you need them.
http://algotrading-investment.com/portfolio-item/remote-trade-copier-mt4-mt4/
Beside, we have an excellent trading system too.
https://www.mql5.com/en/users/financeengineer/seller#products

Young Ho Seo

Why Remote Trade Copier from Algotrading-Invesment.com
Well, we have been already explained about this a lot to many customers. There are two types of remote trade copier.
Category 1: Remote Trade Copier using seller’s server as an intermediating communication. This remote trade copier sender basically does upload some data into website and the receiver download some data to your client computer. But once seller’s server is stop. Everything will stop. 95% of time, you will meet this remote trade copier on the net. This is really cheap technology but unfortunately, this remote trade copier is not sold at cheap price on the net.
Category 2: Remote trade copier does not depend on seller’s server. This type of remote trade copier is more advanced version because sender is sending the signal directly to receiver without any intermediating communication. Whether seller’s serve is stop or not, you can run this remote trade copier for ever as long as you have your vps running. This advanced one is also faster than the first one since this one use similar sort of technology used in FIX protocol or other broker client API interface.
Our remote trade copier is the 2nd advanced Remote Trade Copier (category 2) working independently from seller. We have already warned many times to many customers about this. Now the seller use to sell the remote trade copier is gone out of the business, what now? Well, your remote trade copier stop works as simple as that.
I feel pain because my prediction was right when I mentioned this to several customers in the past. But if you bought their products, then you would probably feel even more pain because you can not use their remote trade copier any more. Feel sorry for that. However, as a average trader, you can not expect to know every single details about the remote copying technology. But you could at least listen to some good advice around.
If you need a advanced remote trade copier (category 2), please have a look ours. With this you can run your remote trade copier independently from seller. The signal will go from your vps to directly to your client or your other computer. The technology used inside this advanced remote trade copier is totally different to the products at category 1.
Here is the link to our advanced remote trade copier:
http://algotrading-investment.com/portfolio-item/remote-trade-copier-mt4-mt4/

Young Ho Seo

Pattern Completion Interval and Basic Order Management for harmonic Pattern Trading
Pattern Completion Interval is the concept, first introduced in the Book (Practical Guide to Precision Harmonic Pattern Trading), to help you to trade with harmonic pattern in more scientific way. Especially, it helps you to achieve the desired Reward/Risk ratio while you are trading in real time tick by tick data. Here is one of many approaches how you may use the Pattern Completion Interval concept for your trading. Of course, this approach is compatible with your Harmonic Pattern Plus and Harmonic Pattern Scenario Planner. We produce this diagram so you can understand this approach intuitively without any calculator in your hands. Tr = Take Profit Ratio and Sr = Stop Loss Ratio. The diagram shows the case of two orders but you can even generate more orders taking this example further. Hopefully this new diagram is easier to understand than previous one.
Of course, this precision trading frame work is applicable to Harmonic Pattern Plus and Harmonic Pattern Scenario Planner.
http://algotrading-investment.com/portfolio-item/harmonic-pattern-plus/
https://www.mql5.com/en/market/product/4488
https://www.mql5.com/en/market/product/4475

Young Ho Seo
EURUSD Market Outlook 13 Feb 2018
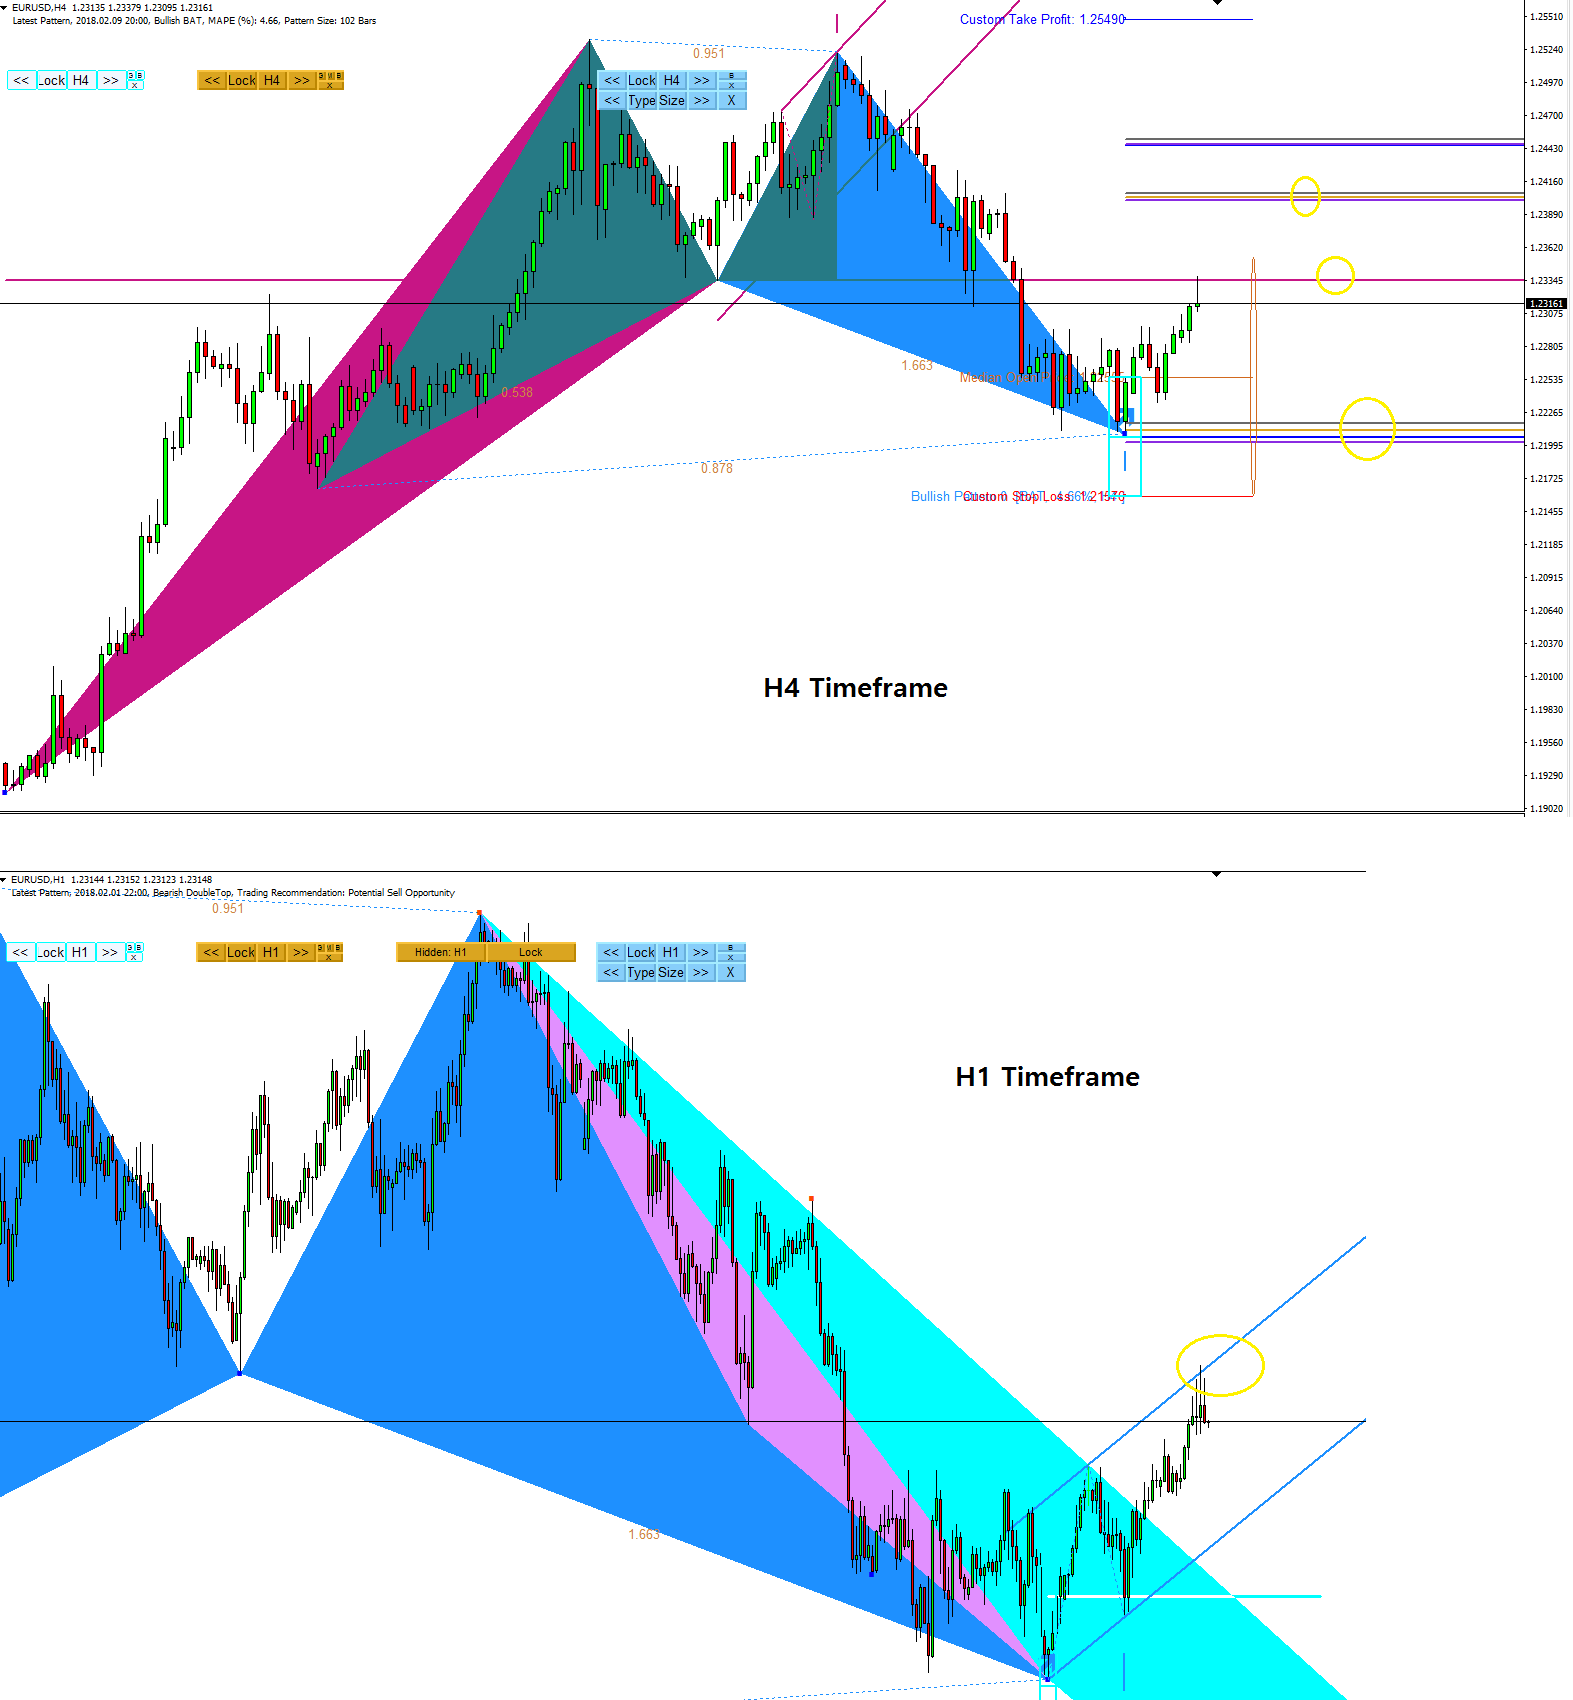
To get more accuarte prediction for EURUSD, here is the multiple timeframe pattern analysis in H4 and H1 timeframe. Firstly EURUSD showed a bullish movment after the formation of BAT pattern (Harmonic Pattern Plus). Currently it is up by around 120 pips. As you can see from the screenshot, the double top neck line was tested and EURUSD just made a reversal for now (Price Breakout Pattern scanenr). Now, we can clearly see why on H1 timeframe. In fact the reversal was made arond the top line of upwards EFW channel. Now we recommend to watch out the price reaction around the EFW channel on European and USA session for your traidng.
http://algotrading-investment.com/
https://www.mql5.com/en/users/financeengineer/seller#products

Young Ho Seo

New ebook Winning Financial Trading with Equilibrium Fractal Wave released
Title: Winning Financial Trading with Equilibrium Fractal Wave
Subtitle: Short Introduction to Equilibrium fractal wave trading
About the book
This book will introduce you the brand new concept called “Equilibrium fractal wave” for the financial trading. This powerful concept can guide and improve your practical trading. This book can also help the strategist to create new trading strategies for Stock and Forex market. This book was written to introduce the main book: Financial Trading with Five Regularities of Nature: Scientific Guide to Price Action and Pattern Trading (2017). Therefore, please read this short book first before Reading the main book: Financial Trading with Five Regularities of Nature: Scientific Guide to Price Action and Pattern Trading (2017).
http://algotrading-investment.com/2018/02/12/winning-financial-trading-equilibrium-fractal-wave/
https://www.mql5.com/en/users/financeengineer/accounting

Young Ho Seo
EURUSD Market Outlook 2-12 Feb 2018
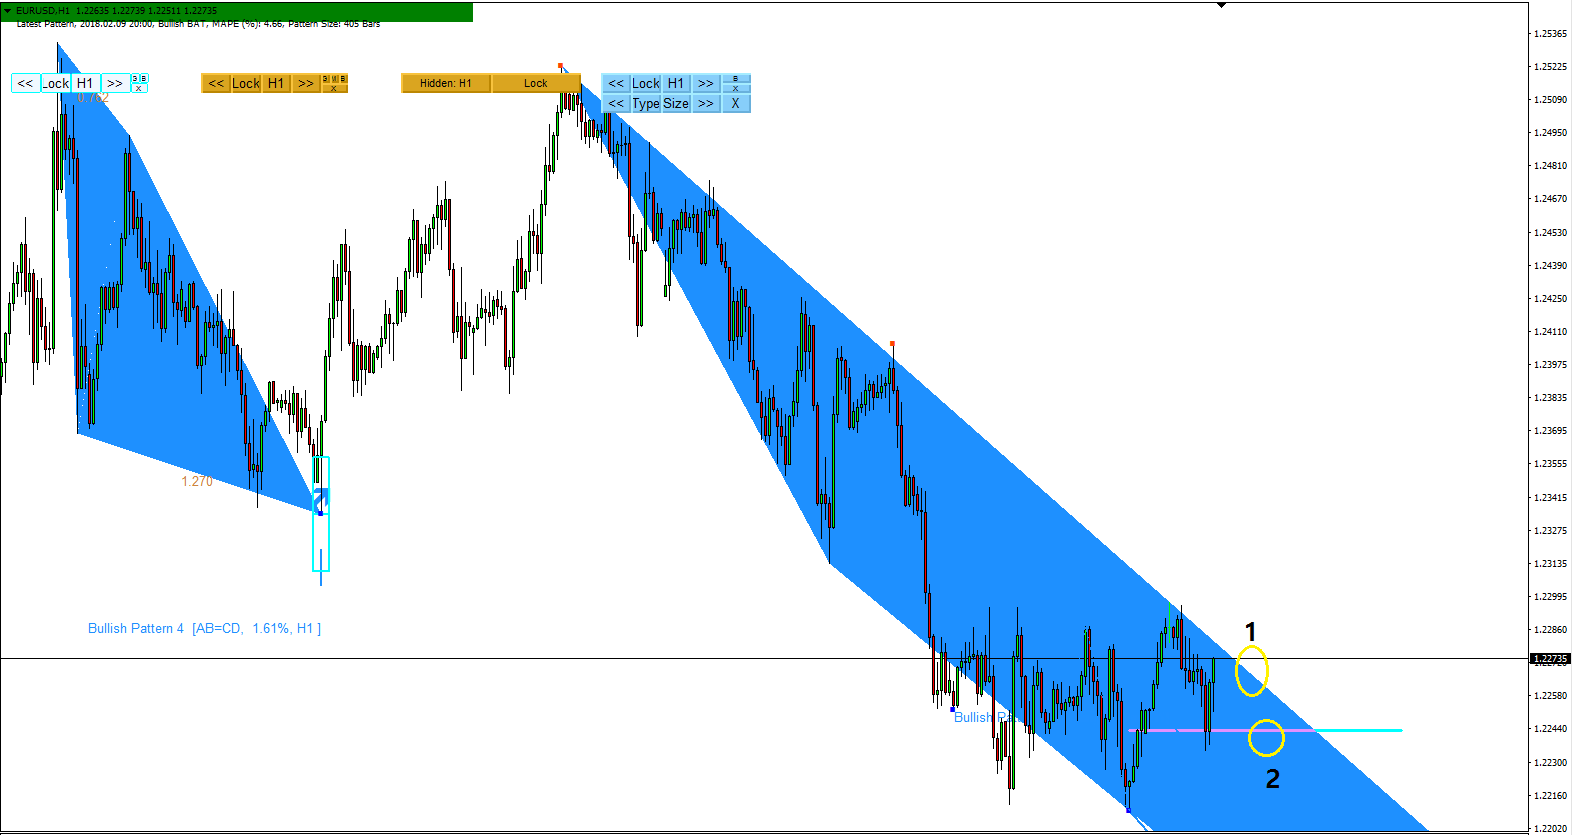
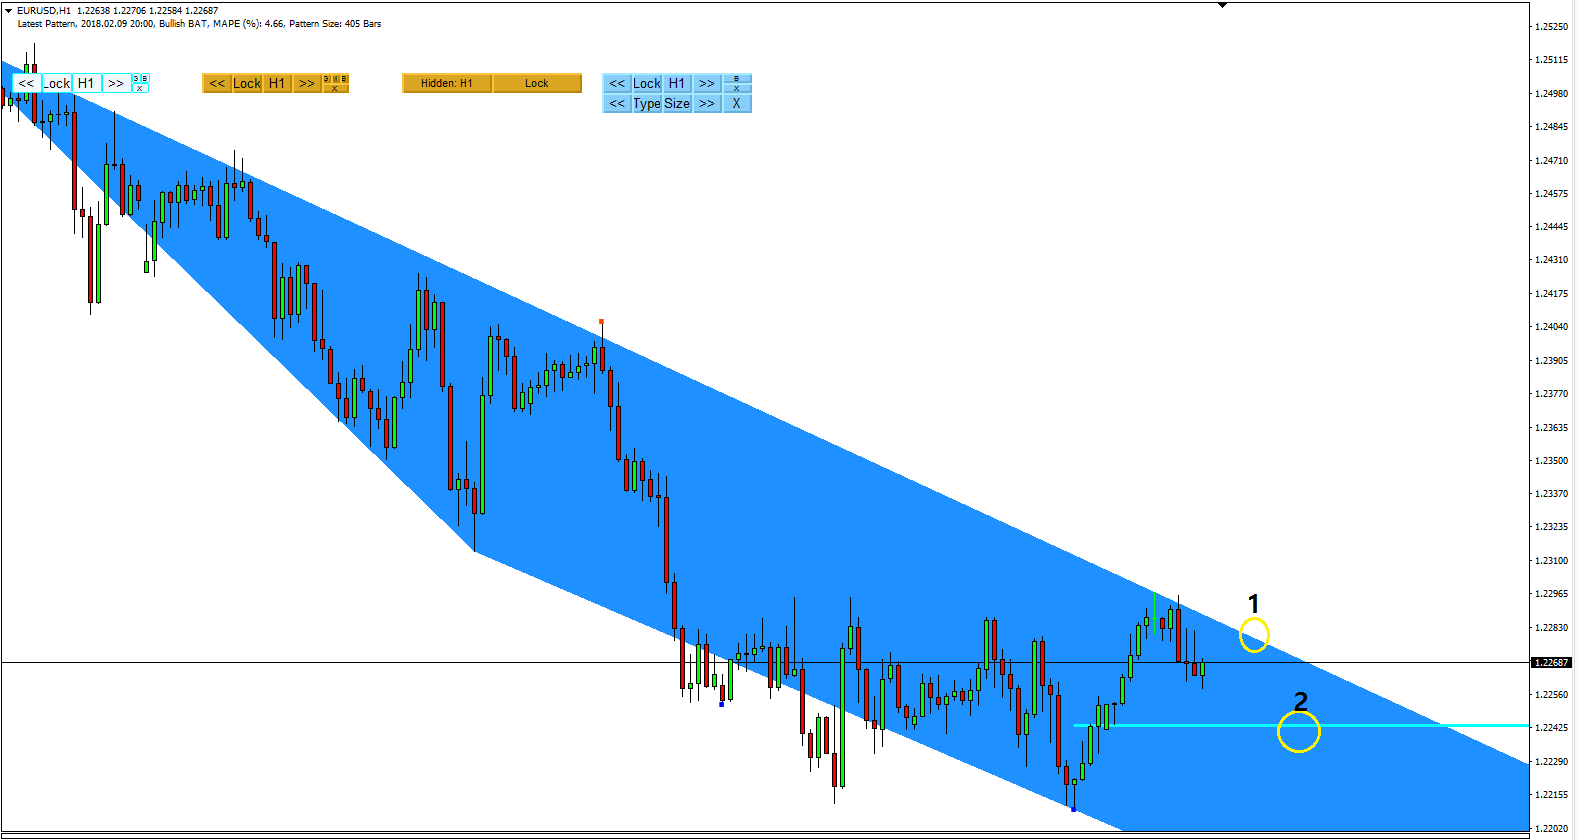
We have marked two level to watch out for your trading in our previous post. Indeed, EURUSD made a beautiful turn at level 2 in the middle of wedge pattern detected by Price Breakout Pattern scanner. Hope this was helpful for your trading.
You can visit our website for powerful trading system and strategies:
http://algotrading-investment.com/
https://www.mql5.com/en/users/financeengineer/seller#products

Young Ho Seo
EURUSD Market Outlook-12 Feb 2018
Here is short term analysis for EURUSD. Currenlty we have a wedge pattern formed at sensible place (H1, Price Breakout Pattern Scanner). The top of the wedge is acting as resistance at the moment. I have marked two levels for your to watch out for your trading for short term. Make sure that you press Lock button to lock the wedge pattern for your trading.
http://algotrading-investment.com/
https://www.mql5.com/en/users/financeengineer/seller#products

Young Ho Seo
Education section added to Trading Invest Smart Lounge
We have added an education section in our Trading Invest Smart Lounge. Knowledge and discipline are the two keys for your successful trading. Use these unique and powerful knowledge from our website for your successful trading.
http://tradeinvestsmart.com
http://algotrading-investment.com/
https://www.mql5.com/en/users/financeengineer/seller#products

Young Ho Seo
USDJPY Market Outlook-11 Feb 2018
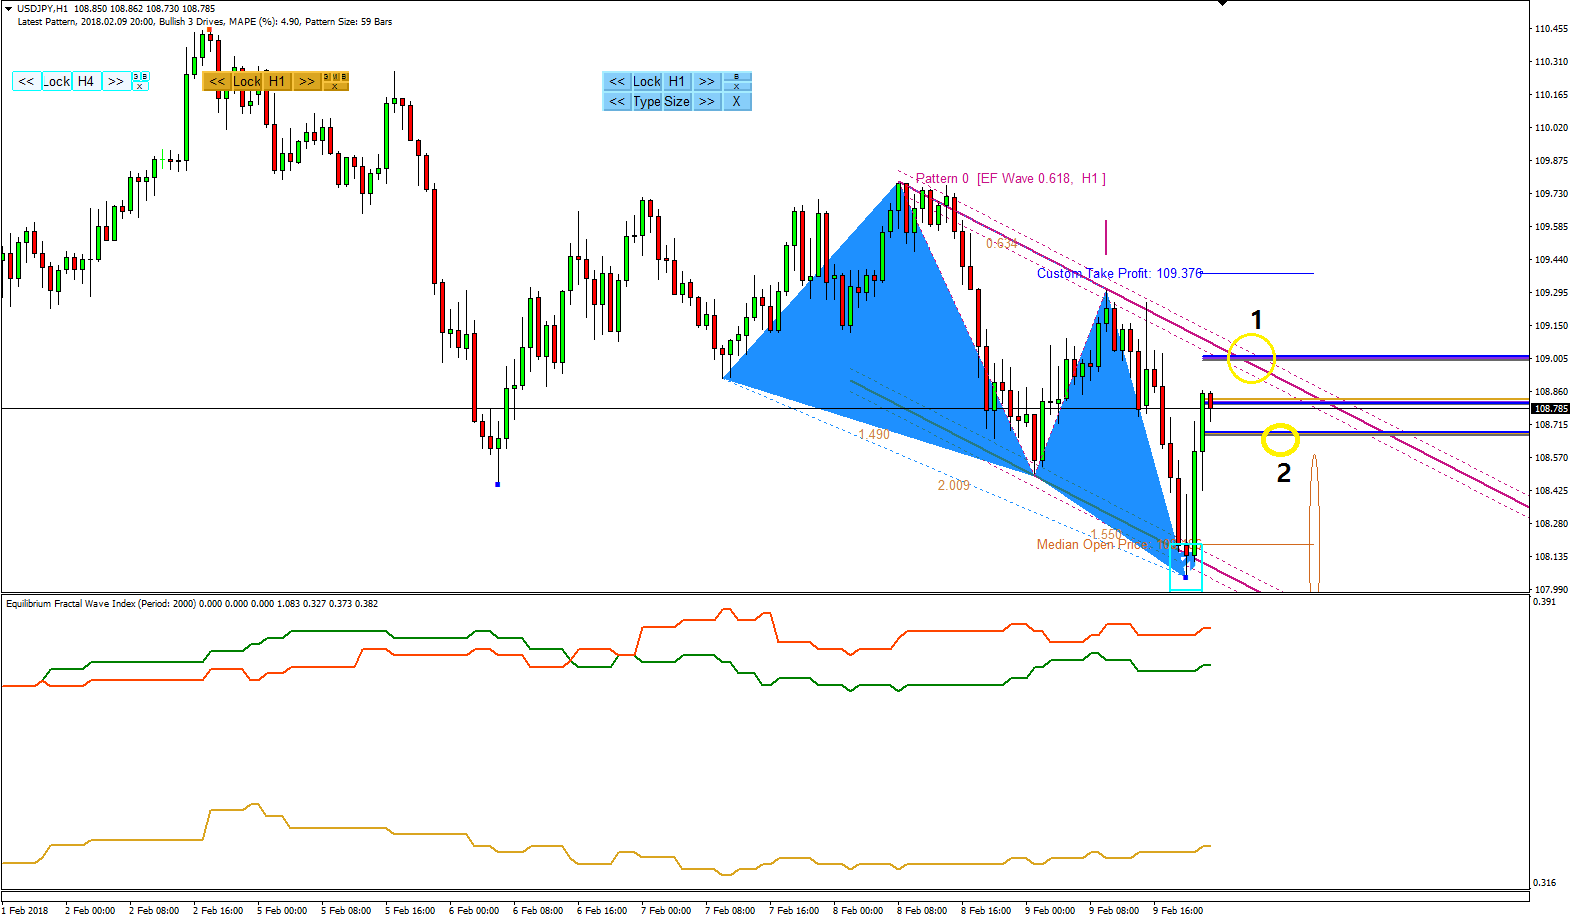
Last Friday, USDJPY had a formation of 3 Drives patterns just couple of hours before the market close. USDJPY reacted bullish on the pattern and it went up around 80 pips. We have outlined three PRZ Type B lines for potential resistance for your trading. Currenlty USDJPY is just above the second PRZ Type B lines. On the market open, we need to watch out marked level 1 and marked level 2 in the screenshots.
http://www.algotrading-investment.com/
https://www.mql5.com/en/users/financeengineer/seller#products

Young Ho Seo

New Article "Understanding Hurst Exponent and Equilibrium Fractal Wave Index for Financial Trading" Released
We have releaesd New Article "Understanding Hurst Exponent and Equilibrium Fractal Wave Index for Financial Trading" Released. In this article, we explain how to best use Hurst exponent (Fractal Dimension index) and Equilibrium fractal wave index for your fianancial trading. We share the practical trading tips using this two powerful tools for your benefits.
You can read the same articles from several location. Here are the links for the articles:
http://algotrading-investment.com/2018/02/11/understanding-hurst-exponent-equilibrium-fractal-wave-index-financial-trading/
https://algotradinginvestment.wordpress.com/2018/02/11/understanding-hurst-exponent-and-equilibrium-fractal-wave-index-for-financial-trading/

: