Comfortable MACD
- インディケータ
-
Anton Iudakov
 Trader.
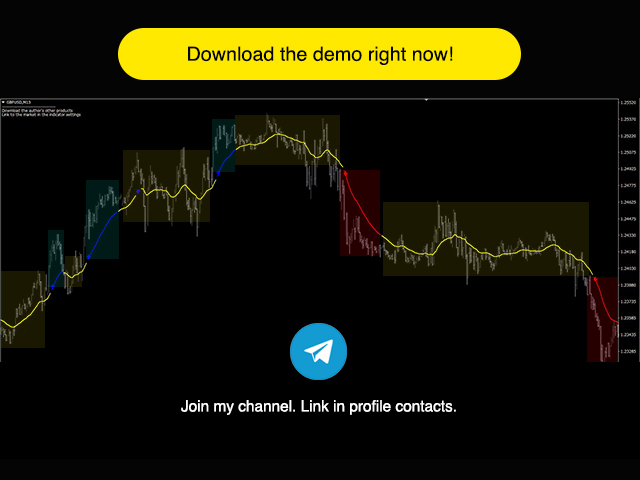
I write strategies, indicators and robots. Subscribe to my telegram channel, where we discuss intraday trading, the link in the profile contacts.
-------------------------------------------------- --------------------------------------
Most of my products are free. Download them now! - バージョン: 1.0
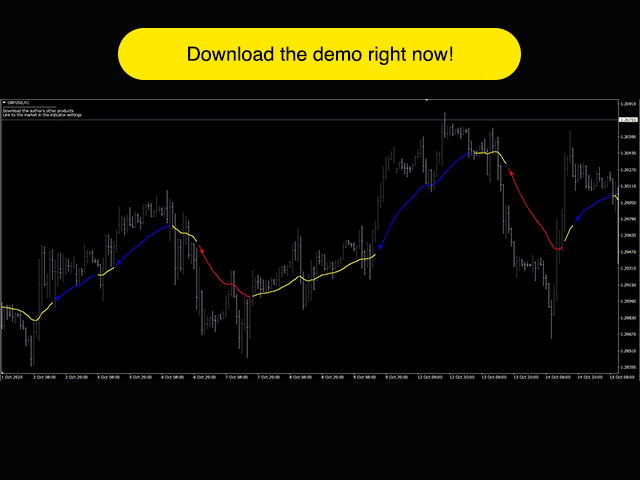
Trading with the help of the MACD indicator has become even more convenient. Flexible settings will help you choose what you really need in your trading. Use the strategy that you need - the indicator uses 3 strategies. Download the demo right now!
I recommend watching my advisor - Night Zen EA
Subscribe to my telegram channel, link in my profile contacts - my profile
See also my other products on mql5.com - my products
Advantages of the indicator:
- In this indicator, the interpretation of the MACD is displayed on the chart itself using the fast EMA line, the calculation of which is embedded in the MACD indicator.
- You can use one of 3 strategies.
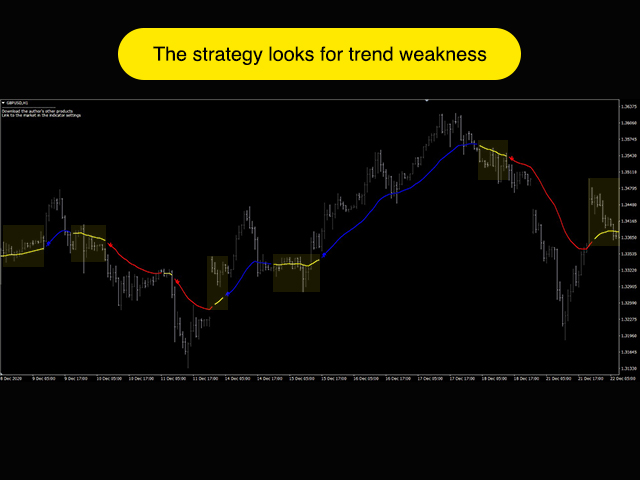
- You can now focus not only on the MACD signals for the chosen strategy, but also on the location of the price relative to the fast EMA line, on the direction and slope of the fast EMA line.
- Signals do not redraw their values - if an arrow appears, it will remain on the chart.
- Receive alerts about the appearance of signals in your terminal on your PC, mobile terminal and mail.
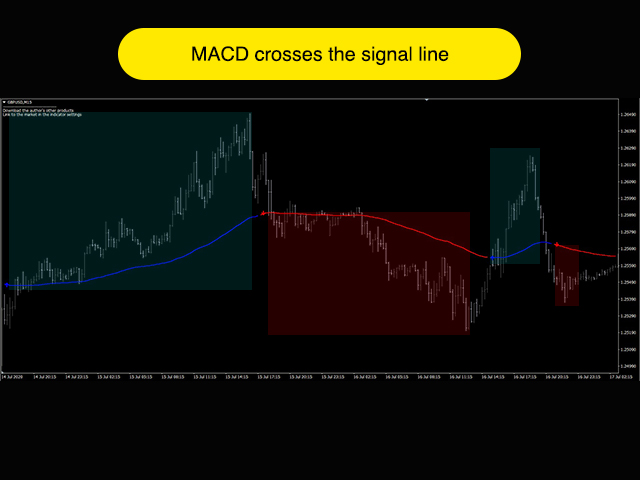
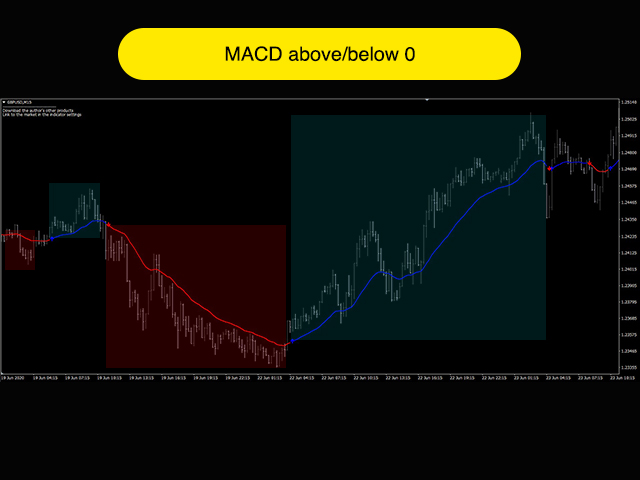
Strategies in this indicator:
- The MACD line crosses the signal line
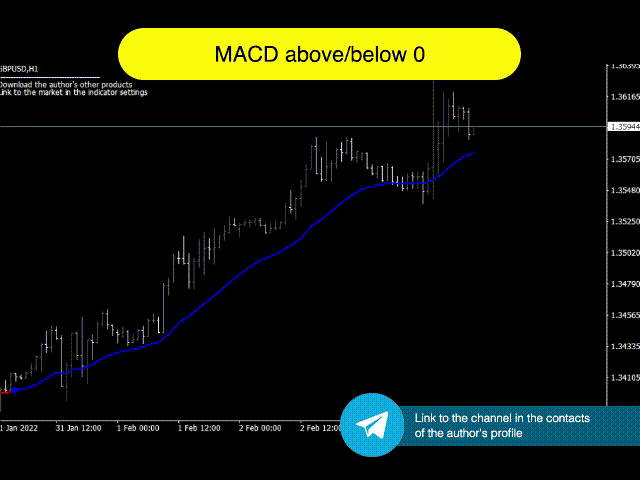
- The MACD line crosses level 0
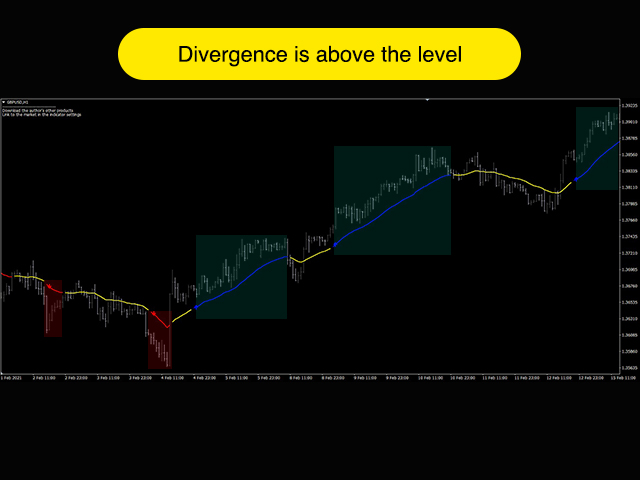
- The divergence of the fast and slow EMA lines above the set level (the level is set in the indicator settings in points)
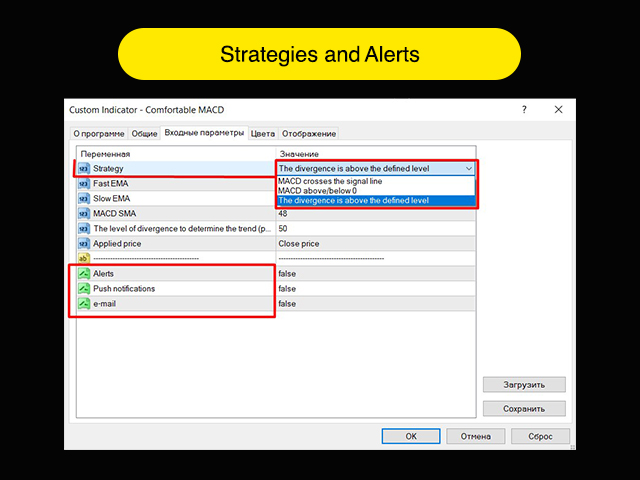
Indicator Settings:
- Strategy - Choosing a strategy
- Fast EMA - Fast EMA Period
- Slow EMA - The period of slow EMA
- MACD SMA - The period of simple averaging of the divergence values
- The level of divergence to determine the trend (points) - The maximum level of divergence of the fast and slow EMA lines to determine the strength of the trend.
- Applied price - The applied price in the calculation of the MACD indicator
- Alerts - Notification functions to the terminal, mobile terminal and mail.
Customize this indicator for yourself and make successful trades on the market! I wish you a successful trade!
Download the demo!


Es muy bueno, fácil de comprender, he puesto el mismo con diferentes parámetros y me van excelentes. Gracias.