Advance 123 Pattern Scanner

4

  • Contact me after payment to send you the User-Manual PDF File.

How To Test
  • You can test the indicator by free version, to get the free version please contact me the free version scans charts in W1 and MN1 time-frames) it's free.


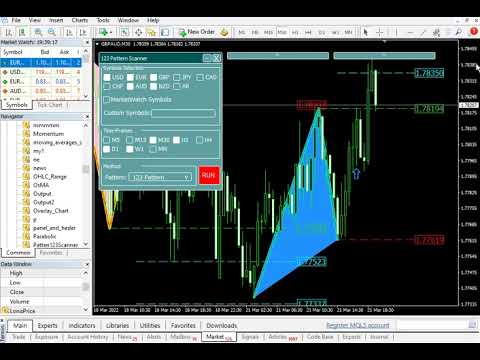
123 Pattern Breakout

Trend is your friend, trade along the trend, but how do we identify trends?

Sometimes the simplest methods have the best results.

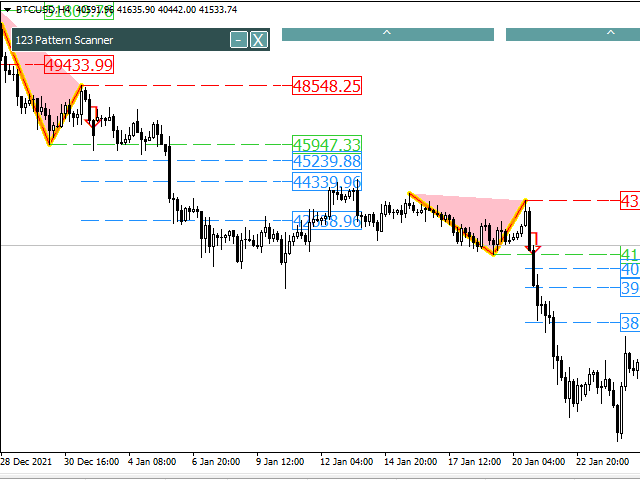
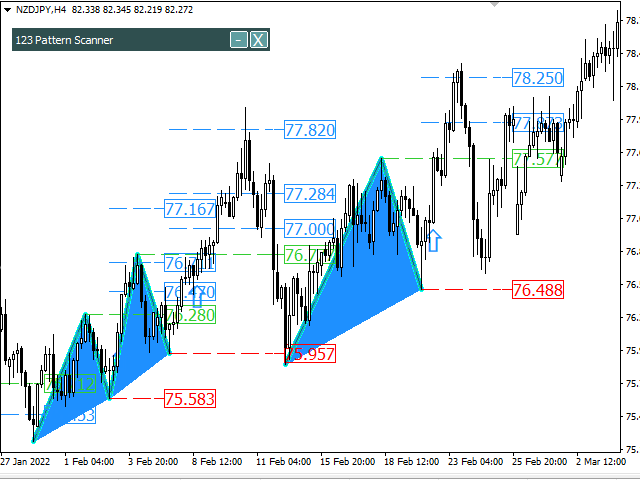
Pattern 123 is based on the breakout important price levels, when the price is trying to break the previous high or low in the chart, by checking the Fibonacci levels, and recognized pattern 123, can take a position based on it.

Strategy Concept

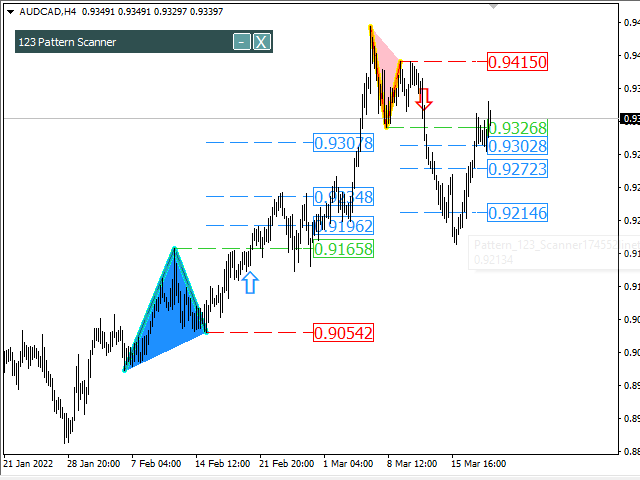
The strategy begins by identifying three main points. For example, in an uptrend, when the market hits a new high, label that point as 1. We then wait for the price to pull back to a short-term support area. This point is labeled as 2. Finally, when the price moves up to an area between points 2 and 3, we label this as point number 3. We then take an entry at a suitable location, which we will address in the later part of the strategy.

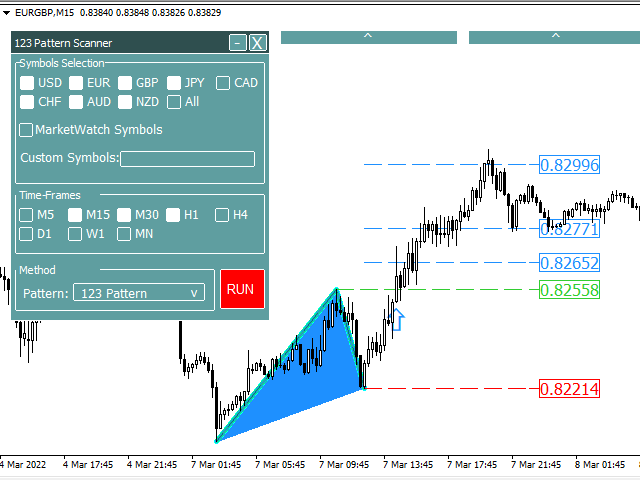
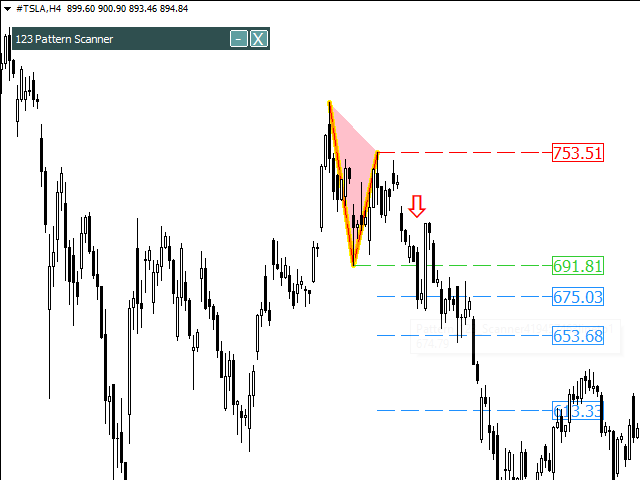
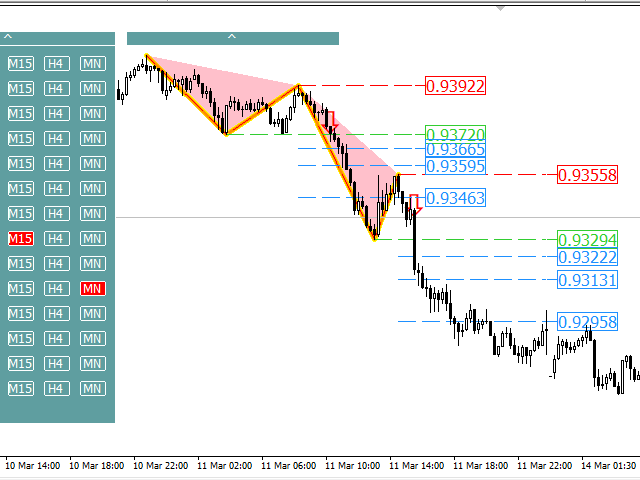
The pattern is complete when the price stays below point 2. The strategy is to sell the currency pair on the break of point 2. The take-profit of the strategy is placed at a point that results in a 1:2 risk-to-reward ratio. The stop loss is put just above point 3, whereas a more conservative stop loss is placed just above the move, in order to maximize the risk to reward. The trader will be able to make this choice by trading the pattern again and again. Let us understand the step-by-step process of the strategy.

Indicator features

  • No repaint.
  • High Win-Rate 
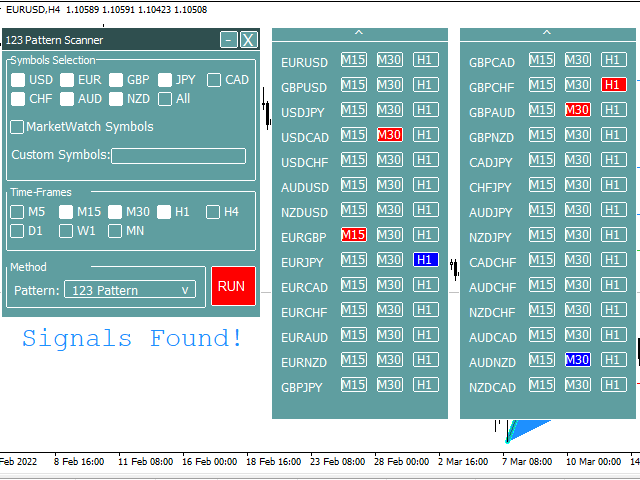
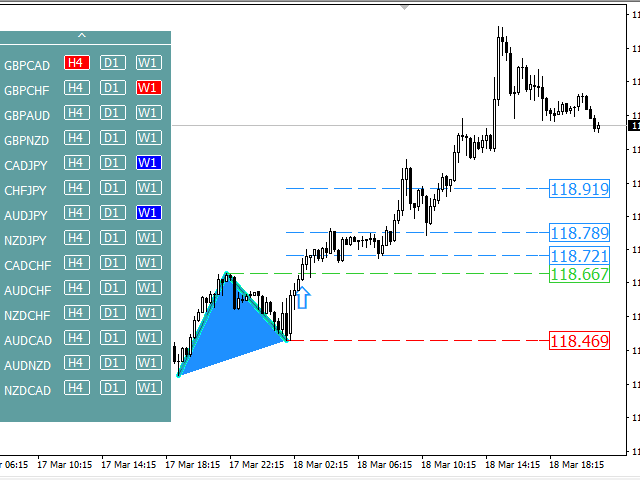
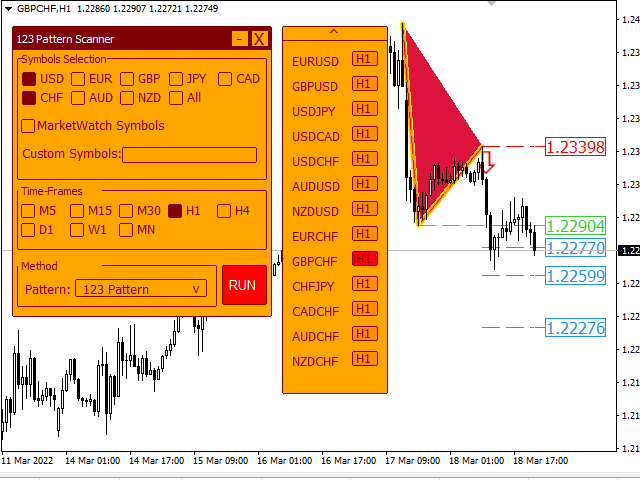
  • With a golden dashboard. Select your favorite symbols and timeframes with just a few clicks.
  • Special user interface, easy to use.
  • Full simultaneous scan of up to 1600 symbols-timeframes.
  • High speed compared to similar products in the market (using optimal search algorithms)
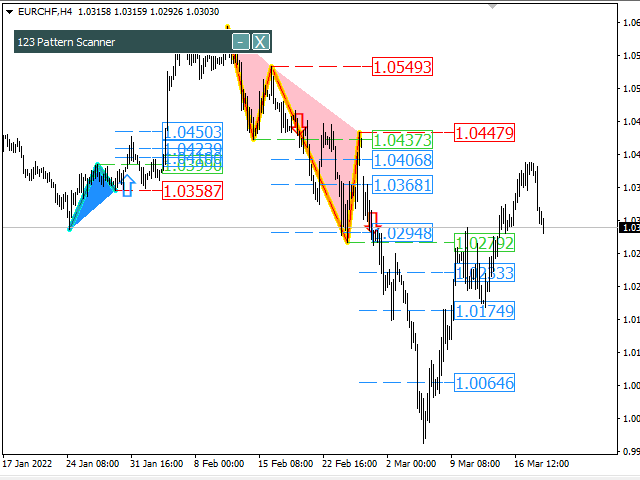
  • Drawing ordering guide lines.
  • Send alerts and notifications if pattern is detected.
  • Ability to customize the user interface

Indicator parameters:

  •  Pivots Search Settings

  Use Depth, Deviation, Steps to set zigzag setting search.

  • Auto scan

 If you are using VPS, you can set it “ON” for scan and get a notification in periods that you want

  • Maximum Symbols

Maximus number of symbols that you can scan on time. Use when you have already selected checkbox “MarketWatch Symbols”.

Features that will be added in the future versions:

  • Divergence filter when forming a pattern.
  • Add a few other popular patterns


レビュー 16
Giulio Franceschini
692
Giulio Franceschini 2025.03.17 12:38 
 

It is the best and most complete indicator for the 123 pattern, fast without hitches, also allows you an option to anticipate the formation of the pattern and therefore to exploit the potential of the pattern in advance, but it is only to satisfy expert traders, because it has a certain amount of risk, however the option is there.

It would be a stratospheric indicator if a panel with the statistics of winning and losing referred to the first target were added, clearly you can't expect the moon the price is already very competitive.

PipMonster491
26
PipMonster491 2023.05.21 06:11 
 

This indicator is the best, extremely helpful. Customer service is top notch. Thanks Mihails Babuskins.

KGreene
174
KGreene 2023.04.10 15:27 
 

Awesome Indicator. Provides more accurate results than many other indicators on the market. Superb.

おすすめのプロダクト
The indicator allows you to trade binary options. The recommended time frame is М1 and the expiration time is 1,2,3 minutes. The indicator suitable for auto and manual trading. A possible signal is specified as a arrows above/under a candle. You should wait until the candle closes! Arrows are not re-painted Trade sessions: TOKYO section (Half-end) Currency pairs: USD/JPY Working time frame: M1 Expiration time: 1,2,3 minutes. The indicator also shows good results when using the martingale strateg
FREE
これは、キャンドルの終値を予測する指標です。 このインジケータは、主にD1チャートでの使用を目的としていますが. この指標は、従来の外国為替取引とバイナリオプション取引の両方に適しています。 インジケーターは、スタンドアロンのトレーディングシステムとして使用することも、既存のトレーディングシステムへの追加として機能させることもできます。 このインジケーターは、現在のキャンドルを分析し、キャンドル自体の内部の特定の強度係数と、前のキャンドルのパラメーターを計算します。 したがって、この指標は、市場の動きのさらなる方向性と現在のキャンドルの終値を予測します。 この方法のおかげで、この指標は、短期の日中取引だけでなく、中期および長期の取引にも適しています。 インジケーターを使用すると、市場の状況の分析中にインジケーターが生成する潜在的な信号の数を設定できます。 インジケーターの設定には、このための特別なパラメーターがあります。 また、インジケーターは、チャート上のメッセージの形式で、電子メールで、およびPUSH通知の形式で、新しい信号について通知することができます。 購入後は必ず私に書いて
EARLY REMINDER: The Starting price is 65 price will rise soon up to 365$ and then 750$ after first 10 copies of sales. Grab this offer now! Introduction Hello, traders! Welcome to the demonstration of the Forex Beast Indicator , a comprehensive tool designed to assist aspiring traders in navigating the complexities of the forex market. This indicator incorporates seven essential components to provide a well-rounded trading experience: Moving Averages Colored Zones Support and Resistance Levels
「ダイナミック・スキャルピング・オシレーター」は、MT4向けの高度なカスタムCrypto_Forexインジケーターです。効率的な取引ツールです! - 新世代のオシレーター - 使い方は画像をご覧ください。 - ダイナミック・スキャルピング・オシレーターは、適応型の売られ過ぎ/買われ過ぎゾーンを備えています。 - オシレーターは、動的な売られ過ぎ/買われ過ぎエリアから正確なエントリーポイントを見つけるための補助ツールです。 - 売られ過ぎ値:グリーンラインより下、買われ過ぎ値:オレンジラインより上。 - このインジケーターは、プライスアクションパターンと組み合わせるのに最適です。 - 標準的なオシレーターよりもはるかに正確です。対応時間枠:M30、H1、H4、D1、W1。 - PCとモバイルの両方でアラート機能付き。 高品質のトレーディングロボットとインジケーターをご覧になるにはここをクリックしてください! これは、このMQL5ウェブサイトでのみ提供されるオリジナル製品です。
SMC Venom Model BPR インジケーターは、スマート マネー (SMC) コンセプトで取引するトレーダー向けのプロフェッショナル ツールです。価格チャート上の 2 つの主要なパターンを自動的に識別します。 FVG   (フェアバリューギャップ) は、3 本のローソク足の組み合わせで、最初のローソク足と 3 番目のローソク足の間にギャップがあります。ボリュームサポートのないレベル間のゾーンを形成し、価格修正につながることがよくあります。 BPR   (バランス価格範囲) は、2 つの FVG パターンの組み合わせで、「ブリッジ」を形成します。これは、価格がボリュームアクティビティの少ない動きで動くときに、ブレイクアウトしてレベルに戻るゾーンで、ローソク足の間にギャップを作成します。 これらのパターンは、大規模な市場プレーヤーと一般参加者の相互作用が発生するチャート上のボリュームと価格動向の分析に基づいて、トレーダーが主要なサポート/レジスタンス レベル、ブレイクアウト ゾーン、エントリ ポイントを識別するのに役立ちます。 インジケーターは、長方形と矢印の形でパターンを視
Forex Gump
Andrey Kozak
2.4 (5)
Forex Gump is a fully finished semi-automatic trading system. In the form of arrows, signals are displayed on the screen for opening and closing deals. All you need is to follow the instructions of the indicator. When the indicator shows a blue arrow, you need to open a buy order. When the indicator shows a red arrow, you need to open a sell order. Close orders when the indicator draws a yellow cross. In order to get the most effective result, we recommend using the timeframes H1, H4, D1. There
Exit EDGE EA
Nguyen Tran Ha
3 (1)
Exit EDGE EA  is developed base on the PipFinite   Exit EDGE   Indicator, one of the best indicator on the market so far.  This EA open buy/sell orders when the indicator has Exit Sell/Buy Strong signals. You can read more information about PipFinite   Reversal PRO  indicator  here . Important Information   This EA will only work if you purchased  PipFinte Exit EDGE  indicator. To use or test EA must set the   "Use Exit EDGE   Indicator    "   parameter to   TRUE . It works with all symbols. T
The Riko Trend indicator is a revolutionary trend trading and filtering solution with all the important features of a trend tool built into one tool! The Riko Trend indicator is good for any trader, suitable for any trader for both forex and binary options. You don’t need to configure anything, everything is perfected by time and experience, it works great during a flat and in a trend. The Riko Trend indicator is a technical analysis tool for financial markets that reflects the current price f
Antabod Gamechanger
Rev Anthony Olusegun Aboderin
*Antabod GameChanger Indicator – Transform Your Trading!*   Are you tired of chasing trends too late or second-guessing your trades? The *Antabod GameChanger Indicator* is here to *revolutionize your trading strategy* and give you the edge you need in the markets!   Why Choose GameChanger? *Accurate Trend Detection* – GameChanger identifies trend reversals with *pinpoint accuracy*, ensuring you enter and exit trades at the optimal time.   *Clear Buy & Sell Signals* – No more guesswork! T
This is a trend indicator without redrawing Developed instead of the binary options strategy (by the color of the Martingale candlestick) Also works well in forex trading When to open trades (binary options) A signal will appear in the place with a candle signaling the current candle It is recommended to open a deal for one candle of the current timeframe M1 and M5 When a blue dot appears, open a deal up When a red dot appears, open a trade down. How to open trades on Forex. When a signal is rec
トレンドトレーディング は、タイミングのプルバックとブレイクアウトにより、市場で起こっているトレンドから可能な限り利益を得るように設計された指標です。確立されたトレンドの中で価格が何をしているかを分析することにより、取引の機会を見つけます。 [ インストールガイド | 更新ガイド | トラブルシューティング | よくある質問 | すべての製品 ] 自信を持って効率的に金融市場を取引する むち打ちにならずに確立されたトレンドから利益を得る 収益性の高いプルバック、ブレイクアウト、早期の逆転を認識する この指標は、独自の品質とパフォーマンスを分析します 複数時間枠のダッシュボードを実装します インジケーターは再描画されていません 電子メール/音声/視覚アラートを実装します 確立されたトレンドは多くの取引機会を提供しますが、ほとんどのトレンド指標はそれらを完全に無視しています。インジケーターの解釈はかなり簡単です: (1) トレンドの変化 (2) トレンドの方向への後退 (3) トレンドの方向へのブレイクアウト 赤いダッシュ は下降トレンド中の修正です 青いダッシュ は上昇トレンド中
This unique multi-currency strategy simultaneously determines the strength of trends and market entry points, visualizing this using histograms on the chart. The indicator is optimally adapted for trading on the timeframes М5, М15, М30, Н1. For the convenience of users, the indicator renders the entry point (in the form of an arrow), recommended take profit levels (TP1, TP2 with text labels) and the recommended Stop Loss level. The take profit levels (TP1, TP2) are automatically calculated for
sinus wave strong buy sell indicator is nonrepaint top bottom point indicator.it work all pairs and all timeframe.suitable for beginners and experienced traders. it depend to sinus wave and vertex base .gives signal sinus wave over zero or below zero on approppirate vertex positions. cnt number has been set to 500 bars for demo mode. it can be increase to 2000 depend to charts has bar numbers. minimum value is 500.  white points on red vertex spikes means sell. white points on blue vertex spikes
Trend PRO Expert Advisor  is developed base on the PipFinite Trend PRO Indicator, the best indicators on the market so far. PipFinite  Trend Pro's smart algorithm detects the trend, filters out market noise and gives entry signals with exit levels.  This EA open order when the indicator has buy/sell signals and set SL/TP follow the indicator rules. You can read more information about PipFinite Trend PRO indicator  here . Important Information   This EA will only work if you purchased  PipFinte
The Th3Eng PipFinite indicator is based on a very excellent analysis of the right trend direction with perfect custom algorithms. It show the true direction and the best point to start trading. With StopLoss point and Three Take Profit points. Also it show the right pivot of the price and small points to order to replace the dynamic support and resistance channel, Which surrounds the price. And Finally it draws a very helpful Box on the left side on the chart includes (take profits and Stop loss
SX Supply Demand Zones accurately identifies and draws high-probability Supply and Demand zones using a sophisticated algorithm. Unlike traditional indicators that clutter your chart, this indicator is designed with a focus on performance and a clean user experience. New Unique Feature: Interactive Legend System What truly sets this indicator apart from everything else is the Interactive Control Legend. You have a professional dashboard directly on your chart that allows you to: Show/Hide: Ins
FREE
Fisher Yur4ik MT4は、テクニカル分析の力を活用して、トレーダーに市場のトレンドに関する正確な洞察を提供する高度なトレーディングインジケーターです。MetaTrader 4専用に設計されたこのインジケーターは、意思決定プロセスを強化し、トレーディング結果を改善したいトレーダーに最適です。 Fisher Yur4ik MT4を利用することで、トレーダーはリアルタイムのアラートと明確な視覚信号を得て、さまざまな金融市場で利益を上げるトレーディング機会を捉えることができます。 MQL製品のインストールガイド | MT4/MT5で購入したMQL製品の更新 | 一般的なトラブルシューティングガイド | インジケーター設定 / ガイド 主な特徴 バッファ統合: インジケーターの値をアクセス可能なバッファとして公開し、Expert Advisorが信号ベースのトレーディング戦略を利用できるようにします。 迅速かつバックテスト可能: MetaTraderのネイティブOnCalculate()エンジンに基づいて構築されており、迅速な計算とストラテジーテスターとの完全な互換性を提供します。
Lord Auto Fibonnaci is a free indicator for Meta Trader, in order to show the most famous chart in the financial market known as "Fibonnaci". As we can see in the images below, the fibonnaci table will automatically analyze the graph for you, with trend factors through percentage, almost infallible use, you can always work when the percentage is low or high, start shopping and sales on time, great for analyzing entries! In the images below we can see an example in gold in H4, where we are at
FREE
Super Reversal Pattern Indicator Unlock the power of advanced pattern recognition with our Super Reversal Pattern Indicator. Designed for traders seeking precision and reliability, this indicator identifies one of the most effective reversal patterns in technical analysis, offering a significant edge in your trading strategy. Key Features: Non-Repainting Accuracy: Enjoy the confidence of non-repainting technology. Once a Super Reversal Pattern is detected, it remains static, providing consiste
[ZhiBiCCI]インディケータは全てのサイクル使用に適しており、そして全ての市場品種にも適しています。 [ZhiBiCCI]緑色の実線は強気の発散の逆転です。緑色の点線は古典的な強気の発散です。 [ZhiBiCCI]赤への実線は逆弱気の発散である。赤い点線は古典的な弱気の発散です。 [ZhiBiCCI]はパラメータ(アラート、メール送信、通知送信)で設定でき、(true)に設定するとインスタント信号をアラームウィンドウに送信し、Eメール、インスタントメッセージを送信できます。 パラメータ設定の説明 [displayAlert]:これはアラームスイッチで、trueに設定され、矢印が表示されればプロンプトに自動的に警告され、falseに設定されれば警告されません。 [sendmail_NO_OFF]:これはメールを送信するためのスイッチで、trueに設定します。矢印が表示されていればMT4で設定したメールボックスにメールを送信し、falseに設定されていればメールを送信しません。 [sendnotification_NO_OFF]:これはインスタントメッセージを送信するた
Trend Bilio - an arrow indicator without redrawing shows potential market entry points in the form of arrows of the corresponding color: upward red arrows suggest opening a buy, green down arrows - selling. The entrance is supposed to be at the next bar after the pointer. The arrow indicator Trend Bilio visually "unloads" the price chart and saves time for analysis: no signal - no deal, if an opposite signal appears, then the current deal should be closed. It is Trend Bilio that is considered
VR Cub
Vladimir Pastushak
VR Cub は、質の高いエントリーポイントを獲得するためのインジケーターです。このインジケーターは、数学的計算を容易にし、ポジションへのエントリーポイントの検索を簡素化するために開発されました。このインジケーターが作成されたトレーディング戦略は、長年にわたってその有効性が証明されてきました。取引戦略のシンプルさはその大きな利点であり、初心者のトレーダーでもうまく取引することができます。 VR Cub はポジション開始ポイントとテイクプロフィットとストップロスのターゲットレベルを計算し、効率と使いやすさを大幅に向上させます。取引の簡単なルールを理解するには、以下の戦略を使用した取引のスクリーンショットを見てください。 設定、設定ファイル、デモ版、説明書、問題解決方法は、以下から入手できます。 [ブログ] レビューを読んだり書いたりすることができます。 [リンク] のバージョン [MetaTrader 5] エントリーポイントの計算ルール ポジションをオープンする エントリーポイントを計算するには、VR Cub ツールを最後の高値から最後の安値までストレッチする必要があります。 最初
「Auto FIBO Pro」Crypto_Forex インジケーターは、取引の補助ツールとして最適です。 - インジケーターは、フィボナッチ レベルとローカル トレンド ライン (赤色) を自動的に計算してチャート上に配置します。 - フィボナッチ レベルは、価格が反転する可能性のある重要な領域を示します。 - 最も重要なレベルは、23.6%、38.2%、50%、61.8% です。 - リバーサル スキャルピングやゾーン グリッド取引に使用できます。 - Auto FIBO Pro インジケーターを使用して、現在のシステムを改善する機会も多数あります。 - Info Spread Swap Display があり、接続されている外国為替ペアの現在のスプレッドとスワップを表示します。 - ディスプレイには、アカウントの残高、エクイティ、マージンも表示されます。 - Info Spread Swap Display は、チャートのどのコーナーにも配置できます。 0 - 左上コーナー、1 - 右上、2 - 左下、3 - 右下。 高品質のトレーディングロボットとインジケーターをご覧にな
「ダイナミック・トレーディング・オシレーター」は、MT4向けの高度なカスタムCrypto_Forexインジケーターです。効率的なトレーディングツールです! - 新世代のオシレーター - 使い方は画像をご覧ください。 - ダイナミック・トレーディング・オシレーターは、適応型の売られ過ぎ/買われ過ぎゾーンを備えています。 - オシレーターは、動的な売られ過ぎ/買われ過ぎエリアから正確なエントリーポイントを見つけるための補助ツールです。 - 売られ過ぎ値:青線より下、買われ過ぎ値:赤線より上。 - このインジケーターは、プライスアクションパターンと組み合わせるのに最適です。 - 標準的なオシレーターよりもはるかに正確です。対応時間足:M30、H1、H4、D1、W1。 - PCとモバイルアラート機能付き。 高品質のトレーディングロボットとインジケーターをご覧になるにはここをクリックしてください! これは、このMQL5ウェブサイトでのみ提供されるオリジナル製品です。
Quantum Balance is a modern arrow indicator that identifies key price reversal points in the market with high accuracy. It is based on a combination of WPR (Williams %R) and RSI (Relative Strength Index), which allows you to identify overbought/oversold moments and enter trades at points of maximum potential. The indicator analyzes price dynamics and market conditions, generating signals only when several confirming factors coincide. This reduces the number of false signals and increases tradin
123パターン は、最も人気のある強力で柔軟なチャートパターンの1つです。このパターンは、3つの価格ポイントで構成されています。ボトム、ピークまたはバレー、および38.2%〜71.8%のフィボナッチリトレースメントです。パターンは、価格が最後のピークまたは谷、インディケーターが矢印をプロットし、アラートを上昇させ、取引を行うことができる瞬間を超えたときに有効と見なされます。 [ インストールガイド | 更新ガイド | トラブルシューティング | よくある質問 | すべての製品 ] クリアな取引シグナル カスタマイズ可能な色とサイズ パフォーマンス統計を実装します カスタマイズ可能なフィボナッチリトレースメントレベル 適切なストップロスおよび利益レベルを表示します インジケーターを使用して、継続パターンまたは反転パターンを見つけることができます 再描画および非再描画ではありません 電子メール/音声/視覚アラートを実装します 123パターン は、継続パターンまたは反転パターンとして現れます。物事を簡単にするために、このインジケーターを使用して、検索するパターンのタイプを選択できるため
MajorAlert - is a professional trading indicator for MetaTrader 4 that combines two distinct market analysis approaches into one powerful tool. By integrating a counter‑trend entry logic (upper block) with a trend‑following filter (lower block), the indicator generates high‑probability signals on the chart with clearly separated arrow colors. Key Features Fully self‑contained   – no external indicators required; all calculations are built‑in. Versatile inputs   – adjust all parameters to suit a
Phase Analytics Pro: Advanced Cyclic Market Analyzer Phase Analytics Pro is a sophisticated technical tool designed for traders who prioritize mathematical precision over lag-heavy traditional indicators. Based on the principles of digital signal processing, this indicator decomposes price action into phase and quadrature components to identify the dominant market cycle. How it works: The algorithm calculates the instantaneous phase of the market, allowing it to distinguish between trending and
Overview Harmonic Patterns MT4 is a technical analysis indicator designed for the MetaTrader 5 platform. It identifies and displays harmonic price patterns, such as Butterfly, Cypher, Crab, Bat, Shark, and Gartley, in both bullish and bearish directions. The indicator calculates key price levels, including entry, stop loss, and three take-profit levels, to assist traders in analyzing market movements. Visual elements and customizable alerts enhance usability on the chart. Features Detects six ha
This product is a part of  ON Trade Waves Patterns Harmonic Elliot Wolfe you can test free version on EURJPY from this link  Wolf Waves Indicator ウルフウェーブを発見しよう - あなたの究極の取引ツール! どんな時間軸でも簡単にウルフウェーブを見つけるための強力なツールを探していますか?もう探す必要はありません!私たちのウルフウェーブインジケーターは、その仕事を簡単にこなします。なぜこのインジケーターがあなたにぴったりか、以下でご紹介します。 主な特徴: 自動検出: ウルフウェーブインジケーターは、複雑なアルゴリズムを使用して、チャート上のキーポイントを自動的に見つけ、対応するラインを描画します。手動でパターンを探す手間が不要です。 使いやすさ: このインジケーターはシンプルなデザインで、経験豊富なトレーダーからウルフウェーブ初心者まで、誰でも簡単に利用できます。 高精度: 数多くのウルフウェーブインジケーターの中で、当社のものは完璧さの
このプロダクトを購入した人は以下も購入しています
Gann Made Easy は、ミスター・ギャンの理論を使用した取引の最良の原則に基づいた、プロフェッショナルで使いやすい外国為替取引システムです。 W・D・ガン。このインジケーターは、ストップロスとテイクプロフィットレベルを含む正確な買いと売りのシグナルを提供します。 PUSH通知を利用して外出先でも取引可能です。 ご購入後、取引方法の説明と優れた追加インジケーターを無料で入手するには、私にご連絡ください! おそらく、ギャンの取引手法についてはすでに何度も聞いたことがあるでしょう。通常、ギャンの理論は初心者のトレーダーだけでなく、すでにある程度の取引経験がある人にとっても非常に複雑なものです。なぜなら、ギャンの取引手法は理論的にはそれほど簡単に適用できるものではないからです。私はその知識を磨き、最良の原則を私の外国為替インジケーターに組み込むために数年を費やしました。 このインジケーターは非常に簡単に適用できます。必要なのは、それをチャートに添付し、簡単な取引推奨事項に従うだけです。このインジケーターは常に市場分析の仕事を行い、取引の機会を探します。適切なエントリーポイントを検出す
The Propfolio Master Suite is the ultimate all-in-one analytical workstation for professional traders. Combining the power of the Beat The Market Maker (BTMM) methodology, Smart Money Concepts (SND/Liquidity), and Advanced Volume Profile, this suite replaces multiple different indicators with one optimized engine. Monitor up to 14 pairs simultaneously from a single chart, instantly identify market cycles, and seamlessly map institutional footprints with the click of a button. The Command Center
M1 SNIPER は使いやすいトレーディングインジケーターシステムです。M1時間足向けに設計された矢印インジケーターです。M1時間足でのスキャルピングのためのスタンドアロンシステムとして、また既存のトレーディングシステムの一部としても使用できます。このトレーディングシステムはM1時間足での取引に特化して設計されていますが、他の時間足でも使用できます。元々、この手法はXAUUSDとBTCUSDの取引用に設計しましたが、他の市場においても役立つと考えています。 インジケーターのシグナルは、トレンドの方向と逆方向に取引できます。インジケーターのシグナルを利用して両方向に取引するのに役立つ特別な取引テクニックをご紹介します。この手法は、特別な動的なサポートとレジスタンスの価格帯を利用することに基づいています。 ご購入後、M1 SNIPER矢印インジケーターをすぐにダウンロードできます。さらに、M1 SNIPERツールのすべてのユーザーに、以下のスクリーンショットに表示されているApollo Dynamic SRインジケーターを無料で提供しています。この2つのインジケーターを組み合わせることで
Auto Optimized Parabolic RSI: 高度な3Dモメンタムエンジン ほとんどのリテール向けインジケーターは、市場のボラティリティが変化した瞬間に破綻する静的な入力値に依存しているため、失敗に終わります。Auto Optimized Parabolic RSIは、自らの数学的優位性を継続的に再計算することで「インジケーターの陳腐化」問題を解決し、機関投資家レベルの定量的適応力をMT5ターミナルに直接もたらします。 最大の強み: カスタムインメモリ3D最適化   標準的な自動最適化ツールは、インジケーターの呼び出しで端末に過負荷をかけるため、頻繁にMT5プラットフォームをフリーズさせます。本ツールは、このボトルネックを完全に回避しています。RAMベースのカスタムネイティブ計算機を内蔵した内部エンジンは、チャートを読み込んだりタイムフレームを変更したりするたびに、超高速の3Dグリッド探索を実行します。RSI期間(頻度)、SARステップ(加速度)、SAR最大値(制限速度)を同時にスイープし、プラットフォームを遅延させることなく、数万通りものパラメーターの組み合わせを絶対的
これはほぼ間違いなく、MetaTraderプラットフォームで見つけることができる最も完全な調和価格形成自動認識インジケーターです。 19種類のパターンを検出し、フィボナッチプロジェクションをあなたと同じように真剣に受け止め、潜在的逆転ゾーン(PRZ)を表示し、適切なストップロスとテイクプロフィットレベルを見つけます。 [ インストールガイド | 更新ガイド | トラブルシューティング | よくある質問 | すべての製品 ] 19の異なる調和価格形成を検出します プライマリ、派生および補完フィボナッチ投影(PRZ)をプロットします 過去の価格行動を評価し、過去のすべてのパターンを表示します この指標は、独自の品質とパフォーマンスを分析します 適切なストップロスとテイクプロフィットのレベルを表示します ブレイクアウトを使用して適切な取引を通知します すべてのパターン比をグラフにプロットします 電子メール/音声/視覚アラートを実装します スコット・M・カーニーの本に着想を得て、この指標は最も純粋で急を要するトレーダーのニーズを満たすように設計されています。ただし、トレードを容易にする
Scalper Inside PRO – Since 2020. An exclusive indicator that utilizes an innovative algorithm to swiftly and accurately determine the market trend. The indicator automatically calculates opening, closing, and profit levels, providing detailed trading statistics. With these features, you can choose the most appropriate trading instrument for the current market conditions. Additionally, you can easily integrate your own arrow indicators into Scalper Inside Pro to quickly evaluate their statistics
PRO Renko Systemは、特別にRENKOチャートを取引するために設計された高精度の取引システムです。 これは、様々な取引商品に適用することができる普遍的なシステムです。 システムは効果的に正確な逆転信号へのアクセスを与えるいわゆる市場の騒音を中和する。 表示器は非常に使いやすく、信号の生成に責任がある1つの変数だけがあります。 あなたは簡単にお好みの任意の取引ツールとレンコバーのサイズにツールを適応させることができます。 私はいつもあなたが私のソフトウェアで収益性の高い取引を支援するために余分なサポートを提供する準備ができています! 私はあなたに幸せで収益性の高い取引をしたいです! ご購入後にご連絡ください! 私はあなたに私のレンコチャートジェネレータを送信します。 私はまた、私の個人的な推奨事項やシステムの他のモジュールを無料で共有します!
LHおよびHLブレイクアウトを見つけるための純粋な価格アクションによって行われる高度な計算。 それはあなたに市場で素晴らしい逆転ポイントを与えるでしょう。LHとHL信号は同様にトレイングルブレイクアウトに使用することができます。 ブレイクアウトが発生すると、強い反転を示します。移動平均の優れたフィルターです。トレンドインジケーターと一緒に使用することを強くお勧めします。 サポートとレジスタンス、供給需要指標の追加確認として使用できます。 詳細については、次の外国為替スレッドをご覧ください。 インジケーターは再描画されていません。 Buffers :   SetIndexBuffer ( 0 ,UpBar);      SetIndexBuffer ( 1 ,UpBar2);           SetIndexBuffer ( 2 ,DnBar);      SetIndexBuffer ( 3 ,DnBar2);           SetIndexBuffer ( 4 ,UpBarTop);      SetIndexBuffer ( 5 ,UpBarLow);     
ご紹介     Quantum Breakout PRO は 、ブレイクアウト ゾーンの取引方法を変革する画期的な MQL5 インジケーターです。 13年以上の取引経験を持つ経験豊富なトレーダーのチームによって開発された Quantum Breakout PROは 、革新的でダイナミックなブレイクアウトゾーン戦略により、あなたの取引の旅を新たな高みに押し上げるように設計されています。 クォンタム ブレイクアウト インジケーターは、5 つの利益ターゲット ゾーンを備えたブレイクアウト ゾーン上のシグナル矢印と、ブレイクアウト ボックスに基づいたストップロスの提案を提供します。 初心者トレーダーにもプロのトレーダーにも適しています。 量子EAチャネル:       ここをクリック MT5バージョン:   ここをクリック 重要!購入後、インストールマニュアルを受け取るためにプライベートメッセージを送ってください。 推奨事項: 時間枠: M15 通貨ペア: GBPJPY、EURJPY、USDJPY、NZDUSD、XAUUSD アカウントの種類: ECN、Raw、またはスプレッドが非
このインジケーターを購入すると、プロ仕様のトレードマネージャーを無料で差し上げます。 まず第一に、このトレーディングシステムがノンリペイント、ノンリドロー、ノンラグのインジケーターであることを強調する価値がある。これにより、手動取引とロボット取引の両方に理想的なものになっています。 オンラインコース、マニュアル、プリセットのダウンロード。 「スマートトレンドトレーディングシステム MT5」は、新規および経験豊富なトレーダー向けにカスタマイズされた包括的なトレーディングソリューションです。10以上のプレミアムインジケーターを組み合わせ、7つ以上の堅実なトレーディング戦略を備えており、多様な市場状況に対応する多目的な選択肢となっています。 トレンドフォロー戦略:トレンドを効果的に乗り越えるための正確なエントリーとストップロス管理を提供します。 リバーサル戦略:潜在的なトレンドの反転を特定し、トレーダーがレンジ相場を活用できるようにします。 スキャルピング戦略:高速で正確なデイトレードおよび短期取引のために設計されています。 安定性:すべてのインジケーターはノンリペイント、ノンリドロー、ノ
現在40%オフ 初心者やエキスパートトレーダーに最適なソリューション! このインジケーターは、独自の機能と新しい計算式を取り入れた、ユニークで高品質、かつ手頃な価格のトレーディングツールです。たった1枚のチャートで28の為替ペアの通貨強度を読み取ることができます。新しいトレンドやスキャルピングチャンスの引き金となるポイントを正確に特定することができるので、あなたのトレードがどのように改善されるか想像してみてください。 ユーザーマニュアルはこちら  https://www.mql5.com/en/blogs/post/697384 これが最初の1本、オリジナルだ! 価値のないクローンを買わないでください。 特別な サブウィンドウの矢印で強い通貨の勢いを表示 GAPがあなたのトレードを導く! 基準通貨や気配値が売られすぎ・買われすぎのゾーン(外相フィボナッチレベル)にあるとき、個別チャートのメインウィンドウに警告表示。 通貨がレンジの外側から反落した場合、プルバック/リバーサルのアラート。 クロスパターンの特別なアラート 複数の時間枠を選択可能で、トレンドを素早く確認できます
ゴールドラッシュ・トレンド・アロー・シグナル ゴールドラッシュ・トレンド・アロー・シグナル 指標は、XAU/USDにおける高速・短期スキャルパー向けに最適化された、正確でリアルタイムのトレンド分析を提供します。 1分足専用に設計されたこのツールは、明確なエントリーポイントを示す方向矢印を表示し、スキャルパーが変動の激しい市場状況でも自信を持って取引できるよう支援します。 この指標は、PRIMARY(主要)とSECONDARY(補助)のアラート矢印で構成されています。PRIMARYシグナルは、トレンドの方向転換を示す白と黒の方向矢印であり、SECONDARYシグナルは、PRIMARY矢印が示す方向を確認し、潜在的なエントリーポイントを示す青と赤の矢印です。 注意:トレンド方向の変化後にPRIMARYアラート矢印が1つだけ表示される場合、複数のSECONDARY青/赤矢印が表示される点に注意が必要です。SECONDARYシグナルは、シグナル基準を満たす任意のローソク足後に表示されます。したがって、長期的なトレンド移動の場合、画面に多くのSECONDARY矢印が表示されます(添付の
デイトレーダーマスターは、デイトレーダーのための完全なトレーディングシステムです。システムは2つのインジケーターで構成されています。 1つの指標は売買する矢印信号です。それはあなたが得る矢印インジケーターです。 2つ目のインジケーターを無料で提供します。 2番目のインジケーターは、これらの矢印と組み合わせて使用​​するために特別に設計されたトレンドインジケーターです。 インジケーターは繰り返さず、遅れないでください! このシステムの使用は非常に簡単です。 2色の線で表示されている現在のトレンドの方向に矢印信号をたどる必要があります。青は買いの傾向です。赤い色は売りの傾向です。青い矢印は買いシグナルです。赤い矢印は売りの合図です。トレンドラインの色と一致するように、矢印の色と信号の方向が必要です。 矢印インジケーターは、主に時間間隔M5とM15での日中取引のために作成されました。ただし、技術的には、システムは他の時間間隔で使用できます。 インジケータには、PUSHメッセージ機能を備えたポップアップアラートが装備されています。 購入後、必ず私に書いてください!私はあなたにシステムとの取引の
Apollo SR Master は、サポート/レジスタンスゾーンを利用した取引をより容易かつ確実にする特別な機能を備えたサポート/レジスタンスインジケーターです。このインジケーターは、ローカル価格の高値と安値を検出することで、タイムラグなしでリアルタイムにサポート/レジスタンスゾーンを計算します。そして、新たに形成されたSRゾーンを確認するために、インジケーターは特別なシグナルを表示します。このシグナルは、SRゾーンを実際の売りまたは買いシグナルとして考慮して使用できることを示します。この場合、SRゾーンの強度が高まり、SRエリアからの取引が成功する確率も高まります。これがこのインジケーターの基本的な考え方です。 SRゾーンは、ストップロスとテイクプロフィットの設定を容易にします。シグナルの方向に応じて、SRゾーンの上または下のスペースをストップロスとして設定できます。さらに、反対側のSRゾーンは、潜在的なテイクプロフィットエリアとして設定できます。 また、Apollo SRマスターインジケーターをご利用のすべてのユーザーには、「Apollo Price Action System」
After purchase, contact me privately to receive 1 month of free testing with EA Forex Proton! This advanced MT4 trading robot automatically executes signals from any MT4 indicator, including Market Makers. The latest version also includes AI integration, allowing each trade signal to be analyzed using Artificial Intelligence. Live Signal with EA Forex Proton: Click here Market Makers is a powerful price action trading system designed to identify high-probability Buy and Sell opportunities based
Market Structure Patterns   is an indicator based on   smart money concepts   that displays   SMC/ICT   elements that can take your trading decisions to the next level. Take advantage of the   alerts ,   push notifications   and   email messages   to keep informed from when an element is formed on the chart, the price crosses a level and/or enters in a box/zone. Developers can access the values of the elements of the indicator using the   global variables  what allows the automation of trading d
Advanced Supply Demand
Bernhard Schweigert
4.91 (300)
現在40%オフ 初心者にもエキスパートトレーダーにも最適なソリューション このインジケーターは独自の機能と新しい公式を多数内蔵しており、ユニークで高品質かつ手頃な取引ツールです。このアップデートでは、2つの時間枠ゾーンを表示できるようになります。より長いTFだけでなく、チャートTFとより長いTF(ネストゾーンを表示)の両方を表示できます。すべてのSupply Demandトレーダーの皆さんのお気に召すはずです。:) 重要情報の公開 Advanced Supply Demandの可能性を最大化するには、 https://www.mql5.com/ja/blogs/post/720245 にアクセスしてください。   エントリーまたはターゲットの正確なトリガーポイントを正確に特定できれば取引がどのように改善されるか想像してみてください。新しい基盤となるアルゴリズムに基づいて構築されているため、買い手と売り手の間の潜在的な不均衡をさらに簡単に特定できます。これは、最も強い需要と供給のゾーンと、過去のパフォーマンス(古いゾーンを表示)がグラフィカルに表現されるためです。これらの機能は、最適な
CRT Candle Range Theory HTF MT4.   Ultimate CRT Indicator: Advanced ICT Concepts and Malaysian SnR Trading System Discounted   Price   $50  !!     Secure your lifetime access   now   before it switches to   subscription-only ! Master the Market Maker's Footprints with the Most Advanced Candle Range Theory Indicator Unlock the true power of   Smart Money Concepts (SMC)   and trade precisely like the institutions with the   Ultimate CRT Indicator . Built exclusively for serious traders, this indic
このインディケータは、異なる期間のフラクタルの価格構造を調べて、市場で起こり得る反転ポイントを決定し、すでに基本的または技術的な評価モデルを持っているポジショントレーダーにタイミングを提供します。弟の リバーサルフラクタル とは異なり、このインジケーターは選択された期間のためにリバーサルを逃すことはなく、ジグザグ形式でリバーサルフラクタルを見つけます。 [ インストールガイド | 更新ガイド | トラブルシューティング | よくある質問 | すべての製品 ] ターニングポイントは長いトレンドを開始できます インジケーターは再描画されていません あらゆる種類のアラートを実装します カスタマイズ可能な色とサイズ フラクタルは奇数番目のバーのフォーメーションであり、フォーメーションの最上位または最下位の中間バーであり、フラクタル内のすべてのバーが閉じるとインディケーターが描画されるため、このインジケーターはリアクティブまたは遅れ信号です。ただし、既存の方向バイアスを持つトレーダーは、この指標が非常に有用であり、早期のエントリポイントを取得します。 このインディケーターは、ボイルダウンされた
「 Dynamic Scalper System 」インジケーターは、トレンド波の中でスキャルピング取引を行う手法のために設計されています。 主要通貨ペアと金でテスト済みで、他の取引商品との互換性があります。 トレンドに沿った短期的なポジションオープンのシグナルを提供し、追加の価格変動サポートも提供します。 インジケーターの原理 大きな矢印はトレンドの方向を決定します。 トレンド波の中では、小さな矢印の形でスキャルピングシグナルを生成するアルゴリズムが機能します。 赤い矢印は強気方向、青い矢印は弱気方向です。 トレンドの方向には敏感な価格変動ラインが描かれ、小さな矢印のシグナルと連動します。 シグナルは次のように機能します。適切なタイミングでラインが現れるとエントリーシグナルが形成され、ラインが開いている間はポジションが保持され、完了すると取引が終了します。 推奨される動作時間枠はM1~H4です。 矢印は現在のローソク足に形成され、次のローソク足が開いている場合は、前のローソク足の矢印は再描画されません。 入力パラメータ Trend Wave Period - トレンド方向
They say history repeats itself. What if you could prove it in real-time? The Propfolio Ghost Pattern is an advanced algorithmic pattern-matching engine. It empowers you to select any current price action structure on your chart and instantly scan thousands of historical candles to find the exact moment in the past where the market did the exact same thing. Once it finds the highest probability match, it projects the historical outcome into the future as "Ghost Candles"—giving you a highly calcu
現在26%OFF! このインディケータは、当社のメインインディケータ( Advanced Currency Strength 28   &  Advanced Currency IMPULSE with ALERT )の両方のスーパーコンビネーションです。28の外国為替ペアのTICK-UNITSとアラートシグナルの通貨強度の値を示しています。11種類のTick-Unitが使用可能です。1、2、3、4、5、6、10、12、15、20、30秒の11種類です。サブウィンドウのTick-Unitバーは、秒単位のタイマーに1ティック以上含まれる場合に表示され、左側にシフトされます。 たった1枚のチャートで、28のFXペアをスキャルピングできます。スキャルピングのチャンスとなるトリガーポイントを正確に把握することで、スキャルピングが上達することを想像してみてください。 1分足よりも短い期間で動作する市場初の通貨強度インジケーターです! このインジケータは、素早いインとアウトを行い、小さなピップを切り取ることを望む高速スキャルパーのためのものです。 ユーザーマニュアル: ここをクリック h
まず第一に、この取引インジケーターは再描画されず、再描画されず、遅延しないことを強調する価値があります。これにより、手動取引とロボット取引の両方に理想的なものになります。 ユーザーマニュアル:設定、入力、戦略。 アトミックアナリストは、価格の強さとモメンタムを利用して市場でより良いエッジを見つけるためのPA価格アクションインジケーターです。ノイズや誤ったシグナルを除去し、取引ポテンシャルを高めるための高度なフィルターを備えています。複雑なインジケーターの複数のレイヤーを使用して、アトミックアナリストはチャートをスキャンし、複雑な数学的計算をシンプルなシグナルと色に変換します。これにより、どのような初心者トレーダーでも理解して使用し、一貫した取引の決定を行うことができます。 「アトミックアナリスト」は、新規および経験豊富なトレーダー向けにカスタマイズされた包括的な取引ソリューションです。プレミアムインジケーターとトップノッチの機能を1つの取引戦略に組み合わせ、すべてのタイプのトレーダーにとって汎用性のある選択肢にします。 デイリートレーディングとスキャルピング戦略:高速で正確な
KURAMA GOLD SIGNAL PRO(MT4版)— 7層フィルター・自動TP/SL・品質スコア搭載 XAUUSD完全トレードシステム リペイントなし。リドローなし。ラグなし。すべてのサインは確定後に変わりません。見たままが結果です。 特典:買い切りライセンスをご購入いただいた方に、AI Zone Radar($59相当)+PDFマニュアルを無料プレゼント。購入後にMQL5でメッセージをお送りください。 AI Zone Radar: https://www.mql5.com/en/market/product/175834 トレーダーから信頼されています:ゴールドトレーダーのコミュニティで実際に使用され、精度と使いやすさで高く評価されています。 あなたの問題 — そしてその解決策 ゴールドは1日$30〜$50動く。チャンスがあるのは分かっている。でもこういう経験はないか: - エントリーが早すぎて、$10逆行してから思った方向に動く - MAタッチのたびに入って、半分は負ける - TP/SLの基準がないから、持ちすぎるか早すぎる決済をする - 動かない時間帯にトレ
このインディケーターはダブルトップとダブルボトムの反転パターンを見つけ、ブレイクアウトを使用して取引シグナルを発生させます。 [ インストールガイド | 更新ガイド | トラブルシューティング | よくある質問 | すべての製品 ] クリアな取引シグナル カスタマイズ可能な色とサイズ パフォーマンス統計を実装します カスタマイズ可能なフィボナッチリトレースメントレベル 適切なストップロスとテイクプロフィットのレベルを表示します 電子メール/音声/視覚アラートを実装します これらのパターンは拡張でき、インジケーターは再描画によってパターンに追従します。ただし、インジケーターはトレードを容易にするためにツイストを実装します。トレードをシグナルする前に正しい方向へのドンチャンブレイクアウトを待機し、シグナルを非常に信頼性が高く、ほとんど再描画しません。 入力パラメータ 振幅:振幅は、代替価格ポイント間のバーの最小量を表します。大きなパターンを見つけるには、振幅パラメーターを大きくします。小さなパターンを見つけるには、振幅パラメーターを小さくします。 最小リトレースメント:パターンに
Gold Scalper Super is an easy-to-use trading system. The indicator can be used as a standalone scalping system on the M1 time frame, as well as part of your existing trading system. Bonus: when purchasing an indicator, Trend Arrow Super is provided free of charge, write to us after purchase. The indicator 100% does not repaint!!! If a signal appears, it does not disappear! Unlike indicators with redrawing, which lead to the loss of a deposit, because they can show a signal and then remove it.
チャートを構成し、周期的な価格変動を識別するテクニカル指標。 どのチャートでも動作します。 いくつかの種類の通知。 グラフ自体に追加の矢印があります。 履歴を再描画せずに、キャンドルのクローズに取り組みます。 M5以上のTFを推奨します。 パラメータの使用と設定が簡単です。 異なるパラメータを持つ 2 つのインジケーターを使用する場合、他のインジケーターなしで使用できます。 入力パラメータは2つあります 周期性と信号持続時間 これら 2 つのパラメータは、チャート構造の処理を扱います。 Cyclicity - 反転サイクルが変化する頻度を調整し、サイクルを滑らかにします。 Signal duration - 最小数では価格変動の衝動を検出し、最大数では長期的なトレンドの動きを検出します。
The indicator is built on a non-standard Zig Zag, it draws accumulations after which if the price leaves this zone and a test of this zone occurs, then a sound signal is given and an arrow appears - after the test candle closes.The indicator does not redraw its signals, it is very easy to use, there are only three settings 1- this is the zig zag parameter 2- this is the minimum price exit from the zone 3- this is the maximum price exit from the zone. The lower the parameter for Zig Zag, the more
Trend Screener
STE S.S.COMPANY
4.79 (95)
トレンドインジケーター、1つのツールに組み込まれたすべての重要なトレンド機能を備えたトレンドトレーディングとフィルタリングのための画期的なユニークなソリューション! これは、すべてのシンボル/商品(外国為替、商品、暗号通貨、インデックス、株式)で使用できる100%再描画されていないマルチタイムフレームおよびマルチ通貨インジケーターです。 期間限定オファー: サポートおよびレジスタンス スクリーナー インジケーターは、たった 65 ドルで永久的にご利用いただけます。(元の価格 250 ドル) (オファー延長) トレンドスクリーナーは、チャート内のドットで矢印トレンドシグナルを提供するインジケーターに続く効率的なインジケーターです。 トレンド分析インジケーターで使用できる機能: 1.トレンドスキャナー。 2.最大利益分析を備えたトレンドライン。 3.トレンド通貨強度メーター。 4.アラート付きのトレンド反転ドット。 5.アラート付きの強いトレンドドット。 6.トレンド矢印 毎日の分析例、毎日のシグナルパフォーマンス...など、トレンドスクリーナーインジケーターを使用して、ここで見つけること
Advanced UT BOT ALERTS for MT4 プロフェッショナル多重フィルター型トレンド検出システム|強化版 UT BOT エンジン 私たちは高品質なインジケーターのみを提供します。 Advanced UT BOT はプロフェッショナル向けに設計されており、安定したシグナルロジックと安全な計算構造によって遅延や誤更新を防止します。 過去のシグナルを 再描画・修正・削除することはありません 。 すべての BUY / SELL シグナルは ローソク足の確定後に生成され固定されます 。 リアルタイム取引中に 再描画は一切なく 、足が確定した時点で即座に表示されます。 期間限定オファー — 次回価格は 49 ドルになります。 価格が上がる前に今すぐ入手してください。 製品概要 Advanced UT BOT ALERTS   は、 UT BOT   のコアロジックに基づいて再構築された次世代のトレンドシグナルシステムです。 MT5 に完全対応し、複数のフィルター、動的ビジュアル化、高精度アラートを統合しています。 UT Bot インジケーターはもともと   Yo_adrii
作者のその他のプロダクト
Contact me after payment to send you the user manual PDF file. Monitoring the EA in real time: Signal 1 Full Automated trading robot, for the first time on the market, an Expert Advisor is designed based on divergence. Using divergences is one of the most common and practical trading methods. Because we see a divergence in most places where there is potential for price return. Diagnosis and trading based on them has a higher efficiency than many methods based on static indicators. You can downl
Greedy Golden MT4
Mihails Babuskins
4.8 (5)
Recommended:  it's better to  use in accounts with lower swap or swap-free accounts. SEE AND COMPARE WITH OTHER EA's , Real monitoring signals link on my profile. Contact me after payment to send you the user manual PDF file See the real monitoring signal in my profile. Use only on gold and on the  BUY direction. Trading gold is attractive to many traders due to the high volatility and depth of the market. Should we invest in gold or just scalp it? Answering this question is a big challenge for
Contact me after payment to send you the User-Manual PDF File. Divergence detection indicator with a special algorithm. Using divergences is very common in trading strategies. But finding opportunities for trading with the eyes is very difficult and sometimes we lose those opportunities. The indicator finds all the regular and hidden divergences. (RD & HD) It uses an advanced method to specify divergence. This indicator is very functional and can greatly improve the outcome of your trading. Thi
harmonic patterns   Harmonic patterns can be used to spot new trading opportunities and pricing trends – but only if you know exactly what you are looking for. Harmonic patterns are formed by combining geometric shapes and Fibonacci levels. As a result, Fibonacci levels are the key concept of these patterns. Identifying harmonic patterns requires more practice than other market classical patterns. But by learning these patterns, you can recognize the future trend of the price chart. These patter
Contact me after payment to send you the user manual PDF file. Download the MT4 version here. Volume Profile Indicator A functional and useful tool that can improve your trading plan. This indicator calculates volume in price levels(typical volume indicator shows only candle volumes). With the volume of price levels, you can identify important areas that have the potential to reverse. You can also see the volume of support and resistance levels and decide on them. Using volume profiles along
Calculation of Lot Size for many traders is a big challenge. A case that is very important in money management. What many traders ignore. Choosing an appropriate Lot Size in trades can improve results and it will ultimately lead to success. This indicator calculates the authorized Lot Size for your trades. The indicator uses the following values to get the appropriate Lot Size for positioning: The distance of Stop Loss. The Pip Value. The amount of Risk Allowed For Each Trade. The amoun
FREE
Contact me after payment to send you the user manual PDF file. Download the MT4 version here. Unlocking Trading Insights Dive into the heart of market dynamics with Advance Divergence Scanner designed for traders seeking a competitive edge. The Divergence Indicator is your key to identifying crucial divergences across various charts, empowering you to make informed decisions in the dynamic world of financial markets. The Divergence A Divergence signals a potential reversal point because directi
Contact me after payment to send you the User-Manual PDF File. Triangle Pattern Sometimes the price cannot make higher highs or lower lows and it moves in a converging price range and waves are shorter than before until the movement creates a geometric shape of a symmetrical triangle, which indicates It is maybe the end of the trend. The triangle pattern is a well-known in forex and the trading plan and strategy of many traders is based on it. The Triangle Pattern Scanner Indicator It is usu
RSI Divergence Full
Mihails Babuskins
4.61 (28)
RSI Divergence Full   +10 other divergence indicators Contact me after payment to send you the User-Manual PDF File. Download the MT5 version here. Also you can download the >>>  Hybrid Trading EA  <<< that is designed and implemented based on RSI Divergence Indicator. RSI is a pretty useful indicator in itself but it's even more effective when you trade divergence patterns with that. Because the divergence signal of the RSI indicator is one of the most powerful signals among the indicators. Di
Contact me after payment to send you the User-Manual PDF File. 5W Pattern  introduction The 5W pattern occurs when the price forms an alternating 5-wave cycle with its volatility. In fact, the 5W  pattern is a price series of alternating HH or LL (higher high or lower low), which is the main characteristic of a trend. The pattern of 5W should have the characteristic of non-overlapping waves, also the points of the pattern are usually formed in Fibonacci levels. The completed pattern of 5W actua
Contact me after payment to send you the User-Manual PDF File. This indicator gives a signal when the probability of starting a trend is high. To calculate entry points, it uses a combination of some indicators like "Moving Average", "ADX", RSI with support and resistance points. This indicator is a trend follower and it doesn't determine that TP because it is not necessary, it uses the stop-loss trailing system (Of course, the indicator determines the SL, but you have to move it yourself becau
RSI Signals Scanner
Mihails Babuskins
4.75 (4)
RSI Signal Scanner The primary trend of the stock or asset is an important tool in making sure the indicator's readings are properly understood. For example, some of the technical analysts, have promoted the idea that an oversold reading on the RSI in an uptrend is likely much higher than 30%, and an overbought reading on the RSI during a downtrend is much lower than the 70% level. This indicator notifies you of RSI important levels breakouts (30% and 70%) by searching among the symbols and chec
FREE
Download directly the indicator file here. (if you can't open on MT4) MACD Indicator is one of the most popular momentum indicators among users. Searching and detecting MACD signals by the eye may not be easy. Scan Full Charts Dashboard Indicator with simple user interface and search customization panel saves time and scans all charts for MACD signals search and notifies the user with high accuracy. After finding the signal, the user was aware of the result by alerts and notifications. This ind
FREE
See my other products here. One Click Order This product helps you to send your order as quickly and easily as possible. Send your order as fast as possible: Just set your position parameter values(Price, TP, SL, Ex Date) with just a few simple mouse drags. On the other hand, the calculation of the losses and profits value before ordering is always a big challenge for traders; This expert is very useful in taking a position and calculating the amount of the stop loss/the take profit(in the curr
FREE
This utility manage your position risk by trailing stop with "Parabolic SAR" indicator value. Indicator Parameters SAR step(Parabolic SAR step value) SAR maximum(Parabolic SAR maximum value) Timeframes(Choose timeframes). Stop Place(put SL in current(open) candle or last close candle). Is the spread considered?(Set SL with considering to Spread or not, the choice is with you). Working with this utility is very simple, Just drag it onto the chart. There is no problem with multi-part trades. It is
FREE
Sometimes a trader needs to know when a candle will close and a new one appears to make the right decisions, this indicator calculates and displays the remaining of current candle time . It is simple to use, just drag it on the chart. Please use and express your opinion, expressing your opinions will promote the products. To see other free products, please  visit  my page.  
FREE
Ichimoku Signals Dashboard To test the indicator please download demo version  here. Find Ichimoku signals as easy as you can. Ichimoku is one of the most powerful trends recognition indicators. And it has valid signals for the trades. This indicator scans several symbols and time-frames by the Ichimoku to find all the signals that you want and show in a dashboard. It's easy to use, just drag it onto the chart. It's better to add  Ichimoku indicator  to chart before adding this indicator. Ichimo
Currency Strength Gauge incicator The currency strength gauge is an indicator to measure of the strength or weakness of currencies in the Forex market. Comparing the strength of currencies in a graphic representation will lead to a good overview of the market and its future trends. You will see in a graphic chart both the strength of the currencies and their correlation, and this will help you in your decisions to get better trades.   -To easy detection of over Overbought and Oversold points,
Contact me after payment to send you the User-Manual PDF File. ADVANCE PRICE ACTION TRADING CONCEPT. To test the indicator, you can download the demo version on my product list. it’s free (only shows patterns that have occurred in the past of the market). Quasimodo is  a reversal trading pattern  that appears at the end of an uptrend. As a price formation, the Quasimodo pattern is depicted by three peaks and two valleys, where: First, the middle peak is the highest, while the outside two peaks
Contact me after payment  to send you the  User-Manual PDF  File. Volume Profile Indicator A functional and useful tool that can improve your trading plan. This indicator calculates volume in price levels(typical volume indicator shows only candle volumes). With the volume of price levels, you can identify important areas that have the potential to reverse. You can also see the volume of support and resistance levels and decide on them. Using volume profiles along with   Price Action   and  
Contact me after payment to send you the User-Manual PDF File. Harmonic Trading The secret is the Fibonacci. It has been proven in the markets that price always reacts to Fibonacci levels. Fibonacci levels are one of the most important indicators of price changes. Sometimes the sequence of reactions to these levels in the chart make geometric shapes, which are called harmonic patterns. The price creates harmonic patterns with its fluctuation and reaction to Fibonacci levels. Harmonic patterns c
Contact me after payment to send you the User-Manual PDF File. Double Top/Bottom Pattern Double top and bottom patterns are chart patterns that occur when the underlying investment moves in a similar pattern to the letter "W" (double bottom) or "M" (double top). Double top and bottom analysis are used in technical analysis to explain movements in a security or other investment, and can be used as part of a trading strategy to exploit recurring patterns. Searching for this pattern among the cha
Greedy Red
Mihails Babuskins
4.34 (29)
Contact me after payment to send you the user manual PDF file Real monitoring signals:    Please see links on my profile Greedy Red is an Expert Advisor is designed based on Volume Profile FR . Volume Profile FR  calculates volume in price levels (typical volume indicator shows only candle volumes). With the volume of price levels, you can identify important areas that have the potential to reverse. You can also see the volume of support and resistance levels and decide on them. Greedy Red(GR)’
Contact me after payment to send you the user manual PDF file. Introduction The moving average indicator is the most well-known and one of the most popular indicators among traders. It is very simple to work with, but a basic question has always become a big challenge among traders: What is the most optimal setting of the moving average for each chart-time frame? The answer to this question is very difficult, you have to try different settings of the moving average indicator for different chart
Contact me after payment to send you the user manual PDF file. Introduction Introducing the Wolfe Pattern Indicator, a powerful tool designed to help traders identify and capitalize on the elusive Wolfe Pattern in financial markets. This innovative indicator uses advanced algorithms to scan for the Wolfe Pattern in all symbols and time frames, providing traders with a unique edge in the market. How to trade with the Wolfe Pattern The Wolf Pattern is a rare and lucrative trading opportunity that
フィルタ:
Giulio Franceschini
692
Giulio Franceschini 2025.03.17 12:38 
 

It is the best and most complete indicator for the 123 pattern, fast without hitches, also allows you an option to anticipate the formation of the pattern and therefore to exploit the potential of the pattern in advance, but it is only to satisfy expert traders, because it has a certain amount of risk, however the option is there.

It would be a stratospheric indicator if a panel with the statistics of winning and losing referred to the first target were added, clearly you can't expect the moon the price is already very competitive.

kingkong1959
34
kingkong1959 2023.06.05 20:01 
 

voll schlecht

Mihails Babuskins
78464
開発者からの返信 Mihails Babuskins 2023.06.06 17:39
Hi,
the new version is available ⭐️⭐️⭐️⭐️⭐️
Please download the new version,
It's fast and more functional. Thank you 🙏🌹 ☘️
PipMonster491
26
PipMonster491 2023.05.21 06:11 
 

This indicator is the best, extremely helpful. Customer service is top notch. Thanks Mihails Babuskins.

Mihails Babuskins
78464
開発者からの返信 Mihails Babuskins 2023.05.21 16:41
Thank you for your kindness ☘️🌹 🙏
aworex
1915
aworex 2023.05.17 21:12 
 

A very good indicator to add to one’s trading tools by the way what does the start scanning from X candles enhance should this value always be 0 or higher

Mihails Babuskins
78464
開発者からの返信 Mihails Babuskins 2023.05.18 10:51
Thank you for reviewing. ⭐️⭐️⭐️⭐️⭐️
Dmitrijs Ivanajevs
1256
Dmitrijs Ivanajevs 2023.04.14 09:59 
 

Пока на тесте. Сразу предложения ))) 1. Возможность перемещать по графику в удобное для меня место. 2. Основной ( рабочий ) индикатор стоит на пустом графике. Выбрана опция "MarketWatch Symbols", что должно означать - сканирование только тех символов, которые выбраны в окне "Обзор рынка". За эти пару дней добавилось уже 3 новых символа.

Mihails Babuskins
78464
開発者からの返信 Mihails Babuskins 2023.05.18 10:51
Thank you for reviewing. ⭐️⭐️⭐️⭐️⭐️
KGreene
174
KGreene 2023.04.10 15:27 
 

Awesome Indicator. Provides more accurate results than many other indicators on the market. Superb.

Mihails Babuskins
78464
開発者からの返信 Mihails Babuskins 2023.04.11 05:36
Thank you for reviewing. ⭐️⭐️⭐️⭐️⭐️
OssZ.tFx
91
OssZ.tFx 2023.03.09 19:48 
 

Mihails i have a suggestions for your tool, if is possible can you add 1m timeframe? Would be even better than actually is

Mihails Babuskins
78464
開発者からの返信 Mihails Babuskins 2023.03.09 20:22
Thank you for reviewing. ⭐️⭐️⭐️⭐️⭐️
warrior137
1308
warrior137 2023.03.08 06:12 
 

the best indicator i bought,,excellent dashboard with helpfull TP1 TP2 TP3 and SL line,,,thank you Mihails Babuskins

suresh2425
236
suresh2425 2022.11.27 12:21 
 

Scanning is ok, but useless indicator.

Mihails Babuskins
78464
開発者からの返信 Mihails Babuskins 2023.02.10 08:34
Thank you for reviewing. ⭐️⭐️⭐️⭐️⭐️
Bill.Liberalism
169
Bill.Liberalism 2022.11.11 17:01 
 

ユーザーは評価に対して何もコメントを残しませんでした

Mihails Babuskins
78464
開発者からの返信 Mihails Babuskins 2022.11.13 16:17
Thank you for your kindness ☘️🌹 🙏
I hope this product give ⭐️⭐️⭐️⭐️⭐️ profit to you.
yemiodamo
55
yemiodamo 2022.09.27 12:59 
 

Absolutely useless indicator 100% lagging shows the pattern only after its formed so i wouldnt waste your money on this

Mihails Babuskins
78464
開発者からの返信 Mihails Babuskins 2022.11.13 18:04
Hi,
Please download the new version.
The feature of scanning signals "before pattern completion" was added.
Stanislav Melnikov
868
Stanislav Melnikov 2022.07.15 12:52 
 

Вполне рабочий инструмент, расширяет возможности при поиске входа в рынок. Думаю, что для торговли индексами было б хорошо добавить М1, при условии если терминал тупить не начнет. С нетерпением ожидаю обновление с функциями фильтра и новых паттернов, фильтр дивергенции лучше наверное сделать отключаемым.

Mihails Babuskins
78464
開発者からの返信 Mihails Babuskins 2022.07.16 16:16
Thank you 🙏 🌹☘️
aucam
73
aucam 2022.07.12 15:08 
 

Very helpful indicator, help you to choose TP and SL ...

Mihails Babuskins
78464
開発者からの返信 Mihails Babuskins 2022.07.16 16:16
Thank you 🙏 🌹☘️
faithdefender
1746
faithdefender 2022.05.02 16:40 
 

I really like this indicator for the price. It does take some time to compile the scan, but that is understandable since it is looking for numerous pairs at numerous timeframes. Fairly priced for what it does!

Mihails Babuskins
78464
開発者からの返信 Mihails Babuskins 2022.05.02 23:23
Thank you for your kindness ☘️🌹 🙏
Pierrdi2
242
Pierrdi2 2022.04.08 09:10 
 

Great

Mihails Babuskins
78464
開発者からの返信 Mihails Babuskins 2022.04.08 11:24
Thank you 🙏 🌹☘️
Demir.Sakit
74
Demir.Sakit 2022.04.08 06:07 
 

ユーザーは評価に対して何もコメントを残しませんでした

Mihails Babuskins
78464
開発者からの返信 Mihails Babuskins 2022.04.08 07:45
Thank you 🙏🌹 ☘️
レビューに返信