High Low Time Frame Levels MT5
- インディケータ
- バージョン: 1.1
- アップデート済み: 24 10月 2022
- アクティベーション: 8

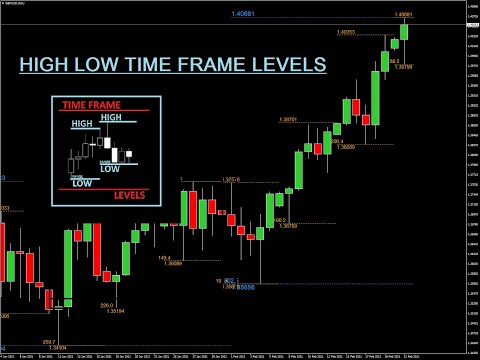
The utility helps to locate in the lower time frames the maximum and minimum of the upper time frame. The length of time frame level line represents the temporal length of the upper time frame. It's possible to OnOff the levels with a button or keys
The indicator draws lines that delimit the upper time frames candle and highlights his high-low price and the pips candle range.
How it works:
- Firstly. Choose which time frames levels to represent in the lower ones: monthly, weekly, daily, H4, H1, M30, M15, M5. The default is set to display in the current time frame all the upper ones.
-
Finally for each time frame level that you have decided to represent, you need to choose how many N candles will produce levels in the lower time frame.
Input
- It is possible to setups for each time frame levels the N candle to represent in the lower time frames
- You can shut down a single time frame level for all time frames or you can esclude his representation in a single lower time frame
- It is possible to customize the color in every time frame level
- You can shut down separately the text for the high low and their pips ranges. It is also possibile to personalize the size and the angle of the texts
- You can add a text nearby the text of the maximum
ユーザーは評価に対して何もコメントを残しませんでした