Multi Timeframe Moving Averages MT5
- インディケータ
- バージョン: 2.10
- アップデート済み: 16 1月 2022
- アクティベーション: 5
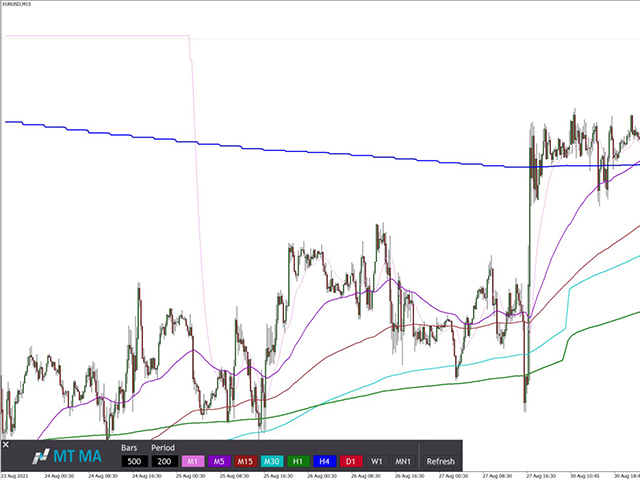
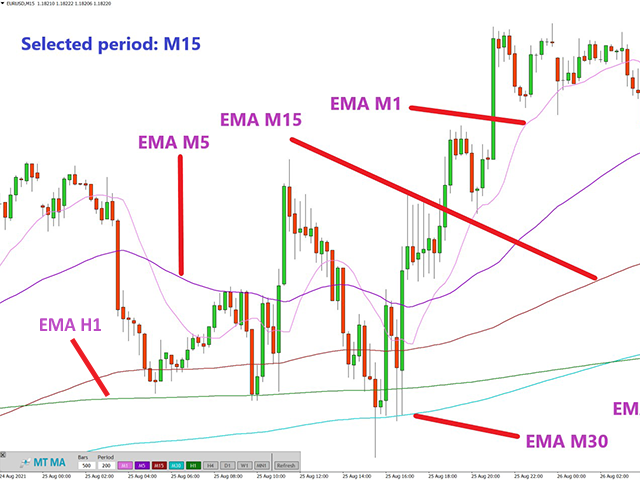
MT Moving Average
MT Moving Average is an easy to use multi time frame moving average indicator. It shows moving averages (SMA or EMA) of current symbol from all time frames (higher and lower). No need to switch between time frames anymore. With help of the indicator panel you can select which timeframe should be shown on the chart. I.e. your current timeframe is M5 and you can turn on M15 to see the the moving average of period M15.
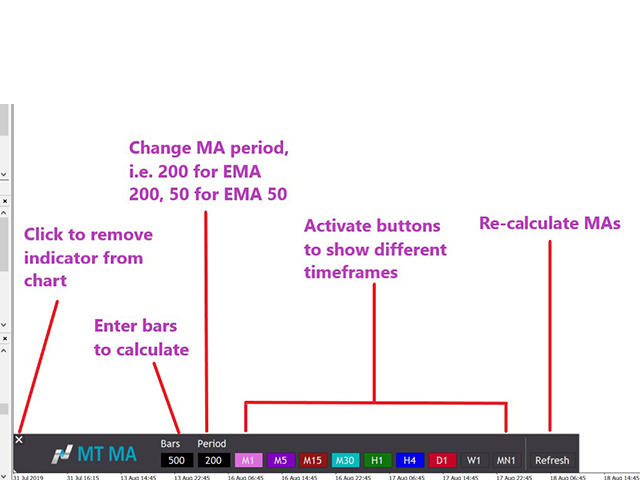
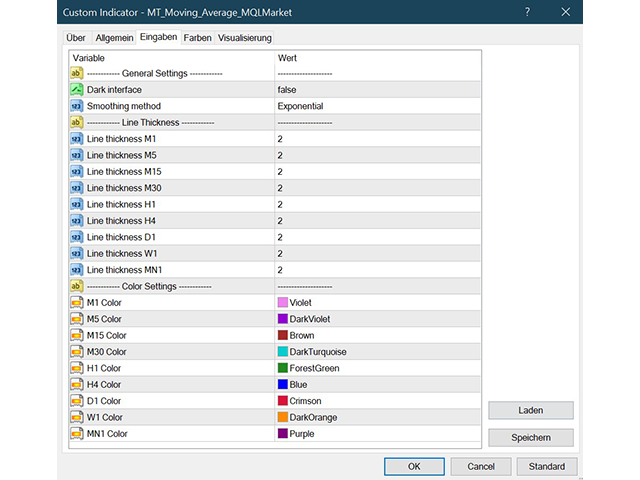
Indicator settings
- Dark interface--> Set to true to use dark colors for panel and buttons
- Smoothing method--> Moving average smoothing method: Choose between Simple (SMA), Exponential (EMA), Smoothed or Linear weighted
- Line thickness--> Set line thickness for different timeframe MAs. Tip: set different thickness for different timeframes
- Colors--> Set colors for moving averages
MT4 version also available in the market.

ユーザーは評価に対して何もコメントを残しませんでした