Two point

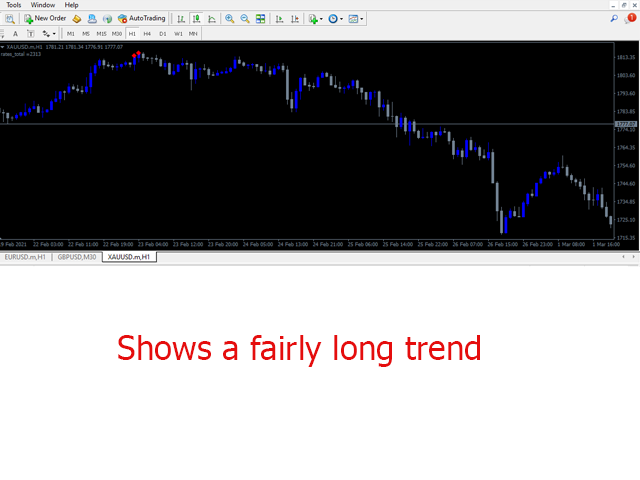
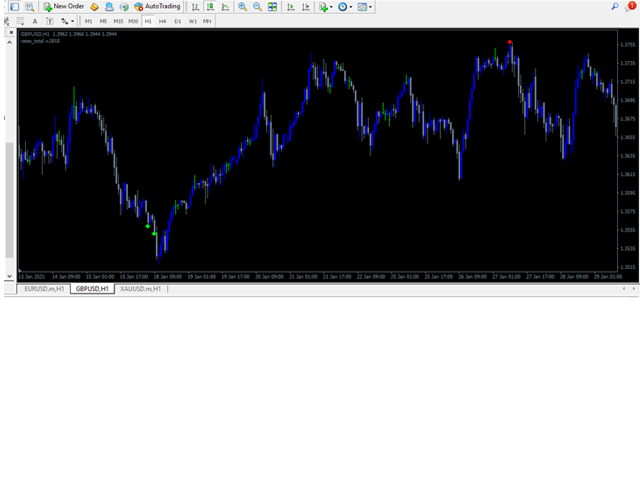
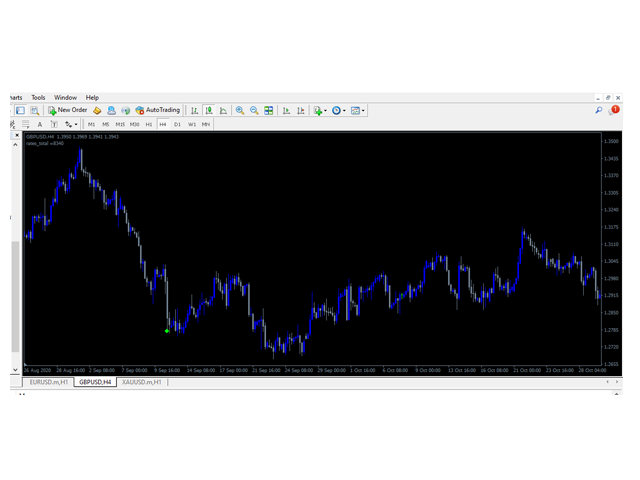
This indicator has two objects, a Lime and Red Point. This indicator takes and combines several built-in indicator functions / requirements and creates more conditions Lime indicates an uptrend and a red downtrend. This indicator reads the total rates in all timeframes and displays the amount in the comment. The likelihood of a correct prediction increases when two dots of the same color are close together.

Thank you for visiting, good luck


おすすめのプロダクト
このインジケーターは実践的なトレードに最適な自動波動分析のインジケーターです! 場合... 注:   Tang Lun (Tang Zhong Shuo Zen) の命名規則の影響で、私は波のグレーディングに西洋の名前を使用することに慣れていません。基本的な波を ペン 、二次波のバンドを セグメント と名付けました。同時に、 セグメント にはトレンドの方向が指定されます (この命名方法は将来のノートで使用されます。最初に言っておきます)。ただし、アルゴリズムは曲がりくねった理論とはほとんど関係がないため、付けるべきではありません。これは、私の市場分析 によって要約された、絶えず変化する複雑な運用ルール を反映しています。 バンドは標準化され、人によって異なることがないよう定義されており、市場参入を厳密に分析する上で重要な役割を果たす人為的な干渉の描画方法が排除されています。 このインジケーターを使用することは、取引インターフェイスの美しさを改善することと同等であり、元の K ライン取引を放棄し、取引の新しいレベルに連れて行きます。また、宣伝の観点から顧客の認識も向上します。 イ
The First Dawn indicator uses a unique mechanism to search and plot signals. This keeps searching for signals, making it a great indicator for scaping and identification of changes in direction, swing trading and trend trading. The  First Dawn   helps you get early signals. The backtest gives the true picture of how the indicator works with real/demo accounts. Although this is a tiny indicator it is packed with advantageous settings that will help you whether you desire to: Snap the Peaks and
この取引ツールを使用すると、15 の市場を同時にスキャンできます。 新しい取引指標 2024 のご紹介: ️ ダッシュボード マルチ通貨 マルチタイムフレーム 確率的。 私がこの取引ツールを作成した理由は少なくとも 2 つあります。 まず、1 つの市場だけを観察することに飽きました。 次に、別の市場への参入の瞬間を逃したくないです。 だからこそ、他の市況も同時に知りたいのです。 このため、複数の市場の状況を同時にスキャンできるスキャナーが必要です。 私は確率的メインライン > (または <=) 確率的シグナルラインが M1 から H4 (または単に M1 から M30) で始まる市場をよく探します。 私の分析に同意するなら、これがあなたが探していた取引指標です。 市況が上記の要件を満たす瞬間を見逃さないでください。 これは、多くの優れた機能を備えたストキャスティックのスキャナーまたはダッシュボードです。 確率的メインラインのデータを表示可能 確率シグナルラインのデータを表示可能 確率的メインラインとシグナルラインの位置を表示可能(シグナルラインの上のメインライ
The three line strike pattern, which consists of three bullish or bearish candles, and a fourth candle that is larger than the previous three in the opposite direction, can be traded many ways.  This indicator simply highlights those previous trades, and then pushes out targets in the direction of the last candle. Advantages of three line strike The three line strike can be traded as part of a bullish and bearish engulfing pattern, 2 bar reversal set up and n-Bar rallies and declines. How it w
Moving Pivot Average    The pivot indicator compares the selected period with its counterpart from the previous period. The indicator uses very flexible algorithm for pivot value calculating. It allows you to allocate in days a certain time intervals (custom bars) and calculate the average pivot value based on High, Low and Close prices of these bars. How many custom bars will be taken into account is determined by the "Days" setting. The pivot line can be considered an average trend line and us
Dynamic SR Trend Channel Dynamic SR Trend Channel is a simple indicator for trend detection as well as resistance/support levels on the current timeframe. It shows you areas where to expect possible change in trend direction and trend continuation. It works with any trading system (both price action and other trading system that use indicators) and is also very good for renko charting system as well. In an uptrend, the red line (main line) serves as the support and the blue line serves as the r
R Scalper Arrows インジケーターは、通貨ペアの読みやすい売買シグナルの矢印を提供します。 短期的な傾向を予測するのに適しています。 上向きの矢印は、ペアが短期的な上昇トレンドにあることを示します。 下向きの矢印は、ペアが短期的な下降トレンドにあることを示します。 ロングトレードの場合は、ストップロスをピップの下に置きます。 ショート トレードの場合は、ピップの上にストップ ロスを設定します。 一緒に行く このインジケーターは、単純移動平均や指数移動平均などの外国為替インジケーターに続く長期トレンドと共に使用できます。 トレンド フォロー インジケーターが示すトレンドの方向にのみトレードします。 基本的な取引シグナル R Scalper Arrowsインジケーターシグナルは解釈が簡単で、次のようになります。 買い取引 – 紫色の上向き矢印がチャートに表示されたら、買い取引を開始します。 売り取引 – 紫色の下向き矢印がチャートに表示されると、売り取引が開始されます。 取引終了 – 反対のシグナルに基づいて取引を終了するか、独自の取引終了方法を使用します。
This product works by detecting trend opportunities. So as shown in the screenshot when The indicator shows an upward arrow it shows the market is on an uptrend and when the indicator Shows a downward arrow it shows the market is on a downward direction. What makes this indicator Special is that it has additional signals just below the arrow signals. It is up to the trader to be  Creative and combine these signals with the arrow signal to get accurate forecasts.
Trend based indicator Identify trends with this indicator A simple-to-use trend indicator No complicated settings Attributes: Can be used in all symbols Can be used in all time frames Relatively high signals No complicated settings Specific to the trend Lifetime support Settings: Alarm Show Alert: By activating these settings, after receiving the signal, you will receive an alarm in Metatrader Alarm Show Notification: By activating these settings, after receiving the signal, you will receive a
Multi Indicators Scanner Indicator Scan  ADX ,Moving Average ,ENVELOPE ,SAR , MACD ,RSI  and ATR . We can change all input parameters in chart window. scanner works Multiple Time Frame we can change Timeframe .  Symbol button based on Trend color , we can click button and open chart .  We can also save templates in input.   Default settings Time Frame   1Hour Templates Name  Default Auto Arrange Chart  true
MASTER MAは、移動平均クロスベースのインジケータであり、異なる期間の3つの移動平均を使用してシグナルを生成し、戦略は非常にシンプルですが、インジケータには、勝率/総利益などの有用なインスタントバックテスト結果を示す統計ダッシュボードがあります...など、このインジケーターにはポイント単位でTPとSLの入力があるため、TPとSLをTPの緑の点とSLの赤いxの形でチャートに表示することができ、インジケーターはそれらの値を使用して勝敗率を計算します。 この指標は、新しいバーが厳密に開いているときに信号を送ります。信号が再描画されたり遅延したりすることはありません。 推奨事項:m5以上を使用してください...毎日の目標を持つ...インジケーターの期間をいじって、より良い結果を得てください。 パラメーター: 3つの移動平均の期間と種類 アラート TP/SL値は、各シグナルとともにチャートに印刷し、以下に基づいて勝敗を計算します。 ダッシュボードの色と位置の入力 -------------------------------------------------------
Machine Learning Adaptive SuperTrend - Take Your Trading to the Next Level! Introducing the   Machine Learning Adaptive SuperTrend , an advanced trading indicator designed to adapt to market volatility dynamically using machine learning techniques. This indicator employs k-means clustering to categorize market volatility into high, medium, and low levels, enhancing the traditional SuperTrend strategy. Perfect for traders who want an edge in identifying trend shifts and market conditio
A useful scanner/dashboard that shows the RSI values for multiple symbols and time-frames. It can be easily hidden/displayed with a simple click on the scanner man top left of the dashboard. You can input upper and lower RSI values and the colours can be set to show when above/below these values. The default values are 70 and 30. There are also input colours for when the RSI is above or below 50 (but not exceeding the upper/lower levels Symbols and time-frames are input separated by commas.
To access the TD sequential Scanner for MT5, please check https://www.mql5.com/en/market/product/123369?source=Site +Market+My+Products+Page. One of the MT5 versions includes additional timeframes such as M1, M2, M3,H2,H6,H8 and so on.( https://www.mql5.com/en/market/product/123367?source=Site +Market+My+Products+Page) TD Sequential Scanner: An Overview The TD Sequential scanner is a powerful technical analysis tool designed to identify potential price exhaustion points and trend reversals in fi
This indicator helps you to find price that may cause MACD Signal crossover on the current bar.. These crossover points are depicted in form of stars (like Parabolic SAR). prevEMA line also helps you to decide the trend. Get 20% OFF for rents for 1 year! How to use: MACDSignalStars (Violet) stars displayed are the the prices that make the MACDmain = MACDsignal. If the close price is higher than the star, then MACDmain > MACD signal. If the close price is lower than the star, then MACDmain < MA
パラボリックSARマルチカレンシースキャナーダッシュボード MT4 は、パラボリックSAR(PSAR)インジケーターを使用して複数の通貨ペアと時間枠を監視するために設計された包括的な取引ツールです。シンボルと時間枠(M1からMN1まで)でシグナルを整理するグリッド形式を提供します。トレーダーは、戦略に基づいて特定の時間枠を有効または無効にでき、的を絞った効率的な市場分析を保証します。 MT5バージョンはこちらで入手できます: Parabolic SAR Multicurrency Scanner MT5 詳細なドキュメントはこちらをクリックしてください: ドキュメント 主な機能: パラボリックSARの統合:ステップと最大値のパラメーターをカスタマイズ可能なPSARインジケーターを使用し、反転と継続を特定するための正確なトレンド分析を可能にします。 コンフルエンスアラート:複数の時間枠が同じ方向に揃う際にコンフルエンスシグナルを強調表示し、高い信頼性の取引機会を提供します。 カスタムアラート:ポップアップ、メール、またはプッシュ通知を介してリアルタイムの通知を提供し、トレーダーが重要なシ
This indicator shows the main trend on the current chart. Features This indicator includes two bands, one is the inner white bands, another is the outer blue bands. If the white dotted line crosses down the white solid line, this means that the trend has changed to be bearish. If the white dotted line crosses up the white solid line, this means that the trend has changed to be bullish. Once the crossing happened, it will not repaint. Settings ShowColorCandle: if 'true', it will show the color
No idea why demo is not working. you can check the GIF to see how it works. Features With this scanner you can detect Candles which are below/above yesterday high/low lines. A pair's rectangle turns RED in dashboard if it is above the yesterday high, and rectangle turns GREEN in dashboard if it is below the yesterday low. It gives alerts in every 15m candle close. Contains a Dashboard which will help you to see all market pair's. It is possible to disable this sorting through to make it easier
Super MA Trend indicator is an indicator designed to find trends. It uses a moving average, a set of candle combinations and High/Low levels to find trends. This indicator is a complete trading system. You can trade with this indicator as you like. Features and Recommendations You can use this indicator on all pairs except for the volatile pairs. It is recommended to use it on M15 and over graphics. The most important element in this indicator are alerts. Do not open orders unless you receive a
KT Aroon MT4
KEENBASE SOFTWARE SOLUTIONS
KT Aroonオシレーターは、Tushar Chande氏が1995年に開発した元のAroonオシレーターを改良したバージョンです。現在の高値および安値間の時間間隔を測定し、その情報をもとに市場トレンドの方向と強さを計算します。  このインジケーターは、上昇トレンド中には連続して新高値が形成され、下降トレンド中には新安値が形成されるという概念に基づいています。 買いシグナル: Aroon UpラインがAroon Downラインを上抜けたとき。 売りシグナル: Aroon DownラインがAroon Upラインを上抜けたとき。  特徴 チャート上にAroonシグナルを示す上下の矢印を表示。 市場のトレンドを効率的に表示。 シンプルで視認性が高く、チャートが煩雑になりません。 すべてのMetaTraderアラートに対応。 入力項目 期間: Aroon UpおよびDownラインの計算に使用される期間。 上下矢印の表示: Trueに設定すると、各新しいシグナルでチャートに矢印を表示します。 アラート設定: ポップアップ、サウンド、モバイル通知、メールなどの各種アラートを設定可能。 Ar
If you are unsure how to use this indicator, please feel free to reach out to me. I will explain it to you and provide reading materials to help you make the most of it. Here’s a brief description of how to use the indicator effectively. How to Use TD Sequential by Tom DeMark The TD Sequential is a technical analysis indicator developed by Tom DeMark, designed to identify potential turning points in market trends. It is widely used by traders to anticipate market reversals and manage trading ris
コアラトレンドラインの紹介: この指標は、トレーダーがトレンドをよりよく見つけるのに役立つように作成しました。このインジケーターは、現在のトレンドラインを示すことができます。 ご存知のように、傾向線は2つの最高点または最低点の間にある必要があります。 したがって、基本的なロジックは、最高点と最低点を見つけることです。 インジケーターは、履歴の最高点と最低点をすべて見つけ、それらを赤と青の点で示します。 これらの最高点と最低点は、深度値に従って計算されます。深度値は調整可能であり、ユーザーが変更できます。 深さはどういう意味ですか? 深さが10の場合、最も高いキャンドルホルダーは10本のキャンドルの中で最も高いはずです。前の5番目と次の5番目のキャンドルホルダーの間に最も高いキャンドルホルダーがあるはずです。 深さが10の場合、周囲の10の間の最低のろうそくが最低であり、周囲の5から5の間の最低のろうそくが次のろうそくであることを意味します。 [XTHに接続]オプションはどのように機能しますか? 指標は下降トレンドラインを描くために2ポイントを必要とします。彼は反対方向を見て、2番目の
The trader uses the Trend for Neuro indicator to determine the market situation. This is a trending algorithm that is convenient to download, install and use. The algorithm with acceptable accuracy generates input signals and output levels. Strategy for trend trading, filtering and all the necessary functions built into one tool! By launching the indicator, the user will see only two types of arrows that can change color to blue during an uptrend, to red during a downtrend there is no uncertaint
Binary Options Support Resistance Indicator This indicator is designed for binary options trading and effectively shows retracements from support and resistance levels. Signals appear on the current candle. A red arrow pointing downwards indicates a potential selling opportunity, while a blue arrow pointing upwards suggests buying opportunities. All that needs adjustment is the color of the signal arrows. It is recommended to use it on the M1-M5 timeframes as signals are frequent on these timef
No Repaint Bext は完全な取引システムです。エントリーとエグジットのタイミング、そして取引の方向を示します。 緑の矢印 が表示されるたびに、 買い注文 を開きます。 赤い矢印 が表示されたら、すべての買い注文を閉じます。 同様に、 赤い矢印 が表示されたら、 売り注文 を開き、 緑の矢印 が表示されたらすべての売り注文を閉じます。 取引には M5(1分足) を使用し、 どの通貨ペアでも取引可能 です。 このインジケーターは 再描画されず 、ほとんど遅延しません。ただし、 ローソク足が確定するまで待つ という自然な条件はあります。 RSI フィルター と**2 つのクラシックな反転パターン(エンゴルフィング、ピンバー)**を使用し、反転の瞬間をほぼリアルタイムで捉えます。 インジケーターの効果的な使い方 どの通貨ペアでも使用可能 (テスト済み: GBPUSD, EURUSD ) 時間足:M5(1分足) 初期資金:500ドル以上 取引ロット:0.01 緑の矢印 が表示されたら、買い注文を開く。 赤い矢印 が表示されたら、すべての買い注文を閉じる。 赤い矢印 が表示されたら、売
This indicator works on MT4 and is very easy to use. When you receive a signal from it, you wait for that candle with the signal to close and you enter your trade at the beginning of the next new candle . A red arrow means sell and a green arrow means buy. All arrows comes with Alert  like for easy identification of trade signal. Are you okay with that? 1 minute candle 1 minute expire
Using multiple timeframes for analysis with Multi Timeframe Average Directional Index  can provide several significant benefits for traders: Comprehensive Market View: By applying Mtf ADX Standard across different timeframes, traders gain a broader perspective on market dynamics. This allows them to identify trends, patterns, and potential reversal points that might be more apparent or consistent across various scales. Enhanced Pattern Recognition: Multiple timeframes help in identifying repeati
FREE
¿Has escuchado decir que la tendencia es tu amiga? pues nada es mas cierto en el mundo del trading. Este indicador analiza las tendencias y su fuerza para que puedas aprovecharlas y utilizamos un conjunto de indicadores como RSI, %W, MACD y EMAS para analizar el mercado y sus movimientos, por lo que podrás mantener tu gráfico limpio sabiendo que todos estos indicadores los tienes en uno solo. Este, como cualquier indicador, no representa una certeza de compra o venta definitiva, por lo siempre r
Overview Happy Kangaroo is a trend-following tool designed to identify market direction and provide high-probability entry signals based on volatility. By combining price action with the Average True Range (ATR), it visualize a dynamic support and resistance level of the price.     Key Features   The indicator's power lies in its customizable parameters and mathematical precision:  Dynamic Trend Detection: Uses the ATR period and factor to calculate the volatility bands. It identifies an Uptrend
[ZhiBiCCI]インディケータは全てのサイクル使用に適しており、そして全ての市場品種にも適しています。 [ZhiBiCCI]緑色の実線は強気の発散の逆転です。緑色の点線は古典的な強気の発散です。 [ZhiBiCCI]赤への実線は逆弱気の発散である。赤い点線は古典的な弱気の発散です。 [ZhiBiCCI]はパラメータ(アラート、メール送信、通知送信)で設定でき、(true)に設定するとインスタント信号をアラームウィンドウに送信し、Eメール、インスタントメッセージを送信できます。 パラメータ設定の説明 [displayAlert]:これはアラームスイッチで、trueに設定され、矢印が表示されればプロンプトに自動的に警告され、falseに設定されれば警告されません。 [sendmail_NO_OFF]:これはメールを送信するためのスイッチで、trueに設定します。矢印が表示されていればMT4で設定したメールボックスにメールを送信し、falseに設定されていればメールを送信しません。 [sendnotification_NO_OFF]:これはインスタントメッセージを送信するた
このプロダクトを購入した人は以下も購入しています
Precautions for subscribing to indicator This indicator only supports the computer version of MT4 Does not support MT5, mobile phones, tablets The indicator only shows the day's entry arrow The previous history arrow will not be displayed (Live broadcast is for demonstration) The indicator is a trading aid Is not a EA automatic trading No copy trading function The indicator only indicates the entry position No exit (target profit)  The entry stop loss point is set at 30-50 PIPS Or the front hi
Gann Made Easy は、ミスター・ギャンの理論を使用した取引の最良の原則に基づいた、プロフェッショナルで使いやすい外国為替取引システムです。 W・D・ガン。このインジケーターは、ストップロスとテイクプロフィットレベルを含む正確な買いと売りのシグナルを提供します。 PUSH通知を利用して外出先でも取引可能です。 購入後に私に連絡して、取引のヒント、ボーナス、および「GANN MADE EASY」EA アシスタントを無料で入手してください。 おそらく、ギャンの取引手法についてはすでに何度も聞いたことがあるでしょう。通常、ギャンの理論は初心者のトレーダーだけでなく、すでにある程度の取引経験がある人にとっても非常に複雑なものです。なぜなら、ギャンの取引手法は理論的にはそれほど簡単に適用できるものではないからです。私はその知識を磨き、最良の原則を私の外国為替インジケーターに組み込むために数年を費やしました。 このインジケーターは非常に簡単に適用できます。必要なのは、それをチャートに添付し、簡単な取引推奨事項に従うだけです。このインジケーターは常に市場分析の仕事を行い、取引の機会を探しま
Game Changerは、あらゆる金融商品で使用できる革新的なトレンドインジケーターです。MetaTraderを強力なトレンドアナライザーへと変貌させます。あらゆる時間枠で動作し、トレンドの特定、反転の可能性のシグナル、トレーリングストップ機能、そして迅速な市場反応のためのリアルタイムアラートを提供します。経験豊富なプロでも、優位性を求める初心者でも、このツールは自信と規律、そして根本的なトレンドダイナミクスを明確に理解した上で取引を行うための力となります。このインジケーターはリドロー機能も備えています。 購入後すぐにご連絡いただければ、個人ボーナスを進呈いたします。Strong SupportとTrend Scannerインジケーターの無料コピーを入手できます。[email protected]までプライベートメッセージを送ってください。 私のEAや特別なセットはTelegramでは販売しておりません。MQL5でのみ販売しており、セットファイルは私のブログでのみ公開しています。詐欺師にはご注意ください。他の方からセットを購入しないでください。 設定 トレンド変化時のアラート
M1 SNIPER は使いやすいトレーディングインジケーターシステムです。M1時間足向けに設計された矢印インジケーターです。M1時間足でのスキャルピングのためのスタンドアロンシステムとして、また既存のトレーディングシステムの一部としても使用できます。このトレーディングシステムはM1時間足での取引に特化して設計されていますが、他の時間足でも使用できます。元々、この手法はXAUUSDとBTCUSDの取引用に設計しましたが、他の市場においても役立つと考えています。 インジケーターのシグナルは、トレンドの方向と逆方向に取引できます。インジケーターのシグナルを利用して両方向に取引するのに役立つ特別な取引テクニックをご紹介します。この手法は、特別な動的なサポートとレジスタンスの価格帯を利用することに基づいています。 ご購入後、M1 SNIPER矢印インジケーターをすぐにダウンロードできます。さらに、M1 SNIPERツールのすべてのユーザーに、以下のスクリーンショットに表示されているApollo Dynamic SRインジケーターを無料で提供しています。この2つのインジケーターを組み合わせることで
Miraculous Indicator – ガン・スクエア・オブ・ナインに基づく100%非リペイントのFXおよびバイナリーツール この動画では、FXおよびバイナリーオプションのトレーダー向けに特別に開発された、非常に正確で強力な取引ツールである Miraculous Indicator を紹介しています。このインジケーターがユニークなのは、伝説的な ガン・スクエア・オブ・ナイン と ガンの振動の法則 に基づいている点で、現代の取引で利用できる最も正確な予測ツールの一つとなっています。 Miraculous Indicatorは 完全に非リペイント であり、ローソク足が確定した後にシグナルが変化したり消えたりすることはありません。つまり、見たものがそのまま利用できます。これにより、トレーダーは自信を持ってエントリーおよびエグジットを行うための信頼性と一貫性のある根拠を得ることができます。 主な特徴: ガン・スクエア・オブ・ナインとガン理論に基づいて構築 100%非リペイントのシグナルシステム すべての時間枠(M1、M5、H1、H4、日足、週足)で機能 FXおよびバイナリーオプション取引
Volatility Trend System - a trading system that gives signals for entries. The volatility system gives linear and point signals in the direction of the trend, as well as signals to exit it, without redrawing and delays. The trend indicator monitors the direction of the medium-term trend, shows the direction and its change. The signal indicator is based on changes in volatility and shows market entries. The indicator is equipped with several types of alerts. Can be applied to various trading ins
現在40%OFF! 初心者やエキスパートトレーダーのためのベストソリューション! このダッシュボードソフトウェアは、28の通貨ペアで動作しています。それは私達の主要な指標(高度な通貨の強さ28と高度な通貨インパルス)の2に基づいています。それは全体の外国為替市場の大きい概観を与えます。それは、すべての(9)時間枠で28の外国為替ペアのための高度な通貨の強さの値、通貨の動きの速度と信号を示しています。チャート上で1つのインディケータを使用して市場全体を観察し、トレンドやスキャルピングの機会をピンポイントで見つけることができたら、あなたのトレードがどのように改善されるか想像してみてください。 このインディケータには、強い通貨と弱い通貨の識別、潜在的な取引の識別と確認がより簡単になるような機能が搭載されています。このインディケータは、通貨の強さや弱さが増加しているか減少しているか、また、すべての時間枠でどのように機能しているかをグラフィカルに表示します。 新機能として、現在の市場環境の変化に適応するダイナミックなマーケットフィボナッチレベルが追加され、すでに当社のAdvanced
Looking for a powerful yet lightweight swing detector that accurately identifies market structure turning points? Want clear, reliable buy and sell signals that work across any timeframe and any instrument? Buy Sell Arrow MT Swing is built exactly for that — precision swing detection made simple and effective. This indicator identifies Higher Highs (HH) , Higher Lows (HL) , Lower Highs (LH) , and Lower Lows (LL) with remarkable clarity. It is designed to help traders easily visualize market str
まず第一に、この取引インジケーターは再描画されず、再描画されず、遅延しないことを強調する価値があります。これにより、手動取引とロボット取引の両方に理想的なものになります。 ユーザーマニュアル:設定、入力、戦略。 アトミックアナリストは、価格の強さとモメンタムを利用して市場でより良いエッジを見つけるためのPA価格アクションインジケーターです。ノイズや誤ったシグナルを除去し、取引ポテンシャルを高めるための高度なフィルターを備えています。複雑なインジケーターの複数のレイヤーを使用して、アトミックアナリストはチャートをスキャンし、複雑な数学的計算をシンプルなシグナルと色に変換します。これにより、どのような初心者トレーダーでも理解して使用し、一貫した取引の決定を行うことができます。 「アトミックアナリスト」は、新規および経験豊富なトレーダー向けにカスタマイズされた包括的な取引ソリューションです。プレミアムインジケーターとトップノッチの機能を1つの取引戦略に組み合わせ、すべてのタイプのトレーダーにとって汎用性のある選択肢にします。 デイリートレーディングとスキャルピング戦略:高速で正確な
An exclusive indicator that utilizes an innovative algorithm to swiftly and accurately determine the market trend. The indicator automatically calculates opening, closing, and profit levels, providing detailed trading statistics. With these features, you can choose the most appropriate trading instrument for the current market conditions. Additionally, you can easily integrate your own arrow indicators into Scalper Inside Pro to quickly evaluate their statistics and profitability. Scalper Inside
Scalper Vault は、スキャルピングを成功させるために必要なすべてを提供するプロフェッショナルなスキャルピング システムです。このインジケーターは、外国為替およびバイナリー オプションのトレーダーが使用できる完全な取引システムです。推奨される時間枠は M5 です。 システムは、トレンドの方向に正確な矢印シグナルを提供します。また、トップとボトムのシグナルとギャン マーケット レベルも提供します。 インジケーターは、プッシュ通知を含むすべてのタイプのアラートを提供します。 インジケータの購入後にご連絡ください。私の個人的な取引の推奨事項と素晴らしいボーナス指標を無料で共有します! 幸せで有益な取引をお祈りします!
"Dragon's Tail" is an integrated trading system, not just an indicator. This system analyzes each candle on a minute-by-minute basis, which is particularly effective in high market volatility conditions. The "Dragon's Tail" system identifies key market moments referred to as "bull and bear battles". Based on these "battles", the system gives trade direction recommendations. In the case of an arrow appearing on the chart, this signals the possibility of opening two trades in the indicated directi
Gold Scalper Super is an easy-to-use trading system. The indicator can be used as a standalone scalping system on the M1 time frame, as well as part of your existing trading system. Bonus: when purchasing an indicator, Trend Arrow Super is provided free of charge, write to us after purchase. The indicator 100% does not repaint!!! If a signal appears, it does not disappear! Unlike indicators with redrawing, which lead to the loss of a deposit, because they can show a signal and then remove it.
Trend indicator AI
Ramil Minniakhmetov
4.62 (81)
Trend Ai indicatorは、トレンドの識別と実用的なエントリポイントと反転アラートを組み合わせることで、トレーダーの市場分析を強化する優れたツールです。 この指標は、ユーザーが自信と正確さで外国為替市場の複雑さをナビゲートすることを可能にします トレンドAiインジケーターは、主要なシグナル以外にも、プルバックやリトレースメント中に発生するセカンダリエントリポイントを識別し、トレーダーが確立されたトレンド内の価格修正を活用できるようにします。 重要な利点: *MT4およびMT5の仕事 *明確な買いまたは売りシグナル *再描画しません ·すべての資産で動作します 私はeaやセットをtelegram it詐欺で販売しないように注意してください。 すべての設定はここでブログで無料です。  重要! 指示とボーナスを得るために購入後すぐに私に連絡してください! 私の他のプロダクトと同様、実質操作の監視はここに見つけることができます: https://www.mql5.com/en/users/mechanic/seller&nbsp ; 設定および入力: すべての
Super Signal – Skyblade Edition プロ仕様のノンリペイント / ノーラグ・トレンドシグナルシステム。卓越した勝率を実現 | MT4 / MT5 対応 1分足、5分足、15分足などの低い時間足で最も効果を発揮します。 主な特徴: Super Signal – Skyblade Edition は、トレンド取引に特化したスマートなシグナルシステムです。マルチレイヤーのフィルターロジックを用いて、明確な方向性と実際のモメンタムに支えられた強力なトレンドのみを検出します。 このシステムは 天井や底を予測するものではありません 。次の3つの条件がすべて満たされた場合にのみシグナルを発生させます: 明確なトレンド方向 モメンタムの増加 健全なボラティリティ構造 市場セッションに基づく流動性分析と組み合わせることで、シグナルの精度とタイミングがさらに向上します。 シグナルの特性: すべての矢印シグナルは 100% 非リペイント / 遅延なし 一度出現したシグナルは固定され、点滅・消失しません チャート上の矢印、情報パネル、ポップアップ通知、音声アラート、プッシュ通知
PRO Renko Systemは、特別にRENKOチャートを取引するために設計された高精度の取引システムです。 これは、様々な取引商品に適用することができる普遍的なシステムです。 システムは効果的に正確な逆転信号へのアクセスを与えるいわゆる市場の騒音を中和する。 表示器は非常に使いやすく、信号の生成に責任がある1つの変数だけがあります。 あなたは簡単にお好みの任意の取引ツールとレンコバーのサイズにツールを適応させることができます。 私はいつもあなたが私のソフトウェアで収益性の高い取引を支援するために余分なサポートを提供する準備ができています! 私はあなたに幸せで収益性の高い取引をしたいです! ご購入後にご連絡ください! 私はあなたに私のレンコチャートジェネレータを送信します。 私はまた、私の個人的な推奨事項やシステムの他のモジュールを無料で共有します!
FX Power: 通貨の強弱を分析して、より賢い取引を実現 概要 FX Power は主要通貨と金の実際の強弱をあらゆる市場状況で理解するための必須ツールです。強い通貨を買い、弱い通貨を売ることで、 FX Power は取引の意思決定を簡素化し、高い確率の取引機会を見出します。トレンドを追従する場合でも、極端なデルタ値を使用して反転を予測する場合でも、このツールはあなたの取引スタイルに完全に適応します。ただ取引するだけではなく、 FX Power で賢く取引をしましょう。 1. なぜ FX Power がトレーダーにとって非常に有益なのか 通貨と金のリアルタイム強弱分析 • FX Power は主要通貨と金の相対的な強弱を計算し、マーケットダイナミクスに関する明確な洞察を提供します。 • どの資産がリードしているか、または後れを取っているかを監視して、取引するペアを賢く選びましょう。 マルチタイムフレームの包括的なビュー • 短期、中期、長期のタイムフレームで通貨と金の強弱を追跡し、マーケットトレンドに基づいて取引戦略を調整できます。 • スキャルピングからスイングトレード
Pulse Scalping Line - an indicator for identifying potential pivot points. Based on this indicator, you can build an effective Martingale system. According to our statistics, the indicator gives a maximum of 4 erroneous pivot points in a series. On average, these are 2 pivot points. That is, the indicator shows a reversal, it is erroneous. This means that the second signal of the indicator will be highly accurate. Based on this information, you can build a trading system based on the Martingale
MetaForecast M4
Vahidreza Heidar Gholami
5 (2)
MetaForecastは、価格データのハーモニクスに基づいて、どんな市場の未来を予測し視覚化します。市場が常に予測可能ではありませんが、価格にパターンがある場合、MetaForecastは可能な限り正確な未来を予測できます。他の類似製品と比較して、MetaForecastは市場のトレンドを分析することでより正確な結果を生成することができます。 入力パラメータ Past size (過去のサイズ) MetaForecastが将来の予測を生成するために使用するバーの数を指定します。モデルは選択したバー上に描かれた黄色の線で表されます。 Future size (将来のサイズ) 予測すべき将来のバーの数を指定します。予測された将来は、ピンクの線で表示され、その上に青い回帰線が描かれます。 Degree (程度) この入力は、MetaForecastが市場で行う分析のレベルを決定します。 Degree 説明  0 Degree 0の場合、価格の全てのピークや谷、そして詳細をカバーするために、「Past size」の入力に大きな値を使用することが推奨されています。  1 (推奨) Degre
チャートを構成し、周期的な価格変動を識別するテクニカル指標。 どのチャートでも動作します。 いくつかの種類の通知。 グラフ自体に追加の矢印があります。 履歴を再描画せずに、キャンドルのクローズに取り組みます。 M5以上のTFを推奨します。 パラメータの使用と設定が簡単です。 異なるパラメータを持つ 2 つのインジケーターを使用する場合、他のインジケーターなしで使用できます。 入力パラメータは2つあります 周期性と信号持続時間 これら 2 つのパラメータは、チャート構造の処理を扱います。 Cyclicity - 反転サイクルが変化する頻度を調整し、サイクルを滑らかにします。 Signal duration - 最小数では価格変動の衝動を検出し、最大数では長期的なトレンドの動きを検出します。
通貨強さウィザードは、取引を成功させるためのオールインワン ソリューションを提供する非常に強力な指標です。このインジケーターは、複数の時間枠のすべての通貨のデータを使用して、このまたはその外国為替ペアのパワーを計算します。このデータは、使いやすい通貨インデックスと通貨パワーラインの形式で表され、特定の通貨のパワーを確認するために使用できます。 必要なのは、取引したいチャートにインジケーターを接続することだけです。インジケーターは、取引する通貨の実際の強さを示します。このインジケーターは、トレンドに合わせて取引するときに有利に利用できる売買高の圧力の極値も示します。このインジケーターには、フィボナッチに基づく可能なターゲットも表示されます。 このインジケーターは、PUSH 通知を含むあらゆるタイプのアラートを提供します。 購入後ご連絡下さい。私の取引のヒントをあなたと共有し、素晴らしいボーナスインジケーターを無料で提供します! 幸せで有益な取引をお祈りします。
Apollo SR Master は、サポート/レジスタンスゾーンを利用した取引をより容易かつ確実にする特別な機能を備えたサポート/レジスタンスインジケーターです。このインジケーターは、ローカル価格の高値と安値を検出することで、タイムラグなしでリアルタイムにサポート/レジスタンスゾーンを計算します。そして、新たに形成されたSRゾーンを確認するために、インジケーターは特別なシグナルを表示します。このシグナルは、SRゾーンを実際の売りまたは買いシグナルとして考慮して使用できることを示します。この場合、SRゾーンの強度が高まり、SRエリアからの取引が成功する確率も高まります。これがこのインジケーターの基本的な考え方です。 SRゾーンは、ストップロスとテイクプロフィットの設定を容易にします。シグナルの方向に応じて、SRゾーンの上または下のスペースをストップロスとして設定できます。さらに、反対側のSRゾーンは、潜在的なテイクプロフィットエリアとして設定できます。 また、Apollo SRマスターインジケーターをご利用のすべてのユーザーには、「Apollo Price Action System」
Introducing a powerful, precision-engineered indicator that seamlessly combines Pivot Points, Moving Averages, and Multi-Timeframe Analysis to deliver high-probability Buy and Sell signals in real-time. This tool is your strategic edge, designed to identify trend reversals, market momentum, and optimal trade entries, no matter your preferred trading style. Our algorithm goes beyond standard indicators—by analyzing multiple timeframes simultaneously, it spots true market turning points while fi
M1 Arrow
Oleg Rodin
4.81 (21)
市場の2つの基本原則に基づく日中戦略。 このアルゴリズムは、追加のフィルターを使用したボリュームと価格の波の分析に基づいています。インディケータのインテリジェントアルゴリズムは、2つの市場要因が1つに結合した場合にのみシグナルを出します。インディケータは、より高い時間枠のデータを使用して、M1チャート上の特定の範囲の波を計算します。そして波を確認するために、インジケーターはボリュームによる分析を使用します。 このインディケータはレディトレーディングシステムです。トレーダーが必要とするのは、信号に従うことだけです。また、インジケーターはあなた自身の取引システムの基礎になることができます。取引はミニッツチャートでのみ行われます。 インジケーターがMTFの原則を使用しているという事実にもかかわらず、インジケーターのアルゴリズムは可能な限り安定しています。 購入後、必ず私に書いてください!私の取引設定と推奨事項をあなたと共有します!
このインジケーターは、反転ポイントと価格戻りゾーンを正確に表示します。     主要プレーヤー 。新たなトレンドが形成される場所を把握し、最大限の精度で意思決定を行い、すべての取引をコントロールします。 TREND LINES PRO インジケーターと組み合わせることで、その潜在能力を最大限に発揮します。 VERSION MT5 インジケーターが示す内容: 新しいトレンドの始まりに活性化する反転構造と反転レベル。 リスクと報酬の比率を最小限に抑えた利益 確定 と 損失停止の レベルの表示     RR 1:2   。 インテリジェントな削減ロジックによるストップロス。 指定されたインジケーターから 2 つのトレンド タイプの反転パターンを表示します。 指標: トレンドを追う   TREND LINES PRO   (世界的なトレンドの変化) TREND PRO   (クイックトレンド変更) シンプルで効果的   スキャナー   リアルタイムトレンド(新機能)。 マルチタイムフレームのインストゥルメント フィルタリング。 画面   利益     LOGIC AI信号の後。 当日プラス方
Meravith
Ivan Stefanov
5 (3)
マーケットメーカーのためのツール。 Meravith は次の機能を提供します: すべての時間足を分析し、現在有効なトレンドを表示します。 強気と弱気の出来高が等しくなる流動性ゾーン(出来高均衡)を強調表示します。 異なる時間足のすべての流動性レベルをチャート上に直接表示します。 テキスト形式の市場分析を生成し、参考情報として表示します。 現在のトレンドに基づいて目標値、サポートレベル、ストップロスを計算します。 取引のリスクリワード比を算出します。 口座残高に基づいてポジションサイズを計算し、潜在的な利益を推定します。 また、市場に大きな変化があった場合には警告を表示します。 インジケーターの主要ライン: 強気/弱気の出来高エグゾーストライン ― 目標値として機能します。 市場のトレンドを示すライン。市場が強気か弱気かによって色が変わり、トレンドのサポートとして機能します。主にその色が市場センチメントを示します。 出来高均衡ライン(Eq)。Eq(Volume Equilibrium)ラインはシステムの中核です。これは買い手と売り手の出来高のバランスポイントを表します。市場の流動性を示し
First 25 copies at $80, after that price becomes $149 (3 copies left) Gold Signal Pro is a powerful MT4 indicator designed to help traders spot strong price reactions in the market. It focuses on clear wick rejections , showing when price strongly rejects a level and often continues in the same direction. Gold Signal Pro is mainly built for scalping gold (XAUUSD) and works best on lower timeframes like M5 and M15 , where timing matters most. That said, it can also be used on any forex pair, a
OFFER OFFER! The price of the indicator is kept at 75 dollars only from 20th Feb to 28th Feb. Full Fledged EA and Alert plus for alerts will also be provided in this offer along with the purchase of Indicator. Limited copies only at this price and Ea too. Grab your copy soon Alert plus for indicator with set file is kept in comment section with the image  SMC Blast Signal with FVG, BOS and trend Breakout The SMC Blast Signal is a Precise trading system for Meta Trader 4 that uses Smart Money Con
デイトレーダーマスターは、デイトレーダーのための完全なトレーディングシステムです。システムは2つのインジケーターで構成されています。 1つの指標は売買する矢印信号です。それはあなたが得る矢印インジケーターです。 2つ目のインジケーターを無料で提供します。 2番目のインジケーターは、これらの矢印と組み合わせて使用​​するために特別に設計されたトレンドインジケーターです。 インジケーターは繰り返さず、遅れないでください! このシステムの使用は非常に簡単です。 2色の線で表示されている現在のトレンドの方向に矢印信号をたどる必要があります。青は買いの傾向です。赤い色は売りの傾向です。青い矢印は買いシグナルです。赤い矢印は売りの合図です。トレンドラインの色と一致するように、矢印の色と信号の方向が必要です。 矢印インジケーターは、主に時間間隔M5とM15での日中取引のために作成されました。ただし、技術的には、システムは他の時間間隔で使用できます。 インジケータには、PUSHメッセージ機能を備えたポップアップアラートが装備されています。 購入後、必ず私に書いてください!私はあなたにシステムとの取引の
SHOGUN Trade - 16年間無調整の衝撃。戦略的市場構造と損小利大の極意 2月スペシャルセール – 特別価格 $88(通常価格 $199)! Click here for the MT5 version   https://www.mql5.com/ja/market/product/160183 これが最新のリリースです。 https://www.mql5.com/ja/market/product/165983   この特別オファーは 2月28日 までの期間限定です。 私たちは現在、 さらなる製品開発と最適化 に注力しております。皆様からの貴重なフィードバックを製品に反映させるため、レビューへのご協力を条件にこの割引価格で提供させていただきます。皆様からいただくご意見は、次回のアップデートや新機能の追加に直接活用させていただきます。 開発者も戦慄した「16年間」の真実 まず、添付した画像(バックテスト結果)をご覧ください。これはUSDJPY H1における、**2010年1月1日から2026年1月1日までの「丸16年間」**の検証結果です。 これはEA(自動売買
フィルタ:
レビューなし
レビューに返信