Candle Timer Countdown MT4
- インディケータ
- バージョン: 1.10
- アップデート済み: 3 5月 2021

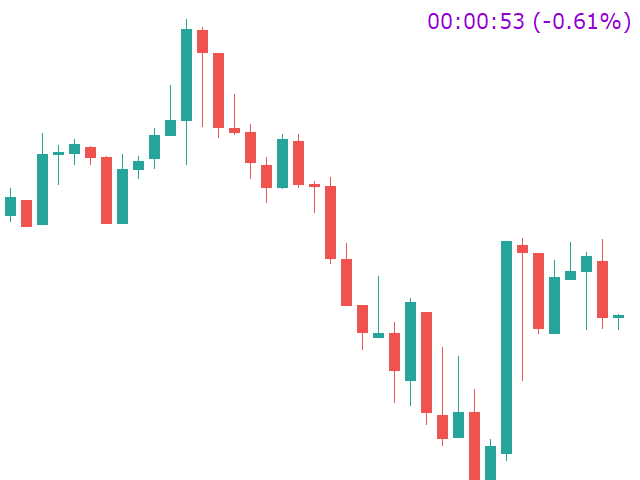
キャンドルタイマーカウントダウンは、現在のバーが閉じて新しいバーが形成されるまでの残り時間を表示します。 時間管理に使用できます。
機能のハイライト
- 現地時間ではなくサーバー時間を追跡します
- 構成可能なテキストの色とフォントサイズ
- シンボルの日次変動のオプションの視覚化
- CPU使用率を削減するために最適化
入力パラメータ
- 毎日の変化を表示:true / false
- テキストフォントサイズ
- テキストの色


Cumple perfectamente la función.