Broken Trends

4.5

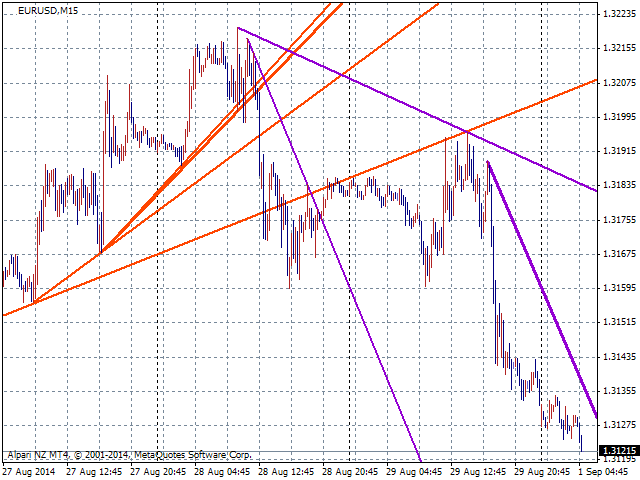
Broken Trends is an indicator for scalpers and intraday traders. The indicator selects and displays trend levels on the chart in the real time mode. The indicator reacts to price momentum: it starts searching for the trends as soon as the momentum amplitude exceeds the threshold set in a special parameter. The indicator can also play a sound when the price crosses the current trend line. In normal mode, the indicator shows only one (last found) upward and one downward trend, but there is an advanced mode - the previously detected trends are also drawn on the chart.

Keep in mind that the Broken Trends indicator does not produce complete decisions. It just does the dirty work, showing the possible options. It is the trader who should decide.


The indicator parameters:

  • ExtMode - enables/disables the advanced mode; 
  • Sound - enables/disables sound notification when the price crosses the current trend line;  
  • UTColor - sets the line color of the uptrend; 
  • DTColor - sets the line color of the downtrend; 
  • HistoryDepth - sets the depth of the used history, 0 - the entire history;
  • Rank - sets the search rank;
  • PulseThr - sets the threshold momentum amplitude in points.
レビュー 5
Pealres Lukinskas
215
Pealres Lukinskas 2017.12.30 05:57 
 

Really Good. One of the best auto trendlines calculator in the market and its free. Many thanks to the developer

おすすめのプロダクト
This semaphore indicator is based in the standard RSI, which is applied over the Envelopes indicator that shows an envelope or envelope fluctuation borders. This is a version of RSI vs Envelopes drawn in the symbol window . A sell signal emerges when the upper envelope/border is broken by the RSI indicator from top to bottom. A buy signal emerges when the lower envelope/border is broken by the RSI indicator from bottom upwards. The indicator can draw arrows on the indicator, draw vertical lines
FREE
このインジケーターは有名なフラクタルインジケーターに基づいていますが、多くのカスタマイズ と柔軟性があり、 これは、トレンドの反転を特定し、潜在的な利益を最大化するための強力なツールです。 高度な機能とユーザーフレンドリーなインターフェイスを備えた、あらゆるレベルのトレーダーにとって究極の選択肢です。 MT5 バージョン :   Ultimate Fractals MT5 特徴 : カスタマイズ可能なフラクタル キャンドルの数。 反転ライン。 カスタマイズ可能な設定。 ユーザーフレンドリーなインターフェイス。 主なパラメータ: 左側のキャンドル - フラクタルを形成する左側のバーの数。 Candle On Right - フラクタルの右側のバーの数。 市場の不確実性によって行動を妨げないようにしてください。 「究極のフラクタル」インジケーターでトレーディング ゲームをレベルアップさせましょう。 このツールを利用して自信を持って意思決定を行い、財務目標を達成する成功したトレーダーの仲間入りをしましょう。 特定の「Ultimate Fractals MT4」インジケーターの独自の機
FREE
APriceChannel is a modification of the standard Price_Channel indicator. The EA draws 2 levels - the upper level shows the price High for the specified period of time, the lower level shows the price Low for the same period. In addition to the period, you can set vertical offset in points to widen the channel up and down. This prevents false breakouts of current support/resistance levels. Inputs Period - time period in bars - the number of bars to calculate the price High/Low. Offset up and dow
FREE
クオンツ移動平均勾配は、方向性と勢いを与える非常に強力な指標です。 インジケーターは塗り直しではありません。ma角度を効率的に計算してトレンドを見つけることができます。 シグナルキャンドルが閉じられると、利益カウントが始まります。 したがって、ライブで行われるのは正確な結果です。 提案されたTimeFrameはH1でそれを使用しています。 インジケーターのすべてのオプションは編集可能です。 ヒント:トレードスイングとトレンドブレイクアウトの方向。 フラクタル、練行足、ボリンジャーバンドは、精度と収益性を向上させることができます。 高低は、角度線の発散アプローチを使用して見つかる可能性があります。 このインジケータは、サポート抵抗、供給需要インジケータの追加確認として使用できます。 Ma勾配情報は、トレンドの方向と出口点を使用して入力するのに非常に役立ちます。 それは外国為替、株式、インデックスのために働きます。 PushNotifications / Email / SoundAlerts / PopUpAlertsでアラートを受け取ることができます。 改善が必要な場合はい
FREE
Cosmic Candles
Pieter Gerhardus Van Zyl
Check out my German Pro Signal - https://www.mql5.com/en/signals/2354346 Cosmic Candles   is an advanced price-action visualization tool that transforms ordinary candles into a dynamic, color-coded map of market energy. Instead of relying on traditional indicators in a separate window, it enhances the main chart itself—classifying each candle into one of four distinct “cosmic states” that reflect underlying momentum pressure and trend intensity. Each candle is painted in a specific color theme:
Special offer : ALL TOOLS , just $35 each! New tools   will be   $30   for the   first week   or the   first 3 purchases !  Trading Tools Channel on MQL5 : Join my MQL5 channel to update the latest news from me SuperTrend by Kivanc Ozbilgic with Scanner をご紹介します。これは、マーケットトレンドに先んじるための多機能で強力なツールで、カスタマイズ可能な機能とリアルタイムのアラートが備わっています ATR の計算方法は、柔軟に対応するために RMA (相対移動平均)と SMA (単純移動平均)から選べます。デフォルト設定では、 ATR 期間が10、乗数が3に設定されており、 SuperTrend は効率的に買いと売りのシグナルを識別します。 組み込みのスキャナーとアラートシステムは、複数の通貨ペアやタイムフレームを監視し、リアルタイムの
FREE
The Commitments of Traders Ratio Indicator is one of these things you never thought about it before you really see the magic behind it. The indicator shows the Ratio of long/short positions released by the CFTC once a week. If you have a look on the Sreenshot you can see two (three) zones of interest. Zone 1: The Switches (Red -> Green, Green -> Red) Zone 2: MA cross Zone 3: If you combine this with the COX indicator an additional zone will appear. You also can experiment with Ratio crossing MA
FREE
This indicator is a tool to measure the relative strength of different currency pairs. It present major currencies strength value base on their relative strength/weakness in custom period of time. Indicator parameters Strength Period - Change the strength period in the settings affects the number of bars used for calculation. The higher the period value, the smoother the indicator lines and the result will represent longer term strength of each currencies, rather than recent strength. Display O
FREE
RCCMA is a general moving average indicator that works with ReviewCandleChart. Original is "Custom Moving Average" provided by MetaQuotes Software Corp. Based on that source code, I corresponded to ReviewCandleChart . Advantages When ReviewCandleChart is ON, no line will be displayed on the right side from the vertical reference line. When ReviewCandleChart is ON and you press a key such as "Z" or "X" Following that, the MA is drawn. When ReviewCandleChart is OFF, the same drawing as the origin
FREE
QualifiedEngulfing - は ProEngulfing インジケーターの無料版です。 ProEngulfing - は Advance Engulf インジケーターの有料版で、 こちらからダウンロードできます。 ProEngulfing の無料版と有料版の違いは何ですか?無料版は1日に1つのシグナルの制限があります。 QualifiedEngulfingをご紹介します - あなたのMT4用のプロフェッショナルエンゴルフパターンインジケーター Precisionの力を解放して、QualifiedEngulfingを使用して外国為替市場での資格のあるエンゴルフパターンを特定および強調する先進的なインジケーターです。MetaTrader 4用に開発されたQualifiedEngulfingは、外国為替市場のエンゴルフパターンを確認およびハイライトするために設計された切り立ったアプローチを提供し、取引の決定に対して最も信頼性の高いシグナルのみを受け取ることを確認します。 QualifiedEngulfingの動作方法: QualifiedEngulfingは、エンゴルフパター
FREE
The Fair Value Gap (FVG) is a price range where one side of the market liquidity is offered, typically confirmed by a liquidity void on the lower time frame charts in the same price range. Price can "gap" to create a literal vacuum in trading, resulting in an actual price gap. Fair Value Gaps are most commonly used by price action traders to identify inefficiencies or imbalances in the market, indicating that buying and selling are not equal. If you're following the ICT Trading Strategy or Smart
FREE
An improved version of the standard Standard Deviation indicator. It is now a responsive and smoothed line. The setup is not straightforward - but I hope you can do it. It is very easy to understand the readings of this indicator, the meaning is the same as that of the usual Standard Deviation. //////////////////////////////////////////////// /////////////////////////////////// I hope this indicator will be very useful to you in successful trading. Good luck.
FREE
Indicator : Forex Reversal Trend  The indicator helps investors to identify the earliest and perfect reversal point. Easy to make decision to trade with the trend Price action trading. support resistance and market trends. By technical analysis, the robot creates a short-term strategy to determine the most optimal entry position. Version PRO:  https://www.mql5.com/en/market/product/70867 Telegram: https://t.me/tForexSniper
FREE
............................................hi................................................ .........................its a simple indicator of movings ............................ .........................a diffrent show of moving averages.......................... ...............can select period , shift , mode and applied price.................. ............many traders use movings for find market movement................. ...........................it can helpfull for finding trends.......
FREE
TSO Moving Average Slope
Dionisis Nikolopoulos
3.67 (3)
The Moving Average Slope (MAS) subtracts the moving average level n-periods ago from the current moving average level. This way, the trend of the moving average can be drawn on the moving average line. Features Observe uptrends and downtrends at a glance. The indicator is non-repainting. Returns buffer values for the trend of the moving average to be used as part of an EA. (see below) Inputs Moving Average Period : The period of the moving average (MA). Slope Period : Number of periods between
FREE
Delta AG Free
Yurij Kozhevnikov
5 (2)
The difference between the arithmetic and geometric means at the specified range. Since the greater is the difference between the values, the greater the resulting figure is, actually the indicator shows volatility fluctuations. The arithmetic mean of a certain number of values ​​is the sum of the values ​​divided by their number. The geometric mean is the root of the power of the number of values ​​extracted from the product of these values. If all values ​​are equal, the arithmetic mean and th
FREE
The indicator draws two simple moving averages using High and Low prices. The MA_High line is displayed when the moving average is directed downwards. It can be used for setting a stop order for a sell position. The MA_Low line is displayed when the moving average is directed upwards. It can be used for setting a stop order for a buy position. The indicator is used in the TrailingStop Expert Advisor. Parameters Period - period of calculation of the moving average. Deviation - rate of convergence
FREE
This indicator allows to hide Stochastic  oscillator  (on all MT4 timeframes) from a date define by the user, with a vertical line (Alone) or a panel (with "Hidden Candles"). Indicator Inputs: % K Period % D Period  Slowing Apply To Method Information on "Stochastic Oscillator" indicator is available here:   https://www.metatrader4.com/en/trading-platform/help/analytics/tech_indicators/stochastic_oscillator ************************************************************* Hey traders!!  Give me your
FREE
TradeDashboard Comprehensive MT4 Indicator for Trade Visualization and Analysis Overview TradeDashboard is a powerful MetaTrader 4 indicator designed to enhance your trading experience by providing real-time visualization of take-profit levels for all open positions. This advanced tool goes beyond basic TP indicators by displaying comprehensive metrics including potential profits, losses, and total lot sizes, all directly on your chart. Key Features Take-Profit Visualization : Clearly displays h
FREE
Special offer : ALL TOOLS , just $35 each! New tools   will be   $30   for the   first week   or the   first 3 purchases !  Trading Tools Channel on MQL5 : Join my MQL5 channel to update the latest news from me Supertrend Fakeout インジケーターは、従来の Supertrend インジケーターを改良したバージョンで、より信頼性の高いトレンドシグナルを提供することを目的としています。 Fakeout Index Limit や Fakeout ATR Mult といった高度な機能を取り入れることで、このインジケーターは短期的な価格変動や市場ノイズによって引き起こされる誤ったトレンド反転をフィルタリングするのに役立ちます。 MT5バージョンを見る:  Supertrend Fakeout MT5 その他の製品を見る:   すべての製品 動作の仕組み Supertr
FREE
AW Flexible Fractals
AW Trading Software Limited
4 (5)
指標はフラクタルの価格構造を分析し、市場ダイナミクスの可能な反転ポイントを識別します。他のタイプのインジケーターと組み合わせて使用すると最適です。 利点: すべての機器と時系列で動作し、 結果を再描画しません、 インジケーター要素のカスタマイズ可能な色、 トレンド戦略とうまく連携し、 フラクタルの強さを調整します。 MT5 version -> HERE / Our news ->  HERE Strategy: AW Flexible Fractals   is an indicator that indicates signals not instantly, but with a delay, due to the structure of the fractal.       To detect a signal in the " Number of candles on each side of the fractal " variable, you can adjust the number of bars on each side       from the
FREE
Basic Supply Demand
Mehran Sepah Mansoor
4.33 (3)
基本的な需給インジケータは、あなたの市場分析を強化し、あらゆるチャート上の重要な機会領域を特定するために設計された強力なツールです。直感的で使いやすいインターフェイスで、この無料のメタトレーダー用インディケータは、需給ゾーンを明確に表示し、より多くの情報に基づいた正確な取引判断を可能にします /  MT5無料版 この指標のダッシュボードスキャナー: ( Basic Supply Demand Dashboard ) 特徴 チャートの需給ゾーンを自動的にスキャンし、面倒な手動分析を不要にします。 直近の需給ゾーンまでの残り距離をグラフィカルに表示 供給ゾーンは特徴的な色で強調表示され、需要ゾーンは別の色で表示されるため、迅速かつ正確な解釈が可能。 このインディケータは、最も近い供給ゾーンまたは需要ゾーンとチャート上の現在価格との距離をpips単位で自動的に計算し、明確かつ定量的な指標を提供します。pips単位の距離はチャート上にはっきりと見やすく表示され、現在価 格との距離が大きい、または小さいエリアを素早く特定できます。 需給ゾーンの接近やブレイクを警告 どのタイムフレームでも機
FREE
Schaff Trend Cycleとは Schaff Trend Cycle(STC)は、トレンドの転換点をタイムリーに捉えるために設計されたオシレーター系インジケーターです。従来の移動平均やMACDと比較して、サイクル的な動きとモメンタムを組み合わせることで、トレンドの始まりと終わりをより明確に把握できます。 主な特徴 トレンド転換シグナルの明確化:上昇トレンドではサイクルラインが上向きに、下降トレンドでは下向きに推移します。 レンジ相場でのだましを抑制:サイクル周期を考慮した平滑化処理により、短期的なノイズを減少させます。 パラメーター調整が容易:期間や平滑化係数を変更するだけで、動作感度を初心者から上級者まで幅広く調整可能です。 計算ロジック概要 モメンタムの算出 指定期間の価格変化をもとに、短期および長期のモメンタムを計算します。 サイクル平滑化 モメンタムに対し、二重平滑化(ダブル・スムージング)を適用し、サイクル的な振動成分を抽出します。 正規化処理 0~100の範囲に正規化し、オシレーターとして表示します。 シグナル生成 水平ライン(通常は25と75)を上下に抜
FREE
The ' Average OHLC ZigZag ' indicator was designed for entry confirmations as well as scalping with a larger trend. A custom formula to average the last two bars to generate arrows following market trends with bar 1 confirmation. Key Features An extreme scalper calculating the averages between the last two market periods to generate a buy or sell arrow. No settings are available due to it's simplicity of custom price action pattern and using repainting four OHLC prices.  Input Parameters ZigZa
FREE
Note: this product is a free limited version of the full featured product Currency Timeframe Strength Matrix . It only includes AUD, CAD, CHF currencies instead of all 8 currencies. It includes only 5S, 1M, 5M time frames instead of all 8 (5S, 1M, 5M, 15M, 30M, 1H, 4H, 1D). What is it? The Currency TimeFrame Strength Matrix is a simple and comprehensive Forex map that gives a snapshot of what is happening in the Forex market at the very present time. It illustrates the strength and momentum ch
FREE
AW Super Trend
AW Trading Software Limited
3.67 (3)
AW スーパー トレンド - これは、最も人気のある古典的なトレンド インジケーターの 1 つです。シンプルな設定で、トレンドだけでなく、このインジケーターによって計算されるストップ ロス レベルも表示できます。 利点: 楽器:     通貨ペア 、株、商品、指数、暗号通貨。 時間枠: М15 以上。 取引時間:24時間。 現在のトレンドの方向を示します。 ストップロスを計算します。 取引を行うときに使用できます。 3 種類の通知: プッシュ、メール、アラート。 MT5版→   こちら / お知らせ     ->   こちら 機能: - インジケーターは、現在のトレンド方向を対応する色で表示します。 - 青色は、現在の時間枠で使用されているシンボルの上昇トレンドを示します。 - 線の赤い色は、選択したシンボルで使用された時間枠の下降トレンドを示します。 インディケータはストップロスを設定するために使用できます。 指標線はバーの上ではなく、バーに対していくらかシフトして表示されます。トレンド ラインが表示されるこの場所は、トレーダーがストップ ロスを設定するために使用できます。 トレ
FREE
A simple but effective helper that will allow you to track both global and local market trends. The indicator combines the work of two oscillators: Stochastic and RSI. Both indicators can be set to any timeframe. Advantages of Use Multitimeframe - you can adjust both indicators to the desired timeframes. To obtain the entry points, you can use the Elder's triple screen system. Highly customizable - you can configure not only the parameters of the indicators, but also their appearance (color and
FREE
MA Cloud mt4
Alexander Chertnik
4 (2)
Moving Average Cloud draws 4 MAs on chart simultaneously in histogram style. Indicator uses 4 MAs: slow sma & ema 200 and fast sma & ema 50. the range between 2 slows MAs and Fasts, represented by histograms on the MAs boundaries - creating kind of "cloud" that can be traded by all kind of MA strategies like support & resistance or other... Change of color of the same histogram points to momentum changing. Combined with other market analysis, can greatly improve trading results.
FREE
The product   Divergence Cci Force Stddev Ac Atr   is designed to find the differences between indicators and price. It allows you to open orders or set trends using these differences. The indicator has 4 different divergence features. Divergence types Class A Divergence Class B Divergence Class C Divergence Hidden Divergence Product Features and Rec ommendations There are 5 indicators on the indicator Indicators =   CCI, Force, Stdandard Deviation, Acelereator, Atr 4 different divergence type
FREE
Индикатор Adapter определяет господствующую тенденцию, помогает анализировать рынок на выбранном временном интервале. Прост в настройке и работает на всех парах и всех временных интервалах. Индикаторы тренда дают возможность классифицировать направление ценового движения, определив его силу. Решение этой проблемы помогает инвесторам вовремя войти в рынок и получить хорошую отдачу. Для любого трейдера крайне важно правильно определить направление и силу трендового движения. К сожалению, единств
このプロダクトを購入した人は以下も購入しています
Gann Made Easy は、ミスター・ギャンの理論を使用した取引の最良の原則に基づいた、プロフェッショナルで使いやすい外国為替取引システムです。 W・D・ガン。このインジケーターは、ストップロスとテイクプロフィットレベルを含む正確な買いと売りのシグナルを提供します。 PUSH通知を利用して外出先でも取引可能です。 購入後に私に連絡して、取引のヒント、ボーナス、および「GANN MADE EASY」EA アシスタントを無料で入手してください。 おそらく、ギャンの取引手法についてはすでに何度も聞いたことがあるでしょう。通常、ギャンの理論は初心者のトレーダーだけでなく、すでにある程度の取引経験がある人にとっても非常に複雑なものです。なぜなら、ギャンの取引手法は理論的にはそれほど簡単に適用できるものではないからです。私はその知識を磨き、最良の原則を私の外国為替インジケーターに組み込むために数年を費やしました。 このインジケーターは非常に簡単に適用できます。必要なのは、それをチャートに添付し、簡単な取引推奨事項に従うだけです。このインジケーターは常に市場分析の仕事を行い、取引の機会を探しま
M1 SNIPER は使いやすいトレーディングインジケーターシステムです。M1時間足向けに設計された矢印インジケーターです。M1時間足でのスキャルピングのためのスタンドアロンシステムとして、また既存のトレーディングシステムの一部としても使用できます。このトレーディングシステムはM1時間足での取引に特化して設計されていますが、他の時間足でも使用できます。元々、この手法はXAUUSDとBTCUSDの取引用に設計しましたが、他の市場においても役立つと考えています。 インジケーターのシグナルは、トレンドの方向と逆方向に取引できます。インジケーターのシグナルを利用して両方向に取引するのに役立つ特別な取引テクニックをご紹介します。この手法は、特別な動的なサポートとレジスタンスの価格帯を利用することに基づいています。 ご購入後、M1 SNIPER矢印インジケーターをすぐにダウンロードできます。さらに、M1 SNIPERツールのすべてのユーザーに、以下のスクリーンショットに表示されているApollo Dynamic SRインジケーターを無料で提供しています。この2つのインジケーターを組み合わせることで
An exclusive indicator that utilizes an innovative algorithm to swiftly and accurately determine the market trend. The indicator automatically calculates opening, closing, and profit levels, providing detailed trading statistics. With these features, you can choose the most appropriate trading instrument for the current market conditions. Additionally, you can easily integrate your own arrow indicators into Scalper Inside Pro to quickly evaluate their statistics and profitability. Scalper Inside
Game Changerは、あらゆる金融商品で使用できる革新的なトレンドインジケーターです。MetaTraderを強力なトレンドアナライザーへと変貌させます。あらゆる時間枠で動作し、トレンドの特定、反転の可能性のシグナル、トレーリングストップ機能、そして迅速な市場反応のためのリアルタイムアラートを提供します。経験豊富なプロでも、優位性を求める初心者でも、このツールは自信と規律、そして根本的なトレンドダイナミクスを明確に理解した上で取引を行うための力となります。このインジケーターはリドロー機能も備えています。 購入後すぐにご連絡いただければ、個人ボーナスを進呈いたします。Strong SupportとTrend Scannerインジケーターの無料コピーを入手できます。[email protected]までプライベートメッセージを送ってください。 私のEAや特別なセットはTelegramでは販売しておりません。MQL5でのみ販売しており、セットファイルは私のブログでのみ公開しています。詐欺師にはご注意ください。他の方からセットを購入しないでください。 設定 トレンド変化時のアラート
Dynamic Forex28 Navigator - 次世代の Forex 取引ツール。 現在 49% オフ。 Dynamic Forex28 Navigator は、長年人気のインジケーターを進化させたもので、3 つの機能を 1 つにまとめています。 Advanced Currency Strength28 インジケーター (レビュー 695 件)  + Advanced Currency IMPULSE with ALERT (レビュー 520 件) + CS28 コンボ シグナル (ボーナス)。 インジケーターの詳細 https://www.mql5.com/en/blogs/post/758844 次世代の Strength インジケーターが提供するもの  オリジナルで気に入っていたすべての機能が、新機能と精度の向上によって強化されました。 主な機能: 独自の通貨強度計算式。 すべての時間枠でスムーズかつ正確な強度ライン。 トレンドの特定と正確なエントリーに最適です。 ダイナミックマーケットフィボナッチレベル (マーケットフィボナッチ)。 このインジケーターに固有
Precautions for subscribing to indicator This indicator only supports the computer version of MT4 Does not support MT5, mobile phones, tablets The indicator only shows the day's entry arrow The previous history arrow will not be displayed (Live broadcast is for demonstration) The indicator is a trading aid Is not a EA automatic trading No copy trading function The indicator only indicates the entry position No exit (target profit)  The entry stop loss point is set at 30-50 PIPS Or the front hi
Volatility Trend System - a trading system that gives signals for entries. The volatility system gives linear and point signals in the direction of the trend, as well as signals to exit it, without redrawing and delays. The trend indicator monitors the direction of the medium-term trend, shows the direction and its change. The signal indicator is based on changes in volatility and shows market entries. The indicator is equipped with several types of alerts. Can be applied to various trading ins
Trend Screener
STE S.S.COMPANY
4.79 (95)
トレンドインジケーター、1つのツールに組み込まれたすべての重要なトレンド機能を備えたトレンドトレーディングとフィルタリングのための画期的なユニークなソリューション! これは、すべてのシンボル/商品(外国為替、商品、暗号通貨、インデックス、株式)で使用できる100%再描画されていないマルチタイムフレームおよびマルチ通貨インジケーターです。 期間限定オファー: サポートおよびレジスタンス スクリーナー インジケーターは、たった 50 ドルで永久的にご利用いただけます。(元の価格 250 ドル) (オファー延長) トレンドスクリーナーは、チャート内のドットで矢印トレンドシグナルを提供するインジケーターに続く効率的なインジケーターです。 トレンド分析インジケーターで使用できる機能: 1.トレンドスキャナー。 2.最大利益分析を備えたトレンドライン。 3.トレンド通貨強度メーター。 4.アラート付きのトレンド反転ドット。 5.アラート付きの強いトレンドドット。 6.トレンド矢印 毎日の分析例、毎日のシグナルパフォーマンス...など、トレンドスクリーナーインジケーターを使用して、ここで見つけること
No Repaint Bext は完全な取引システムです。エントリーとエグジットのタイミング、そして取引の方向を示します。 緑の矢印 が表示されるたびに、 買い注文 を開きます。 赤い矢印 が表示されたら、すべての買い注文を閉じます。 同様に、 赤い矢印 が表示されたら、 売り注文 を開き、 緑の矢印 が表示されたらすべての売り注文を閉じます。 取引には M5(1分足) を使用し、 どの通貨ペアでも取引可能 です。 このインジケーターは 再描画されず 、ほとんど遅延しません。ただし、 ローソク足が確定するまで待つ という自然な条件はあります。 RSI フィルター と**2 つのクラシックな反転パターン(エンゴルフィング、ピンバー)**を使用し、反転の瞬間をほぼリアルタイムで捉えます。 インジケーターの効果的な使い方 どの通貨ペアでも使用可能 (テスト済み: GBPUSD, EURUSD ) 時間足:M5(1分足) 初期資金:500ドル以上 取引ロット:0.01 緑の矢印 が表示されたら、買い注文を開く。 赤い矢印 が表示されたら、すべての買い注文を閉じる。 赤い矢印 が表示されたら、売
このインジケーターを購入すると、プロ仕様のトレードマネージャーを無料で差し上げます。 まず第一に、このトレーディングシステムがノンリペイント、ノンリドロー、ノンラグのインジケーターであることを強調する価値がある。これにより、手動取引とロボット取引の両方に理想的なものになっています。 オンラインコース、マニュアル、プリセットのダウンロード。 「スマートトレンドトレーディングシステム MT5」は、新規および経験豊富なトレーダー向けにカスタマイズされた包括的なトレーディングソリューションです。10以上のプレミアムインジケーターを組み合わせ、7つ以上の堅実なトレーディング戦略を備えており、多様な市場状況に対応する多目的な選択肢となっています。 トレンドフォロー戦略:トレンドを効果的に乗り越えるための正確なエントリーとストップロス管理を提供します。 リバーサル戦略:潜在的なトレンドの反転を特定し、トレーダーがレンジ相場を活用できるようにします。 スキャルピング戦略:高速で正確なデイトレードおよび短期取引のために設計されています。 安定性:すべてのインジケーターはノンリペイント、ノンリドロー、ノ
現在40%OFF! このダッシュボードは、複数のシンボルと最大9つのタイムフレームで動作するソフトウェアの非常に強力な部分です。 このソフトは、弊社のメインインジケーター(ベストレビュー:Advanced Supply Demand)をベースにしています。    Advanced Supply Demand ダッシュボードは、素晴らしい概要を提供します。それは示しています。  ゾーン強度評価を含むフィルタリングされた需給値。 ゾーン内/ゾーンへのPips距離。 ネストされたゾーンがハイライトされます。 選択されたシンボルの4種類のアラートを全ての(9)時間枠で提供します。 それはあなたの個人的なニーズに合わせて高度に設定可能です。 あなたの利益! すべてのトレーダーにとって最も重要な質問です。 市場に参入するのに最適なレベルはどこか? 成功のチャンスとリスク/リターンを得るために、強力な供給/需要ゾーン内またはその近くで取引を開始します。 損切りの最適な位置はどこですか? 最も安全なのは、強力な供給/需要ゾーンの下/上にストップを置くことです。 最適な利益
まず第一に、この取引インジケーターは再描画されず、再描画されず、遅延しないことを強調する価値があります。これにより、手動取引とロボット取引の両方に理想的なものになります。 ユーザーマニュアル:設定、入力、戦略。 アトミックアナリストは、価格の強さとモメンタムを利用して市場でより良いエッジを見つけるためのPA価格アクションインジケーターです。ノイズや誤ったシグナルを除去し、取引ポテンシャルを高めるための高度なフィルターを備えています。複雑なインジケーターの複数のレイヤーを使用して、アトミックアナリストはチャートをスキャンし、複雑な数学的計算をシンプルなシグナルと色に変換します。これにより、どのような初心者トレーダーでも理解して使用し、一貫した取引の決定を行うことができます。 「アトミックアナリスト」は、新規および経験豊富なトレーダー向けにカスタマイズされた包括的な取引ソリューションです。プレミアムインジケーターとトップノッチの機能を1つの取引戦略に組み合わせ、すべてのタイプのトレーダーにとって汎用性のある選択肢にします。 デイリートレーディングとスキャルピング戦略:高速で正確な
Advanced Supply Demand
Bernhard Schweigert
4.91 (299)
現在40%オフ 初心者にもエキスパートトレーダーにも最適なソリューション このインジケーターは独自の機能と新しい公式を多数内蔵しており、ユニークで高品質かつ手頃な取引ツールです。このアップデートでは、2つの時間枠ゾーンを表示できるようになります。より長いTFだけでなく、チャートTFとより長いTF(ネストゾーンを表示)の両方を表示できます。すべてのSupply Demandトレーダーの皆さんのお気に召すはずです。:) 重要情報の公開 Advanced Supply Demandの可能性を最大化するには、 https://www.mql5.com/ja/blogs/post/720245 にアクセスしてください。   エントリーまたはターゲットの正確なトリガーポイントを正確に特定できれば取引がどのように改善されるか想像してみてください。新しい基盤となるアルゴリズムに基づいて構築されているため、買い手と売り手の間の潜在的な不均衡をさらに簡単に特定できます。これは、最も強い需要と供給のゾーンと、過去のパフォーマンス(古いゾーンを表示)がグラフィカルに表現されるためです。これらの機能は、最適な
Scalper Vault は、スキャルピングを成功させるために必要なすべてを提供するプロフェッショナルなスキャルピング システムです。このインジケーターは、外国為替およびバイナリー オプションのトレーダーが使用できる完全な取引システムです。推奨される時間枠は M5 です。 システムは、トレンドの方向に正確な矢印シグナルを提供します。また、トップとボトムのシグナルとギャン マーケット レベルも提供します。 インジケーターは、プッシュ通知を含むすべてのタイプのアラートを提供します。 インジケータの購入後にご連絡ください。私の個人的な取引の推奨事項と素晴らしいボーナス指標を無料で共有します! 幸せで有益な取引をお祈りします!
Looking for a powerful yet lightweight swing detector that accurately identifies market structure turning points? Want clear, reliable buy and sell signals that work across any timeframe and any instrument? Buy Sell Arrow MT Swing is built exactly for that — precision swing detection made simple and effective. This indicator identifies Higher Highs (HH) , Higher Lows (HL) , Lower Highs (LH) , and Lower Lows (LL) with remarkable clarity. It is designed to help traders easily visualize market stru
現在40%OFF! 初心者やエキスパートトレーダーのためのベストソリューション! このダッシュボードソフトウェアは、28の通貨ペアで動作しています。それは私達の主要な指標(高度な通貨の強さ28と高度な通貨インパルス)の2に基づいています。それは全体の外国為替市場の大きい概観を与えます。それは、すべての(9)時間枠で28の外国為替ペアのための高度な通貨の強さの値、通貨の動きの速度と信号を示しています。チャート上で1つのインディケータを使用して市場全体を観察し、トレンドやスキャルピングの機会をピンポイントで見つけることができたら、あなたのトレードがどのように改善されるか想像してみてください。 このインディケータには、強い通貨と弱い通貨の識別、潜在的な取引の識別と確認がより簡単になるような機能が搭載されています。このインディケータは、通貨の強さや弱さが増加しているか減少しているか、また、すべての時間枠でどのように機能しているかをグラフィカルに表示します。 新機能として、現在の市場環境の変化に適応するダイナミックなマーケットフィボナッチレベルが追加され、すでに当社のAdvanced
FX Power: 通貨の強弱を分析して、より賢い取引を実現 概要 FX Power は主要通貨と金の実際の強弱をあらゆる市場状況で理解するための必須ツールです。強い通貨を買い、弱い通貨を売ることで、 FX Power は取引の意思決定を簡素化し、高い確率の取引機会を見出します。トレンドを追従する場合でも、極端なデルタ値を使用して反転を予測する場合でも、このツールはあなたの取引スタイルに完全に適応します。ただ取引するだけではなく、 FX Power で賢く取引をしましょう。 1. なぜ FX Power がトレーダーにとって非常に有益なのか 通貨と金のリアルタイム強弱分析 • FX Power は主要通貨と金の相対的な強弱を計算し、マーケットダイナミクスに関する明確な洞察を提供します。 • どの資産がリードしているか、または後れを取っているかを監視して、取引するペアを賢く選びましょう。 マルチタイムフレームの包括的なビュー • 短期、中期、長期のタイムフレームで通貨と金の強弱を追跡し、マーケットトレンドに基づいて取引戦略を調整できます。 • スキャルピングからスイングトレード
El indicador "MR BEAST ALERTAS DE LIQUIDEZ" es una herramienta avanzada diseñada para proporcionar señales y alertas sobre la liquidez del mercado basándose en una serie de indicadores técnicos y análisis de tendencias. Ideal para traders que buscan oportunidades de trading en función de la dinámica de precios y los niveles de volatilidad, este indicador ofrece una visualización clara y detallada en la ventana del gráfico de MetaTrader. Características Principales: Canal ATR Adaptativo: Calcula
GOLD Impulse with Alert
Bernhard Schweigert
4.64 (11)
このインディケータは、当社の2つの製品 Advanced Currency IMPULSE with ALERT  +   Currency Strength Exotics . のスーパーコンビネーションです。 このインジケーターは全ての時間枠で作動し、8つの主要通貨と1つのシンボルの強弱のインパルスをグラフで表示します。 このインジケータは、金、エキゾチックペア、商品、インデックス、先物など、あらゆるシンボルの通貨強度の加速度を表示することに特化されています。金、銀、原油、DAX、US30、MXN、TRY、CNHなどの通貨強度の加速度(インパルスまたは速度)を表示するために、任意のシンボルを9行目に追加できる、この種の最初のものです。 新しいアルゴリズムに基づいて構築され、潜在的な取引の特定と確認がさらに容易になりました。これは、通貨の強さや弱さが加速しているかどうかをグラフィカルに表示し、その加速の速度を測定するためです。加速すると物事は明らかに速く進みますが、これはFX市場でも同じです。つまり、反対方向に加速している通貨をペアリングすれば、潜在的に利益を生む取引を特定
このインジケーターは、反転ポイントと価格戻りゾーンを正確に表示します。     主要プレーヤー 。新たなトレンドが形成される場所を把握し、最大限の精度で意思決定を行い、すべての取引をコントロールします。 TREND LINES PRO インジケーターと組み合わせることで、その潜在能力を最大限に発揮します。 VERSION MT5 インジケーターが示す内容: 新しいトレンドの始まりに活性化する反転構造と反転レベル。 リスクと報酬の比率を最小限に抑えた利益 確定 と 損失停止の レベルの表示     RR 1:2   。 インテリジェントな削減ロジックによるストップロス。 指定されたインジケーターから 2 つのトレンド タイプの反転パターンを表示します。 指標: トレンドを追う   TREND LINES PRO   (世界的なトレンドの変化) TREND PRO   (クイックトレンド変更) シンプルで効果的   スキャナー   リアルタイムトレンド(新機能)。 マルチタイムフレームのインストゥルメント フィルタリング。 画面   利益     LOGIC AI信号の後。 当日プラス方
これはほぼ間違いなく、MetaTraderプラットフォームで見つけることができる最も完全な調和価格形成自動認識インジケーターです。 19種類のパターンを検出し、フィボナッチプロジェクションをあなたと同じように真剣に受け止め、潜在的逆転ゾーン(PRZ)を表示し、適切なストップロスとテイクプロフィットレベルを見つけます。 [ インストールガイド | 更新ガイド | トラブルシューティング | よくある質問 | すべての製品 ] 19の異なる調和価格形成を検出します プライマリ、派生および補完フィボナッチ投影(PRZ)をプロットします 過去の価格行動を評価し、過去のすべてのパターンを表示します この指標は、独自の品質とパフォーマンスを分析します 適切なストップロスとテイクプロフィットのレベルを表示します ブレイクアウトを使用して適切な取引を通知します すべてのパターン比をグラフにプロットします 電子メール/音声/視覚アラートを実装します スコット・M・カーニーの本に着想を得て、この指標は最も純粋で急を要するトレーダーのニーズを満たすように設計されています。ただし、トレードを容易にする
Step into the world of Forex trading with confidence, clarity, and precision using   Gold Indicator   a next-generation tool engineered to take your trading performance to the next level. Whether you’re a seasoned professional or just beginning your journey in the currency markets, Gold Indicator equips you with powerful insights and help you trade smarter, not harder. Built on the proven synergy of three advanced indicators, Gold Indicator focuses exclusively on medium and long-term trends eli
Weis Wave with Alert
Trade The Volume Waves Single Member P.C.
4.82 (22)
Rental/Lifetime Package Options and Privileges' Rent Monthly Six Months   Yearly/Lifetime Weis Wave with Speed with Alert+Speed Index x x x Manual  x x x Quick Set up Video x x x Blog x x x Lifetime Updates x x x Setup and Training Material x x Rectangle Break Alert Tool      x Discord Access Channel "The SI traders" x   How to trade info visit:    http://www.tradethevolumewaves.com   ** If you purchase please contact me to setup your  : training Room and  complete manual access.  This is
Apollo Secret Trend は、任意のペアと時間枠でトレンドを見つけるために使用できるプロのトレンド インジケーターです。インジケーターは、取引するペアや時間枠に関係なく、市場のトレンドを検出するために使用できる主要な取引インジケーターになることができます。インジケーターで特別なパラメーターを使用することにより、シグナルを個人の取引スタイルに適応させることができます。 このインジケーターは、PUSH 通知を含むすべてのタイプのアラートを提供します。インジケータの信号は再描画しないでください!提供されたスクリーンショットでは、アポロ シークレット トレンド インジケーターと買われ過ぎ/売られ過ぎのオシレーター インジケーターを組み合わせて見ることができます。これは完全に無料で提供されます。 購入後、2 番目の買われすぎおよび売られすぎのオシレーター インジケーターを無料で入手するために私に連絡してください!また、システムの使用方法についても説明します。お得な特典もご用意しております!
チャートを構成し、周期的な価格変動を識別するテクニカル指標。 どのチャートでも動作します。 いくつかの種類の通知。 グラフ自体に追加の矢印があります。 履歴を再描画せずに、キャンドルのクローズに取り組みます。 M5以上のTFを推奨します。 パラメータの使用と設定が簡単です。 異なるパラメータを持つ 2 つのインジケーターを使用する場合、他のインジケーターなしで使用できます。 入力パラメータは2つあります 周期性と信号持続時間 これら 2 つのパラメータは、チャート構造の処理を扱います。 Cyclicity - 反転サイクルが変化する頻度を調整し、サイクルを滑らかにします。 Signal duration - 最小数では価格変動の衝動を検出し、最大数では長期的なトレンドの動きを検出します。
通貨強さウィザードは、取引を成功させるためのオールインワン ソリューションを提供する非常に強力な指標です。このインジケーターは、複数の時間枠のすべての通貨のデータを使用して、このまたはその外国為替ペアのパワーを計算します。このデータは、使いやすい通貨インデックスと通貨パワーラインの形式で表され、特定の通貨のパワーを確認するために使用できます。 必要なのは、取引したいチャートにインジケーターを接続することだけです。インジケーターは、取引する通貨の実際の強さを示します。このインジケーターは、トレンドに合わせて取引するときに有利に利用できる売買高の圧力の極値も示します。このインジケーターには、フィボナッチに基づく可能なターゲットも表示されます。 このインジケーターは、PUSH 通知を含むあらゆるタイプのアラートを提供します。 購入後ご連絡下さい。私の取引のヒントをあなたと共有し、素晴らしいボーナスインジケーターを無料で提供します! 幸せで有益な取引をお祈りします。
PRO Renko Systemは、特別にRENKOチャートを取引するために設計された高精度の取引システムです。 これは、様々な取引商品に適用することができる普遍的なシステムです。 システムは効果的に正確な逆転信号へのアクセスを与えるいわゆる市場の騒音を中和する。 表示器は非常に使いやすく、信号の生成に責任がある1つの変数だけがあります。 あなたは簡単にお好みの任意の取引ツールとレンコバーのサイズにツールを適応させることができます。 私はいつもあなたが私のソフトウェアで収益性の高い取引を支援するために余分なサポートを提供する準備ができています! 私はあなたに幸せで収益性の高い取引をしたいです! ご購入後にご連絡ください! 私はあなたに私のレンコチャートジェネレータを送信します。 私はまた、私の個人的な推奨事項やシステムの他のモジュールを無料で共有します!
System Trend Pro - This is the best trend trading indicator!!! The indicator no repaint!!!  The indicator has   MTF   mode, which adds confidence to trading on the trend (   no repaint   ). How to trade? Everything is very simple, we wait for the first signal (big arrow), then wait for the second signal (small arrow) and enter the market in the direction of the arrow. (See screens 1 and 2.) Exit on the opposite signal or take 20-30 pips, close half of it, and keep the rest until the opposite
トレンドラインプロ   市場の真の方向転換点を理解するのに役立ちます。この指標は、真のトレンド反転と主要プレーヤーが再び参入するポイントを示します。 分かりますか     BOSライン   複雑な設定や不要なノイズなしに、より長い時間足でのトレンドの変化と重要なレベルを把握できます。シグナルは再描画されず、バーが閉じた後もチャート上に残ります。 VERSION MT 5     -     RFI LEVELS PRO インジケーター と組み合わせることで、その潜在能力を最大限に発揮します。 インジケーターが示す内容: 本当の変化   トレンド(BOSライン) 一度シグナルが現れたら、それは有効です!これは、リペイント機能を持つインジケーターとの重要な違いです。リペイント機能を持つインジケーターは、シグナルを発した後、それを変更し、資金の損失につながる可能性があります。これにより、より高い確率と精度で市場に参入できます。また、矢印が現れた後、目標値(利益確定)に達するか、反転シグナルが現れるまで、ローソク足の色を変更する機能もあります。 繰り返しエントリ       主要プレーヤーの
Top Bottom Tracker は、洗練されたアルゴリズムに基づき、市場のトレンドを分析し、トレンドの高値と安値を検出することができるインジケーターです / MT5バージョン 。 価格は500$に達するまで徐々に上昇します。次の価格 --> $99 特徴 リペイントなし このインジケーターは 新しいデータが到着してもその値を変更しません 取引ペア すべてのFXペア 時間枠 すべての時間枠 パラメーター ==== インジケータの設定 設定パラメータ // 40 (値が高いほど、シグナルは少なくなりますが、より正確です) 上レベル値 // 80 (上水平線の値) 下限値 // 20 (下限水平線の値) インジケータ計算バー // 3000 (何本分のインジケータを計算するか。0を指定すると、全てのバーに対してインジケータを計算します) ==== アラーム設定 ポップアップアラート // true (端末にアラームを表示) メールアラート // true (アラームをメールで通知) アラート時間間隔 // 10 (アラーム間隔 (分)) 警告
作者のその他のプロダクト
Price Line
Nikolay Likhovid
5 (1)
High, Low, Open, Close — isn't this too much? Sometimes you need a unique history of prices. But if choose one thing, you lose the rest. Smoothing also leads to data loss. Often you lose one of the most important market details: information about extremes. It is due to the preservation of information about the highs and lows, the correct "smoothing" for the history of price is a zigzag. But zigzags also have drawbacks — they do not provide intermediate values. The Price Line indicator solves thi
FREE
HZZ
Nikolay Likhovid
3.5 (2)
This is a very fast and not redrawing ZiGZag; it supports switching the segments at breakouts of price levels located at a specified distance (H parameter) from the current extremum. MinBars parameter sets the depth of history for drawing the indicator; 0 means drawing on the entire history. SaveData parameter allows writing the coordinates of extremums to a file (time in the datatime format and price). Some statistics calculated on the basis of the ZigZag is displayed in the form of comments.
FREE
Do you use dynamic ranges (like Bollinger Bands or Envelopes) in your trading? A fixed period is usually used for such calculations. But is such approach relevant to the very nature of the market? In fact, the price chart consists of a series of successive processes - trends and flats. In this case, we can talk about the internal development logic inside a single process only. Therefore, the nature of the market is better described by dynamic ranges designed for the processes occurring "here and
FREE
Murray levels are popular among traders. You can easily find indicators for drawing the levels on the internet. The main difference and advantage of the Forced Murrey Math indicator is the execution speed. This makes it perhaps the best choice for use in Expert Advisors that require thorough testing and optimization on a long history of quotes. Also the indicator draws history, so it will be very useful for visual analysis of interaction of price with the Murray levels in the past. The method of
The RTrends indicator does two things: first, it automatically draws the layout of the price chart by plotting trend lines and, secondly, it produces bearish and bullish signals. The layout reflects the fractal nature of the market. Trends from different time horizons are applied simultaneously on the chart. Thus, from a single chart a trader can see trend lines of higher timeframes. The lines, depending on the horizon, differ in color and width: the older the horizon, the thicker the line is. T
Smart ZigZag indicator is a ZigZag, for which the market is actually not accidental. This is not mere words, as this can be confirmed by displayed charts comparing Smart ZigZag and HZZ parameters. But before I describe the screenshots, let's examine a few details concerning Smart ZigZag. This indicator analyzes the chart and identifies certain activity horizons assigning numbers to them. This can be called ranking. For example, M1 EURUSD chart from 4.01.1999 to 3.12.2013 has the average segment
Do you use dynamic ranges (like Bollinger Bands or Envelopes) in your trading? Usually such calculations use a fixed period, but does it reflect the nature of the market? In fact, the price chart consists of a series of successive processes - trends and flats. In this case, we can talk about the internal development logic inside a single process only. Accordingly, the dynamic ranges built for the process occurring "here and now" suit the nature of the market better. The Growing Bands indicator u
フィルタ:
Winston Sim Siong Khim
270
Winston Sim Siong Khim 2022.05.20 17:49 
 

ユーザーは評価に対して何もコメントを残しませんでした

sam0709
98
sam0709 2021.10.09 09:58 
 

+++

Tim Eubanks
5763
Tim Eubanks 2018.03.22 03:32 
 

ユーザーは評価に対して何もコメントを残しませんでした

Pealres Lukinskas
215
Pealres Lukinskas 2017.12.30 05:57 
 

Really Good. One of the best auto trendlines calculator in the market and its free. Many thanks to the developer

Maksym Mudrakov
30049
Maksym Mudrakov 2016.08.31 07:32 
 

ユーザーは評価に対して何もコメントを残しませんでした

レビューに返信