Smooth Strength Lines
- インディケータ
- バージョン: 1.4
- アクティベーション: 5

Currencies Strength Meter Smooth Lines
Currencies Strongest Weakest
it draws Currencies TREND Volatility Power / Strength lines :
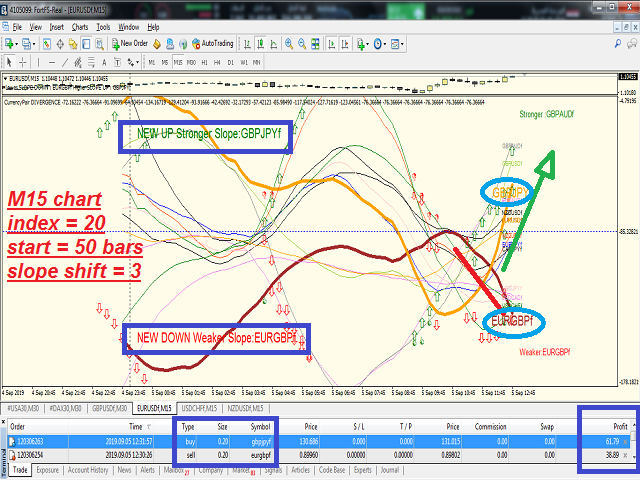
- Detects the 2 highly TRENDED Volatile pairs ( will be the Bold Lines )
- A very Helpful Indicator
- It draws smooth lines for up to 20 currencies pairs representing Volatility strength and power
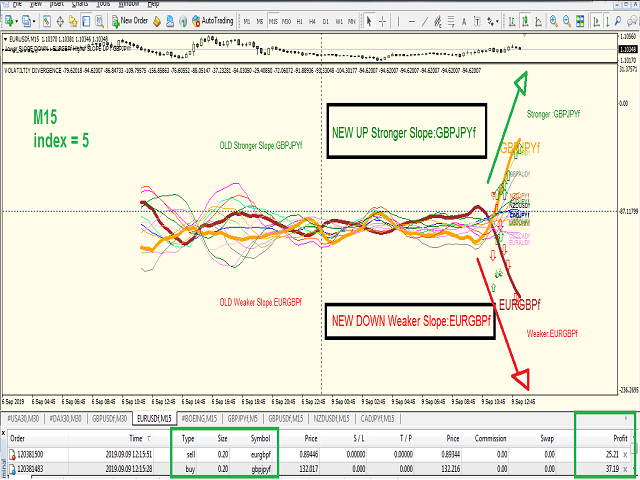
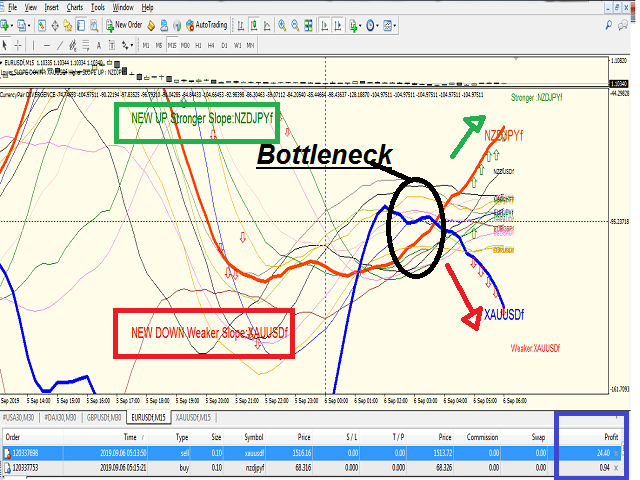
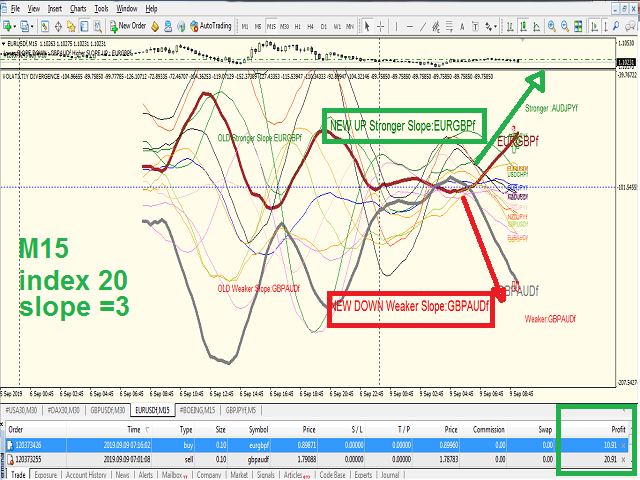
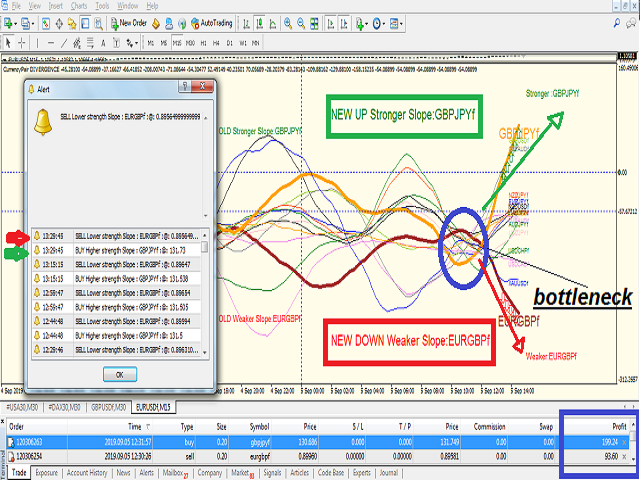
- First it indicates the most powerful trended direction pairs : Strongest / Weaker
- MAIN FUNCTION :it gives indication of the UP trend most Volatile Line and the DOWN trend most VOLATILE line
which could help the decision to buy the higher volitile UP/DOWN pairs
1-MAIN NEW STRATEGY:
BUY the UP higher volitile strength line pair (when departing Up from the Medium Dashed level OR Crossing it UP): (label indicated on chart) and with up green arrows untill a red thumb appears or wait for line to cold down and return to dashed medium level
SELL the DOWN volitile strength line pair (when departing Down from the Medium Dashed level OR Crossing it DOWN) : (label indicated on chart) and with down red arrows until a green thumb appears or wait for line to cold down and return to medium level
2-Second STRATEGY:
BUY the Strongest pair
SELL the Weakwst pair
3- Money management I use with Strategy 1 and 2 : (Very important)
In Asian Markets time : use 1% of margin for new Buy/Sell Signals
In Europe Markets time : use 3% of marginfor new Buy/Sell Signals
In USA Markets time : use 9% of margin for new Buy/Sell Signals
At the end of Day : I recommend closing all opened positions to start a new day
***Works on any Time frame but i recommend from M15 M30 H1 .... (lowest frames need higher index of calculation values)
ALERTS :: receive messages alerts on new pairs highly deviated in volatility
Click symbol label to open its chart for trading
the MAin inputs: ( I use M15 time frame for any of your selected symbols)
1-Index of calculations : 10/15/20/25/50/.... ( I use on: M15 time frame : 20) ( I use on: M30 time frame : 10)
2-Startpoint of drawing : 100 - 200 ... bars (I use: 100 for lowest processor overhead)
3-Slope shift : 2,3,4,5.... ( I use: 2/3 for fast detection of newer deviated lines)
4- Alerting option : true /false
5- up to 20 input symbols ( For me I work with 4 symbols only : eurusd , gbpusd , usdcad, usdchf )
**make sure to download enough symbols data M1to D1 for all input symbols before installing
**make sure for correct input symbols (as symbols differs from brokers to another and from account to another)
**make sure to test it before purshase !