Golden Spikes Detector
- インディケータ
- バージョン: 1.70
- アップデート済み: 6 9月 2025
- アクティベーション: 5

Golden Spikes Detector
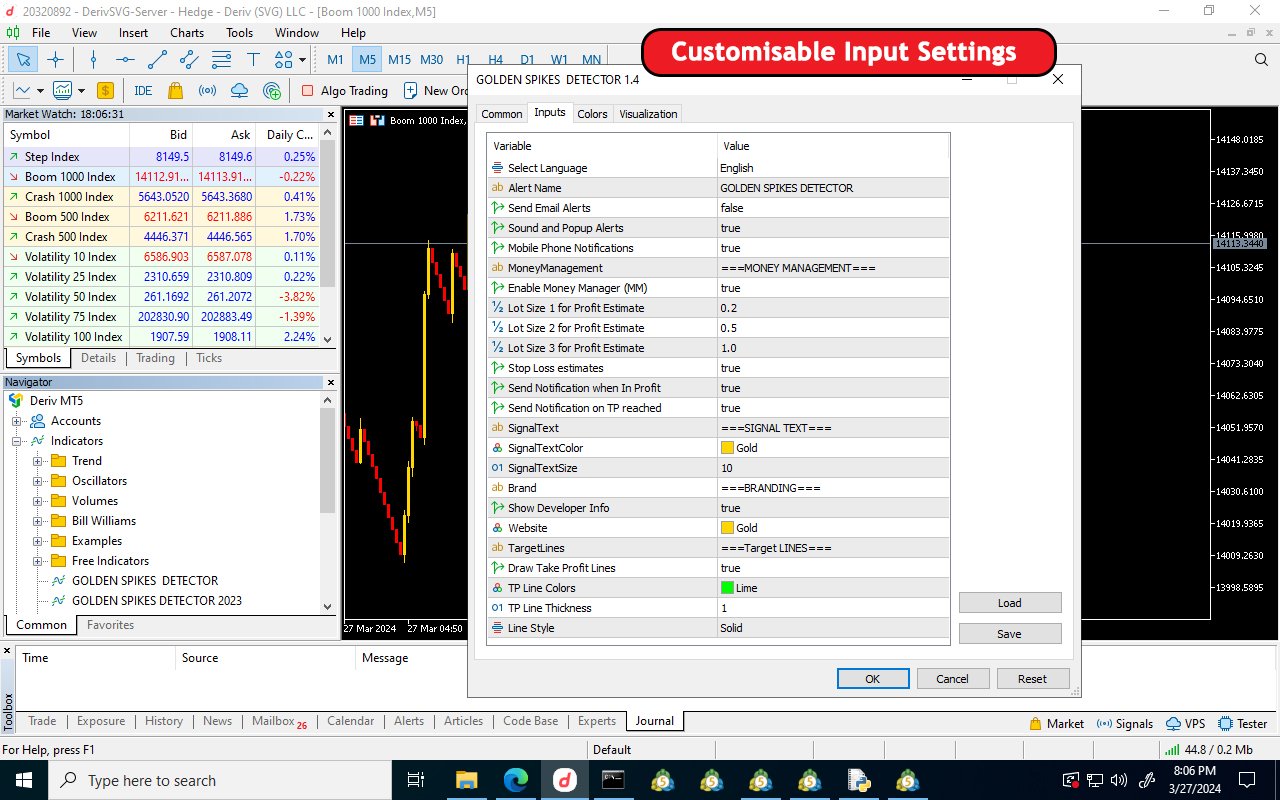
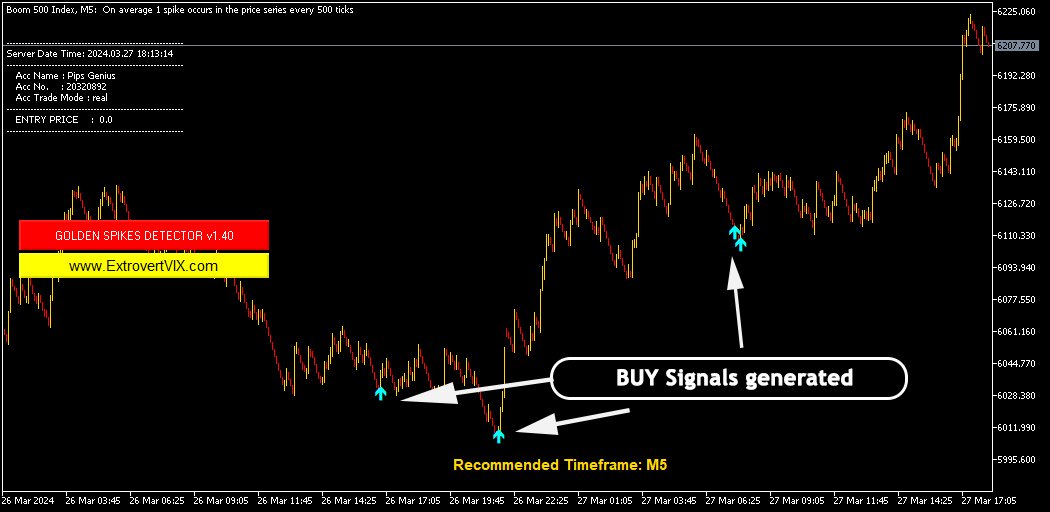
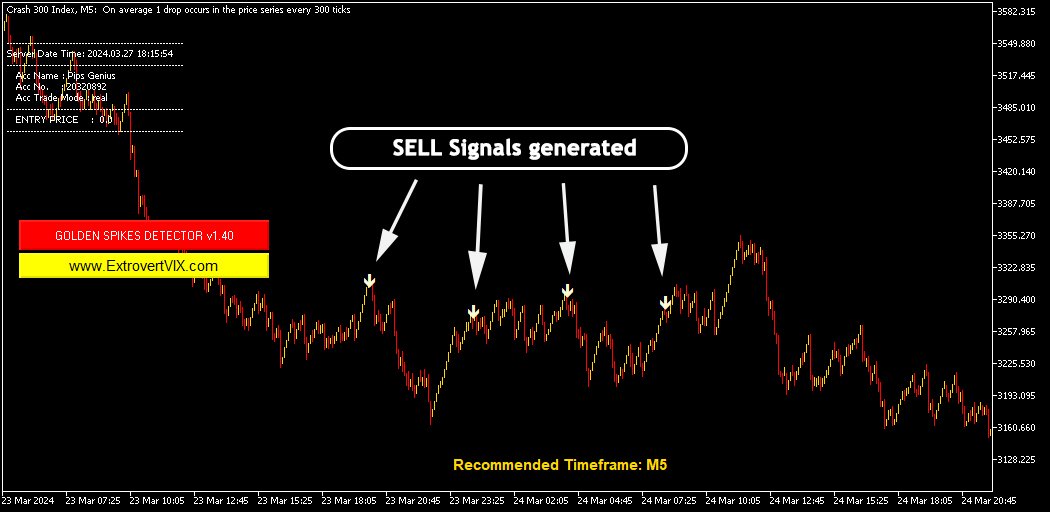
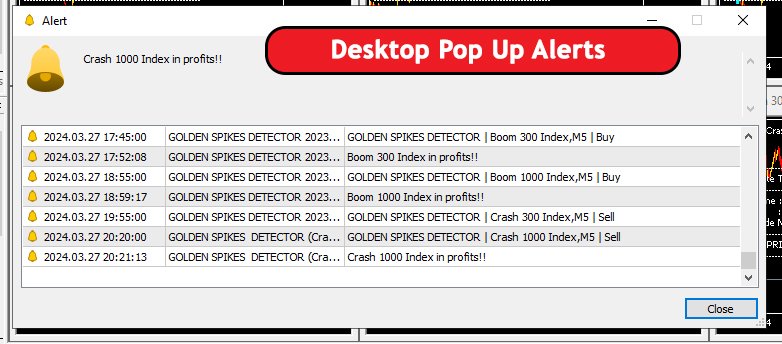
This indicator is based on a strategy primarily for trading spikes on Boom and Crash Indices. It alerts on potential Buy and Sell entries. To trade spikes on the Deriv or Binary broker, only take Buy Boom and Sell Cash alerts. It was optimised to be loaded on 5-minute timeframe although multiple timeframe analysis is done in the background.
Features
· Desktop pop up and sound alerts on computer or laptop
· Sends push notifications to mobile phone
· Sends email notifications
· Displays non repaint arrows (up arrows for Boom Indices buy and down arrows for Crash Indices sell)
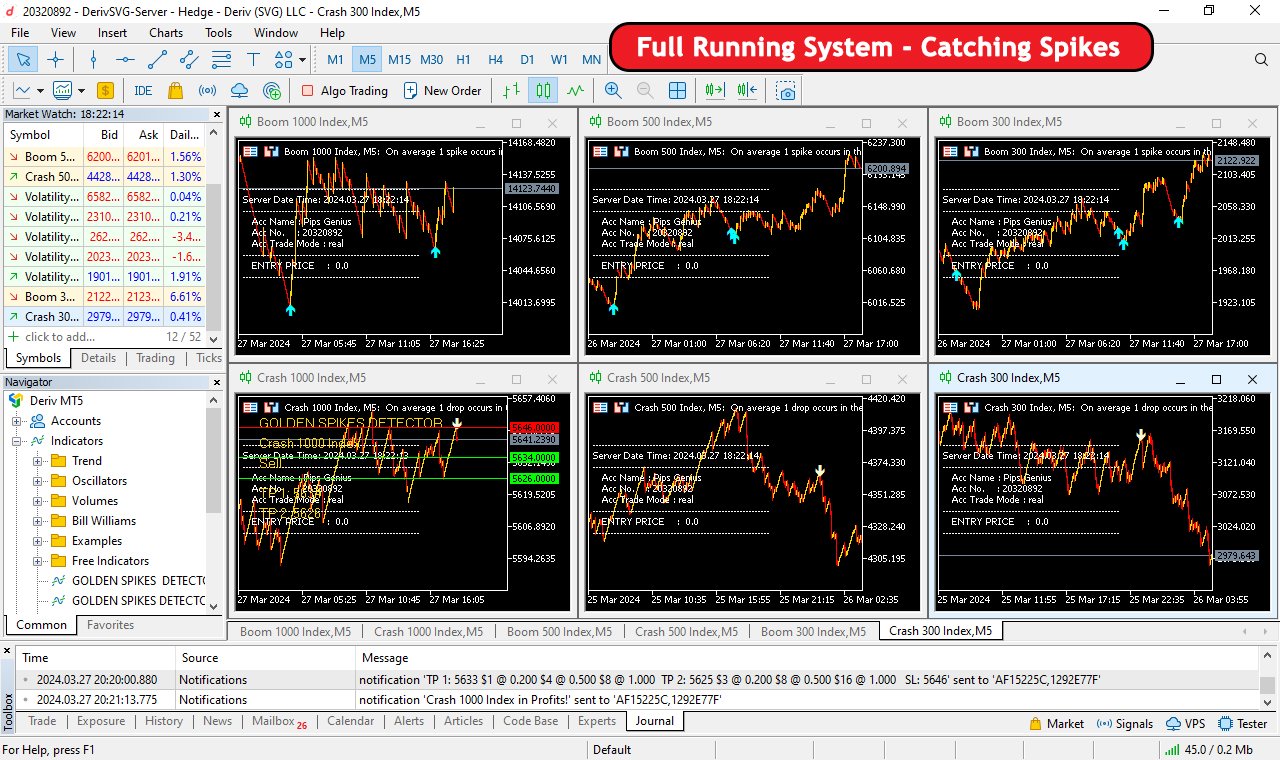
· Gives two take profit estimates. Horizontal lines drawn for easy observation
· Gives good stop loss estimates to minimise loss in case of drawdowns
· Multiple language support – English, French, Spanish, Portuguese and Malay
Recommendation
· Use a Virtual Private Server (VPS) for 24/7 alerts on mobile phone
· Use 5 Minute timeframe
· Set on all the Boom 1000, Boom 500, Boom 300, Crash 300, Crash 500 and Crash 1000 charts
· Estimate Take Profit and Stop Loss near Support and Resistance areas
Contact the Developer
https://www.mql5.com/en/users/batsielm/
Trading Risks
Trading foreign exchange on margin carries a high level of risk, and may not be suitable for all investors. The high degree of leverage can work against you as well as for you. Before deciding to invest in foreign exchange, you should carefully consider your investment objectives, level of experience, and risk appetite.

Quite good support from developer.