Redsword Price Action Supply Demand Indicator
- インディケータ
- バージョン: 5.21
- アップデート済み: 3 6月 2020
- アクティベーション: 5

With this indicator, you can easily make price regions in all time zones. In addition, with the automatic supply demand finder, you can ensure that the new regions are found automatically. You can increase your transaction quality by reaching more accurate operations with this auxiliary Tool and indicator.
I share your trial version of EURUSD for free with you. If you want to buy the working version in all parities, you can contact me.
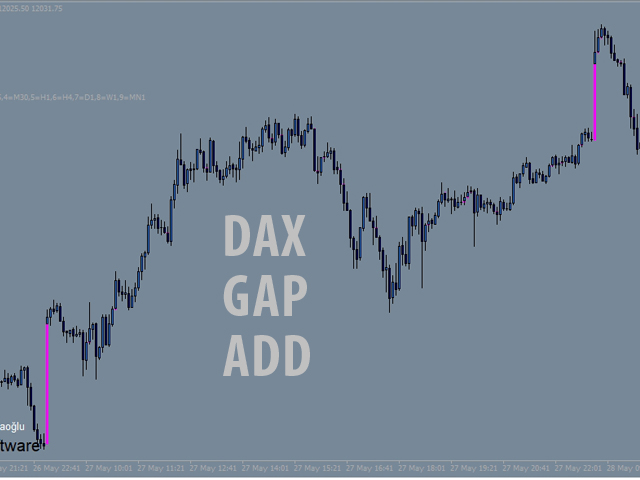
+New version Gap Bar Add ( Press G keyboard )
+Redsword Price Action Levels Show/Hide ( Press R keyboard )
Default configration time period : M5 / Please select M5 Time Period for Chart
You can open and close the numbers below by pressing the keyboard for hide and show feature of the drawn graphics.
M1 = 1 / 1min
M5 = 2/5 min
M15 = 3/15 min
M30 = 4/30 min
H1 = 5/1 Hour
H4 = 6/4 Hours
D1 = 7 / Day
W1 = 8 / Week
MN1 = 9 / Month
best regards redsword