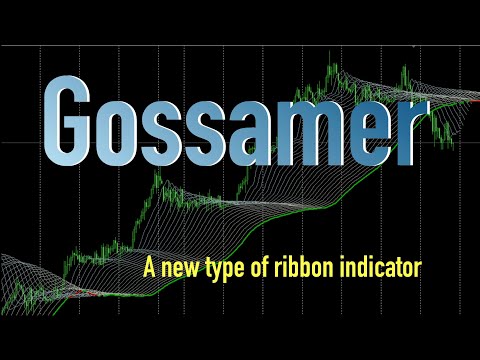
Gossamer MT5
- インディケータ
-
Paul Anderson
 I'm a retired Computer Science Professor who has been trading for over 20 years.
 - バージョン: 1.0
- アクティベーション: 5
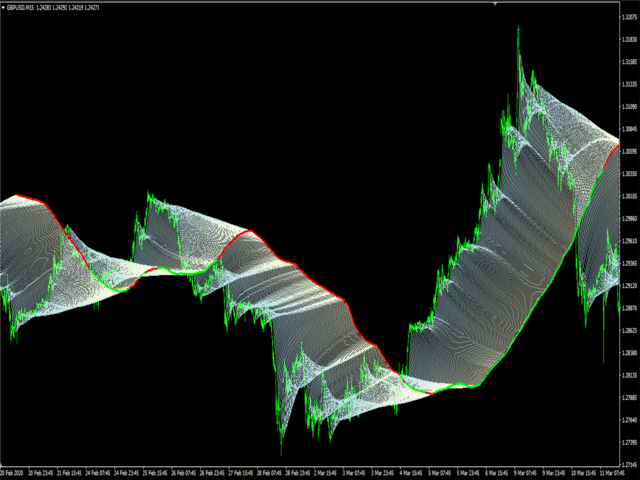
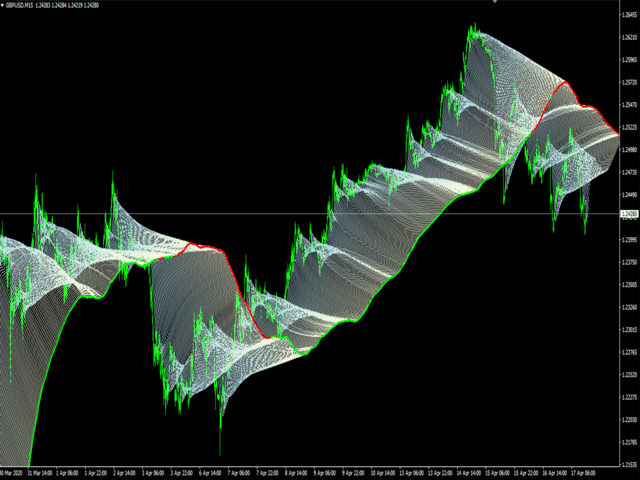
Gossamer is a moving average ribbon indicator that uses a novel approach to identify breakout trades in trending markets.
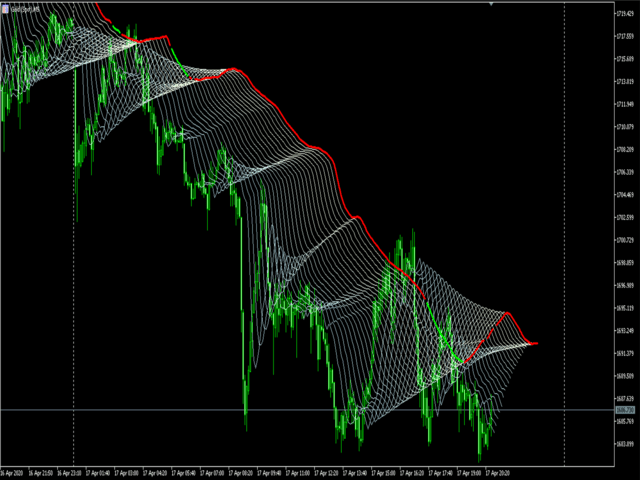
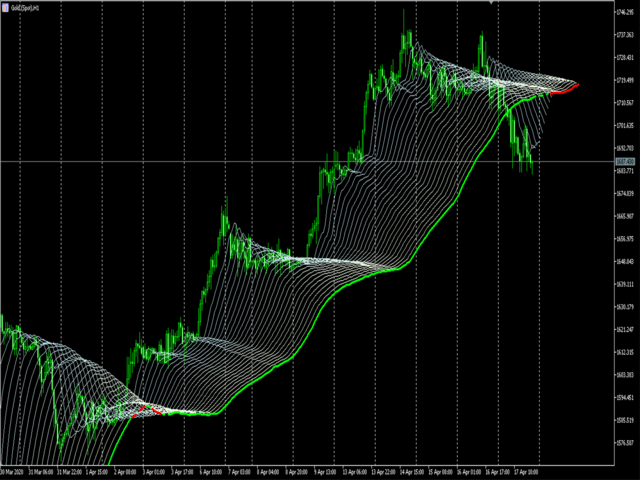
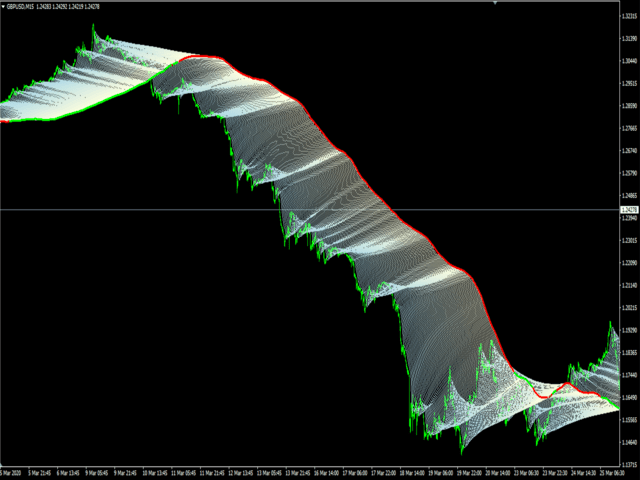
By applying a progressive period shift to each moving average, levels of consolidation become visible. Enter trades when price breaks out in the direction of the prevailing trend. Stoploss should be located on the other side of the consolidation from the breakout. Profits can be taken at the next consolidation or the stoploss trailed and the position built.
Applicable to all instruments and timeframes, it is particularly effective in strongly trending markets.
The following settings are available:
| Name | Default value | Purpose |
|---|---|---|
| MaMethod | MODE_EMA | Moving average method applied to all the moving averages in the ribbon |
| MaAppliedPrice | PRICE_MEDIAN | Moving average applied price for all the moving averages in the ribbon |
| PeriodStart | 2 | Period of the first moving average period (default EMA(2)) |
| PeriodStep | 1 | Period step between the moving averages, periods of 2,3,4,5,... by default |
| StepCount | 20 | Number of moving averages in the ribbon. Constrained to a maximum of 60 |
| MaShiftFactor | 1 | Multiplication factor applied to the period to calculate the moving average shift |
| StartColor | clrLightSalmon | A gradient colour scheme can be applied to the ribbon. This is the starting colour |
| EndColor | clrPaleTurquoise | The end colour applied to the ribbon. If clrNONE is selected, then the startColor is applied to the whole ribbon |
| TrendLineWidth | 3 | The last moving average in the ribbon is used as a colour coded trend indicator. A thicker line width is applied to highlight the colour indicating the trend. |
| BuyColor | clrLime | Colour applied to the trend indication moving average if the assessed trend is UP |
| SellColor | clrRed | Colour applied to the trend indication moving average if the assessed trend is DOWN |
| MaxBars | 5000 | Maximum bars to which the ribbon is applied. Applying the indicator to a large number of bars uses a lot of system resources and will slow the indicator down. It is generally not advised to apply the indicator to more than 10,000 bars. A warning is issued if you do, although you are not prevented from do so if you wish. |