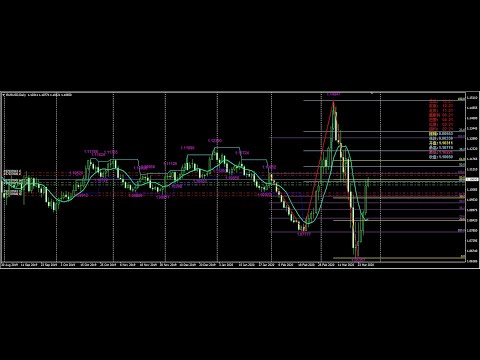
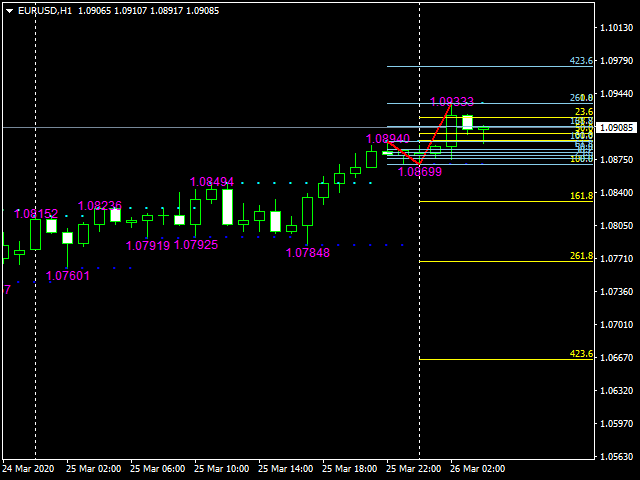
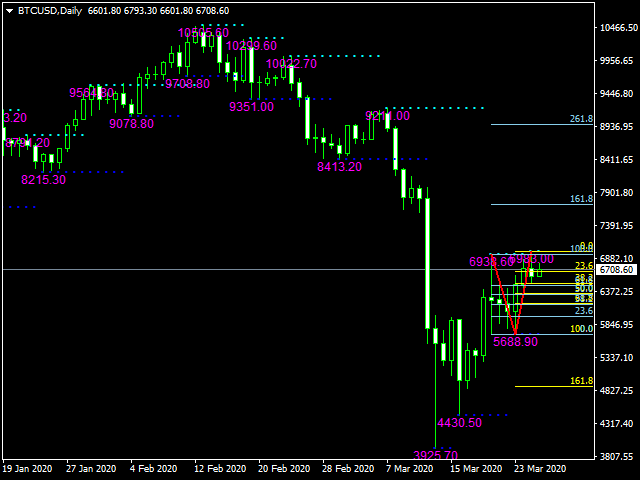
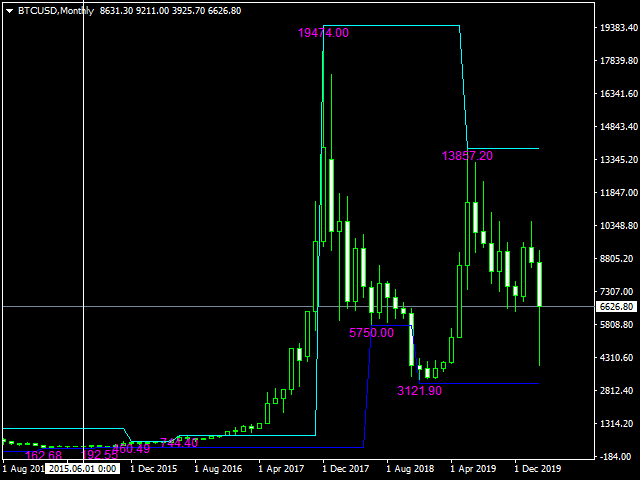
Fibonacci indicator based on fractal
- インディケータ
-
Ge Senlin
 Quantitative strategy researcher, program trading developer
Professional foreign exchange EA development, block chain project development
github blog https://github.com/yyy999 - バージョン: 2.0
- アクティベーション: 5
Fibonacci indicator based on fractal.This software can automatically draw the golden section proportional line of two trend lines, and mark all the recent high and low prices.And the percentage value of volatility is a multi-cycle, multi-currency oscillation indicator.It is very effective for traders to find support and resistance lines and find entry and exit points near them.