Rocket Profit Combo5
- インディケータ
-
iyiola james
 I am a programmer with over 10 years experience in hmo business and derivatives trading.
I have passion for mt4, mt5, binary options, tradestation and ctrader ea, scripts, strategy and indicators development.
Download and checkout all our eas and Indicators on mql5.com - バージョン: 1.0
- アクティベーション: 7
This is a great Metatrader5 Tool, which you can use Daily for your profitable Trading. The Accuracy is the best system you need to succeed in trading without stress. The signals doesn't repaint at all, alerts on bar close, and stays glued. The system works on MT5 and another version for MT4 also available.
What you get upon purchase:
-Lifetime support for the use of the system
- Easy to use, clean user friendly interface with no single settings required
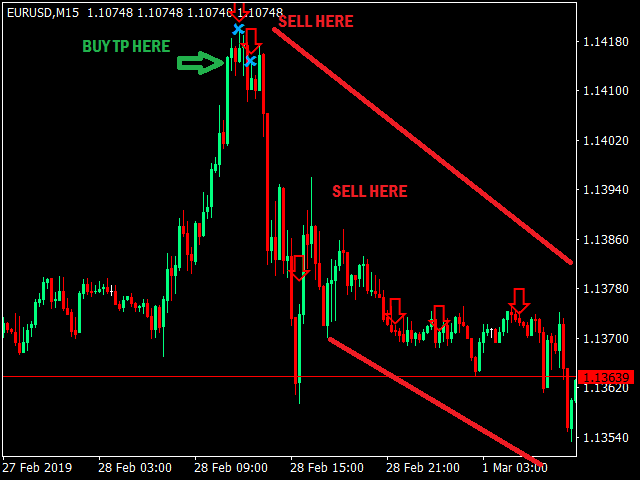
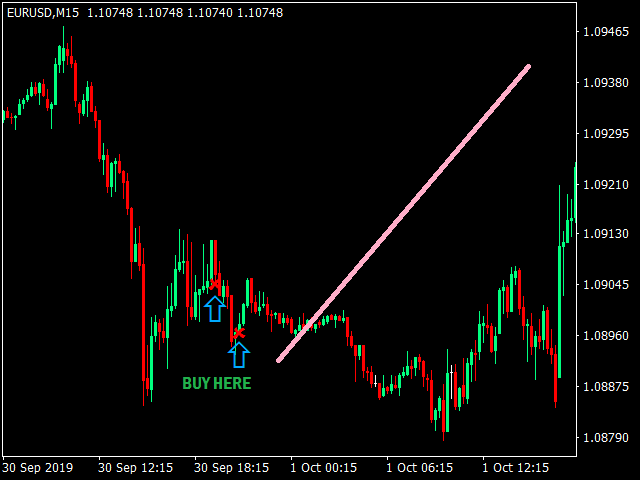
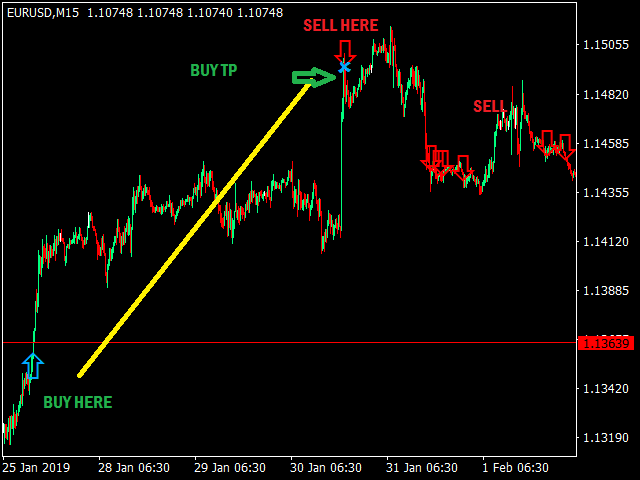
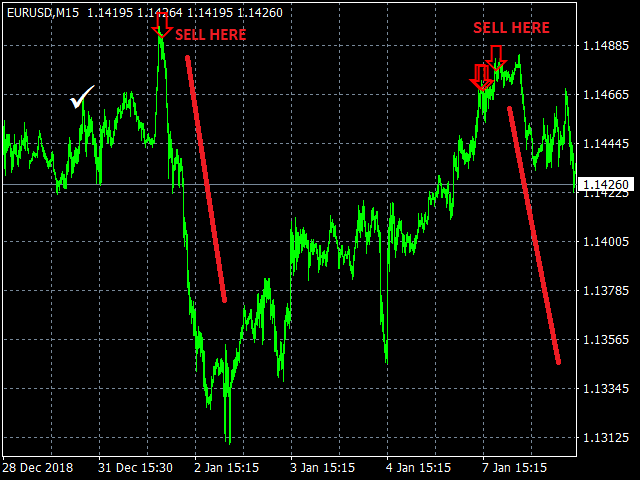
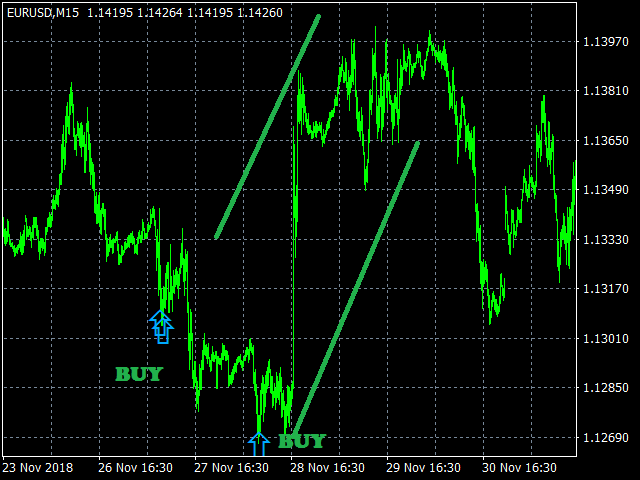
- Arrow Signals showing where to buy and sell
-Visual Arrows, Sound Alert, Email and sms alert functionalities
- Customizable colors and sizes
-Lifetime Updates
- Both Trend and breakout signals
-Appropriate signals for both Entry levels, Take profit levels and stop loss
ACCURATE SIGNALS WITH SIMPLE AND USER FRIENDLY INTERFACE MAKES THIS INDICATOR UNBEATABLE. This system has a target pip range of only 50-250 pips per trade depending on currency Volatility and is reliable.
How to use this Indicator.
This is a smart and flexible Forex Indicator which fits all types of Trading styles.
This Powerful Indicator can be used on timeframes from 1 minutes to 1Hour.
All timeframes are profitable and the choice of timeframe depends on individual Trader (user).
Traders who prefer placing trades several times daily will love 1 minutes or 5 minites Timeframe while Traders who prefer less than 10 trades daily might go for 5 Minutes - 15 Minutes timeframe..
What kind of trader are you? Kindly Download Test, and select your preferred Timeframe. All Timeframes are Accurate.
Looking for Mt4 Version of this Indicator? Kindly visit the link below;