TrueTrendTeller
- インディケータ
- バージョン: 3.96
- アップデート済み: 10 10月 2018
- アクティベーション: 5

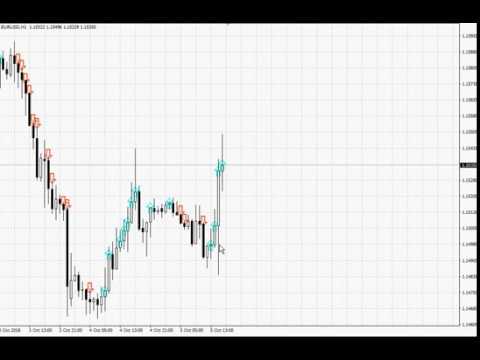
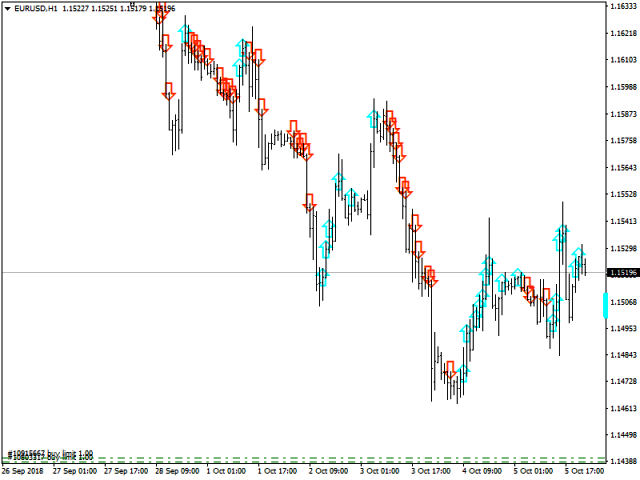
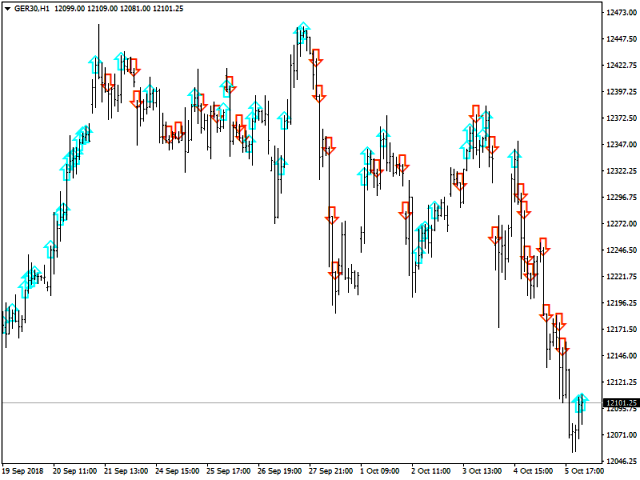
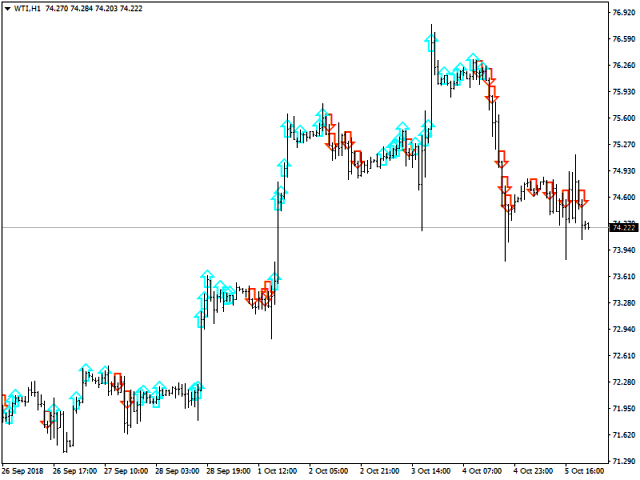
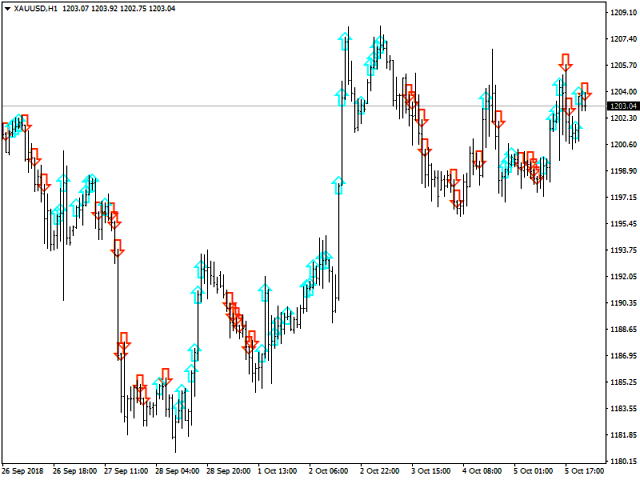
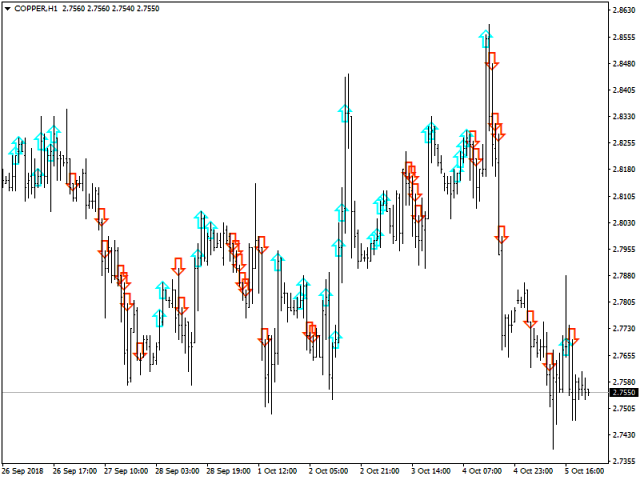
This indicator based on OBV. He is essentially trending, it can "feel" the trend change. The arrow-signal does not disappear and does not redraw after a bar closes. An order may be opened towards the arrow direction at the next bar after the signal appears. Using this indicator is intuitive. Once the first turquoise arrow appears, buying is preferred. Red – selling.
I recommend using the indicator on the H1 timeframe. When the first hand of the opposite color appears and the hour bar closes, you can search for a trade entry on a smaller timeframe towards H1. The indicator is perfect as a filter for your manual or automated trading system.
When creating an EA use the «0» buffer of the indicator for selling, the «1» buffer for buying.
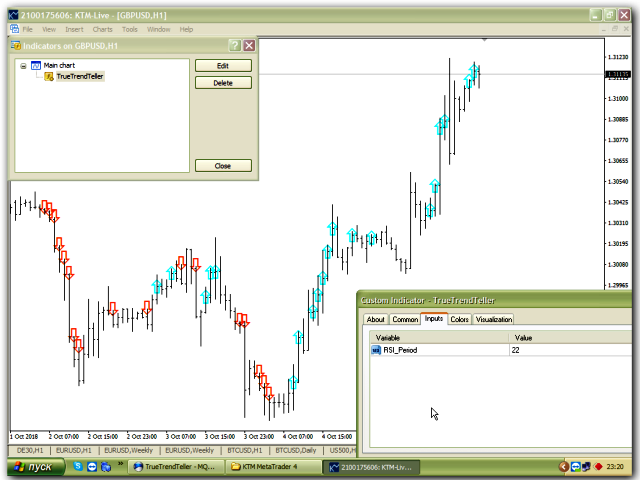
The indicator parameters
The indicator has one custom parameter.
RSI Period - 7 - the recommended value for a high quality indicator on automated trading systems operating on smaller timeframes.