TimeFrame Changer Pro
- インディケータ
- バージョン: 1.0
- アクティベーション: 5

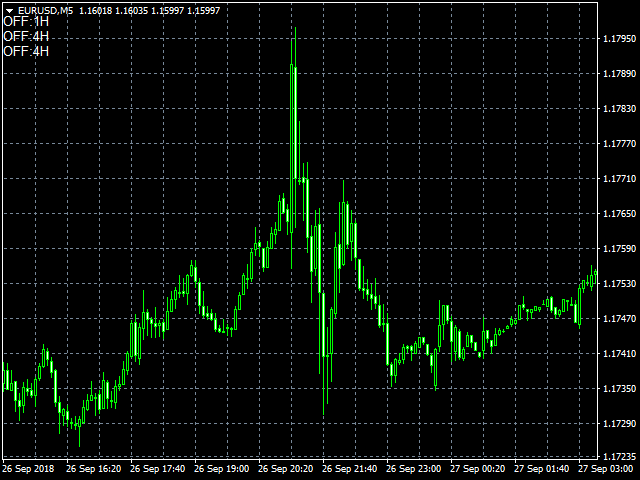
This indicator change timeframe of charts(up to 15) at the same time,by clicking a label.
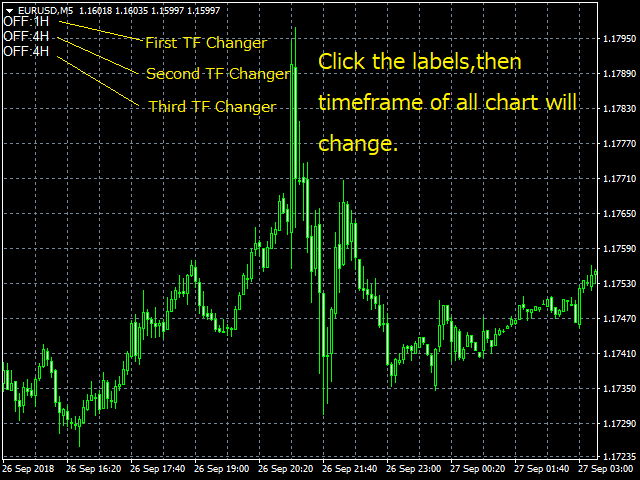
If you click the label(shown below),timeframe of charts will change.
If you click again,timeframe of charts restore.
You can change the position of the label.
You can change charts up to 15 charts.
You can add second,third timeframe changer label.
This indicator is very useful for speed trading.
*This indicator don't work propery in strategy tester.Use Free version to know the real potential.
Input Parameters
- TimeFrame1- All charts will be changed to this timeframe when first label clicked.
- TimeFrame2- All charts will be changed to this timeframe when second label clicked.
- TimeFrame3- All charts will be changed to this timeframe when third label clicked.
- show_SecondTFChangerButton-Show second label
- show_SecondTFChangerButton-Show third label
- show_TFInfo_besides_Label-Show timeframe info besides the label
- Enable_mute -mute sound when the labels clicked
- color
How To Use
In parameter setting window,input info.
If you want to use second and third timeframe changer,enable it.
Click the label,then timeframe of all charts will change.
Click again,then all charts return to previous timeframe.