Bollinger R MT5 Version
- インディケータ
- バージョン: 1.1
- アップデート済み: 5 3月 2022
- アクティベーション: 10

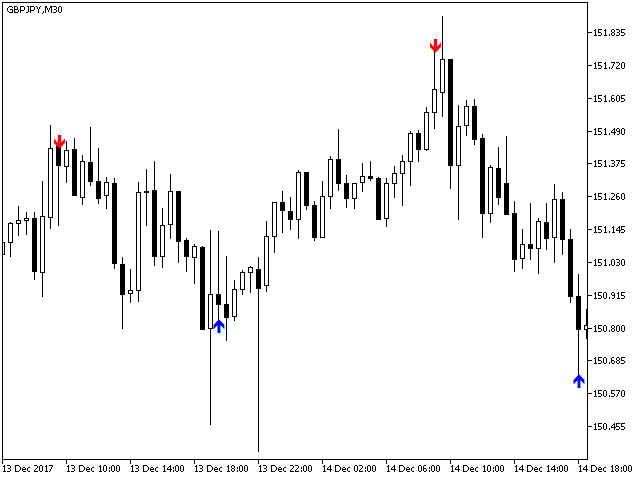
The Bollinger R (Bollinger Reversals) is designed to recognize short term high profitable counter trend patterns from the chart. This system combines both Bollinger Bands and mean reversion to define positions where the market could potentially reverse direction. This is the MT5 version of Bollinger R
Description
Bollinger Bands are well known in the trading community. I have added the concepts mean reversion and "distance between Price and a Moving Average" to help confirm and trade the “bounce” of an upper or a lower band. The system will be more powerful when we use Bollinger Bands with mean reversion System.
Mean reversion trading is often referred to as counter-trend or reversal trading. A mean reversion trader is looking for opportunities where price has moved away from its average (or mean) price significantly. Price frequently pulls away from the moving average and then snaps right back to it. This is the one of the common pattern occurring in the market.
Bollinger R is the only indicator that shows trading signals ahead of time! So Bollinger method with reversion system will return great results.
Features
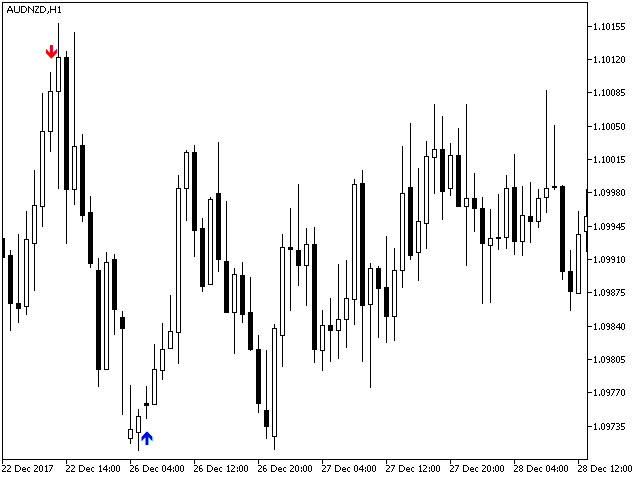
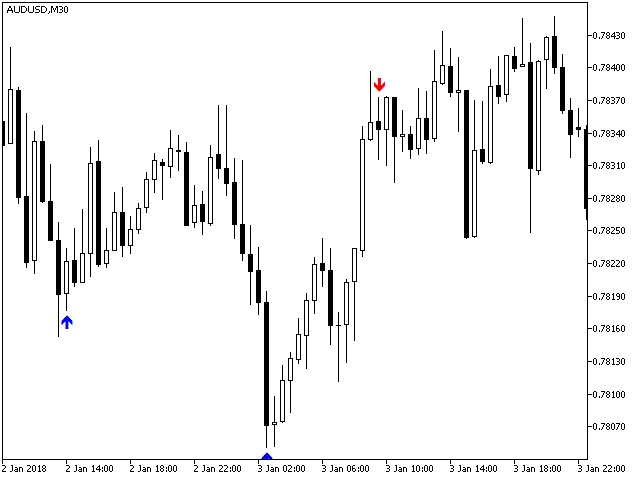
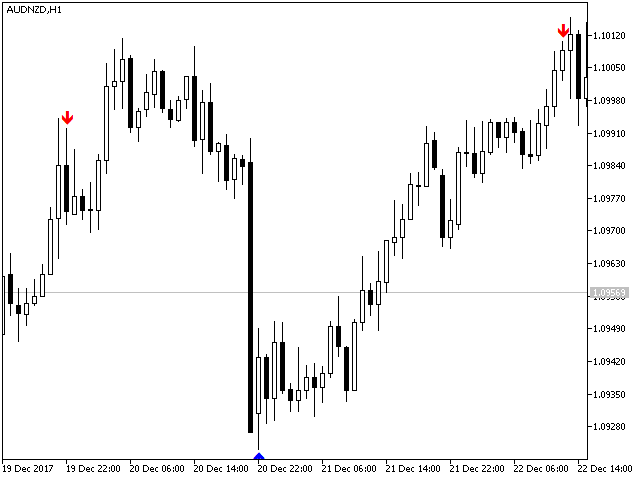
This indicator does not repaint and never changes signals in the history. For all you can see in the history, the indicator will show exactly the same in real time. The indicator does not wait on the reaction of a new candle, but shows the signal (arrow) immediately on the opening of candles. It works on any instrument and any time frame.
Key technical indicators used – Moving average, Bollinger bands, Standard Deviation and Price Channel.
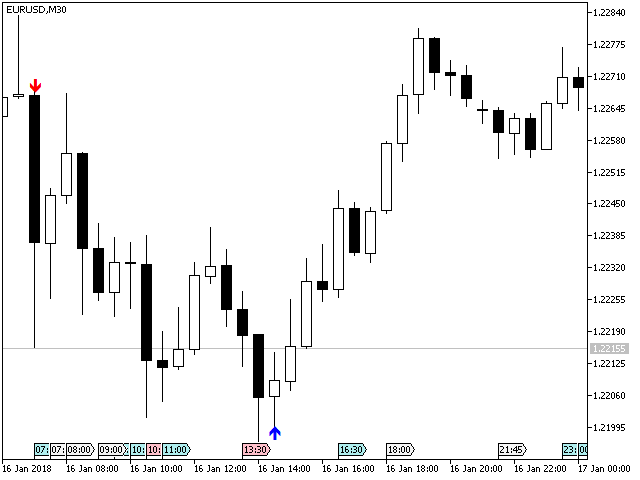
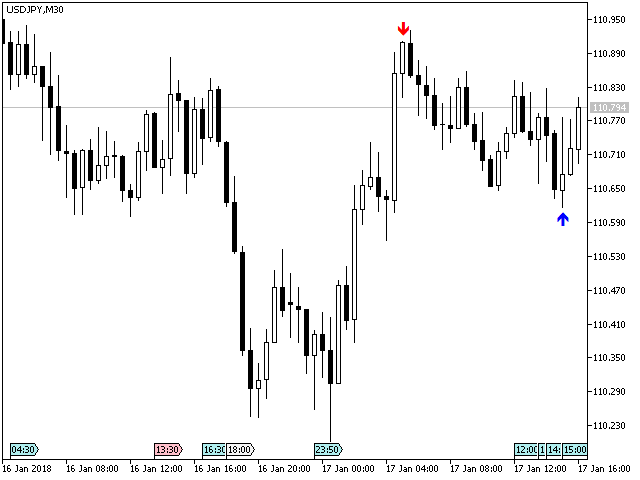
Signal Dashboard - To make the indicator more user friendly, I have added a signal dashboard which gives you an idea about when the last signal occurred and what was the action suggested without referencing back (scrolling/moving back) the chart. You can hide or unhide this feature easily using true or false values in the input settings.
How to trade with Bollinger R
The trading signals of Bollinger R System are clear and easy to trade! The indicator is useful for beginners as well as professional traders. As soon as the new candle opens and the indicator draws an arrow, it means there is an opportunity that the market will go in the direction of the arrow. So a trader can act immediately.
Statistics
While checking the historical performance of Bollinger R indicator, you will get an average of 8.29 signals per symbol on M5 timeframe for a day. Similarly, with M15 is 3.13, M30 is 1.77 and H1 is 1.03.
Input parameters
- Bands Period - Default: 20
- Bands Deviations - Default: 2.0
MetaTrader 4 Version