RGT Footprint Sessions Order Flow
- インディケータ
- バージョン: 2.72

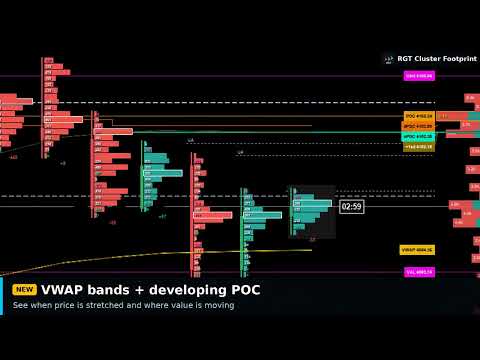
RGT Footprint Sessions Order Flow is the basic edition of RGT Cluster Footprint: see who is buying and selling inside every candle, plus the Asia / London / New York sessions on one clean chart.
WHAT YOU GET
- Footprint / cluster chart: buy and sell volume at every price inside each candle.
- Candle POC, imbalances and single prints.
- Session volume profile with POC / VAH / VAL + previous day levels.
- Session VWAP.
- Asia / London / New York session strips with the range of each session.
- Asia volatility alert: SLOW / NORMAL / VOLATILE vs its 20-day average + the expected London+NY range, measured on the history of your symbol. It tells you how much the market may move, not the direction.
- Delta per candle + CVD panel.
- Live candle panel: buy %, delta, who is in control, live session.
- Auto-fit price scale, zoom-aware columns, clean dark design.
WANT MORE? The full RGT Cluster Footprint adds BUY/SELL signals with live win/loss statistics, Setup Lab (setups measured on your symbol after costs), order book heatmap, PRO and BOX styles, stacked imbalance zones, absorption, POWER TRADE bubbles, unfinished auctions, multi-timeframe delta and alerts (pop-up / sound / push / e-mail).
HOW TO USE: any symbol, best from M1 to M15 (gold, indices, BTC, major pairs). CFD brokers use tick volume and bid/ask tick direction. Session hours are inputs in server time (defaults: brokers on New York+7 server time, e.g. IC Markets).
Analysis tool only: it never opens, modifies or closes trades. Trading involves high risk.