Pure Price Action

AXOS Pure Price Action – Professional Smart Money & Price Action Indicator for MetaTrader 4 (MT4)

Price Action Analysis | Smart Money Concepts (SMC) | ICT-Style Market Analysis | Supply & Demand Zones | Liquidity Sweeps | Break of Structure (BOS) | Change of Character (CHoCH) | Fair Value Gaps (FVG) | Premium & Discount | Volume Analysis | Zone Touch Signals

Introduction

AXOS Pure Price Action is a professional technical analysis indicator developed for MetaTrader 4 (MT4). It combines price action, market structure, liquidity analysis, and concepts commonly associated with Smart Money Concepts (SMC) and ICT-style trading.

The indicator identifies potential supply and demand zones using liquidity sweeps, Break of Structure (BOS), and Premium/Discount validation.

It also provides zone touch signals, estimated volume information, Fair Value Gaps (FVG), market structure references, liquidity levels, and optional Moving Average trend filtering.

AXOS Pure Price Action is designed to help traders understand market structure, identify potential price reaction areas, and evaluate trading opportunities using a structured technical analysis approach.

The indicator can be used on different financial instruments and chart timeframes supported by MetaTrader 4.

AXOS Pure Price Action is a technical analysis indicator intended for manual trading decisions. It does not automatically open, modify, or close trades.

1. Supply and Demand Zone Detection

AXOS Pure Price Action uses a structured process to identify potential supply and demand zones based on price movement and market structure.

With the relevant confirmation filters enabled, the detection process includes the following conditions.

Break of Structure (BOS)

The indicator requires a qualifying Break of Structure before confirming a potential supply or demand zone when BOS confirmation is enabled.

This condition helps incorporate market structure into the zone detection process.

Premium and Discount Validation

The location of each potential zone is evaluated relative to the calculated Premium and Discount range.

When strict Premium/Discount validation is enabled:

  • Demand Zones: Accepted only within the Discount area.

  • Supply Zones: Accepted only within the Premium area.

Potential zones that do not satisfy the enabled conditions are excluded from the chart.

Zone Colors

Confirmed zones are displayed using customizable colors:

  • Demand Zone: OrangeRed by default.

  • Supply Zone: RoyalBlue by default.

The maximum number of active zones displayed on the chart can be adjusted through the indicator settings.

These confirmation conditions provide additional structural context for zone selection.

Supply and demand zones represent potential technical reference areas and do not guarantee future price reactions.

2. Zone Volume Information

Each identified supply or demand zone can display calculated volume information.

The displayed values include:

  • Vol: Calculated volume associated with the zone.

  • B%: Estimated buying volume percentage.

  • S%: Estimated selling volume percentage.

Example

Sell Zone | Vol: 681.9K (B:46% / S:54%)

In this example:

  • Calculated Volume: 681,900

  • Estimated Buying Percentage: 46%

  • Estimated Selling Percentage: 54%

These values are derived from the indicator's internal calculations using available broker price and volume data.

Important Volume Information for MetaTrader 4

In MT4, Forex volume data generally represents Tick Volume, rather than the actual number or monetary value of transactions executed across a centralized exchange.

The displayed buying and selling percentages are estimates calculated by the indicator.

They do not represent:

  • Verified institutional order flow.

  • Exact exchange-level buying and selling transactions.

  • Actual pending institutional order quantities.

  • Complete market-wide trading volume.

Volume information should be interpreted together with market structure, price behavior, and other technical analysis factors.

3. Zone Touch Signals

AXOS Pure Price Action monitors price interactions with previously identified supply and demand zones.

When price revisits a zone, the indicator can display a directional arrow directly on the MT4 chart.

Signal Types

  • Green Arrow: Price interaction with a demand zone.

  • Red Arrow: Price interaction with a supply zone.

One Signal per Continuous Zone Visit

The touch signal system is designed to display one arrow during each continuous visit to a zone.

If the price remains inside the same zone, the indicator avoids displaying repeated arrows for that continuous interaction.

If the price leaves the zone and subsequently returns, another arrow may be displayed.

This approach helps reduce repeated signals while allowing separate zone retests to be identified.

Customizable Signal Settings

Users can:

  • Enable or disable zone touch signals.

  • Customize the buying arrow color.

  • Customize the selling arrow color.

Zone touch signals identify price interactions with technical zones. They do not independently confirm a reversal or guarantee a profitable trading opportunity.

4. Market Structure Analysis

AXOS Pure Price Action includes optional market structure visualization based on historical price swings.

The indicator can identify structural events commonly described as:

Break of Structure (BOS)

A qualifying break of a previously identified structural price level.

BOS can be used as a reference when evaluating the continuation or development of market structure.

Change of Character (CHoCH)

A structural event that may indicate a potential change in market direction.

CHoCH can help traders observe possible changes in price behavior.

Market Structure Settings

Users can:

  • Enable or disable market structure visualization.

  • Adjust the swing detection depth.

  • Combine structural references with supply and demand zone analysis.

Market structure information can be used to evaluate the broader price environment.

BOS and CHoCH are technical classifications based on the indicator's calculation rules and do not guarantee future market direction.

5. Liquidity Levels and Sweeps

AXOS Pure Price Action includes a liquidity analysis component based on selected price swing levels.

Potential liquidity reference levels may be identified near previous highs and lows.

These levels can be marked on the chart using the:

$$$

label.

Liquidity Sweep Detection

When price moves through an identified liquidity level according to the indicator's calculation rules, that level can be marked as swept.

Swept liquidity levels may change to a gray dashed appearance, helping distinguish them from active liquidity reference levels.

Available Liquidity Settings

Users can:

  • Enable or disable liquidity visualization.

  • Display liquidity levels on both sides of the market.

  • Show or hide swept liquidity levels.

  • Adjust liquidity detection parameters.

  • Customize active liquidity level colors.

  • Customize swept liquidity level colors.

Liquidity reference levels are inferred from historical price structure.

They do not confirm the presence, location, size, or execution of actual institutional orders.

6. Fair Value Gaps (FVG)

AXOS Pure Price Action includes optional Fair Value Gap detection.

Fair Value Gaps are identified using relationships between price candles and are displayed as technical reference areas on the MT4 chart.

Bullish Fair Value Gap

A bullish FVG represents a potential price imbalance area identified during an upward price movement.

Bearish Fair Value Gap

A bearish FVG represents a potential price imbalance area identified during a downward price movement.

Bullish and bearish FVGs are displayed using separate customizable colors to distinguish them from supply and demand zones.

FVG Settings

Users can configure:

  • FVG visibility.

  • Filled or unfilled FVG display.

  • Bullish FVG color.

  • Bearish FVG color.

  • Maximum number of active FVG areas.

Fair Value Gaps represent potential price imbalance areas based on the indicator's internal calculation rules.

An identified FVG does not guarantee that price will return to the area, fill the gap, or react in a particular direction.

7. Premium, Discount and Equilibrium

AXOS Pure Price Action includes Premium and Discount analysis based on a calculated price range.

The calculated range is divided into three reference areas.

Premium

The upper portion of the calculated price range.

Equilibrium

The 50% midpoint of the calculated price range.

Discount

The lower portion of the calculated price range.

The range is determined using the indicator's configured lookback parameters.

Strict Premium/Discount Validation

When strict Premium/Discount validation is enabled, these reference areas are also used during supply and demand zone selection.

Under this condition:

  • Demand Zones: Must be located within the Discount area.

  • Supply Zones: Must be located within the Premium area.

Potential zones outside the required areas are excluded when the corresponding validation condition is active.

Visual Display

Premium, Equilibrium, and Discount reference levels can be displayed directly on the MT4 chart using customizable colors.

The visual display of these reference levels can be controlled separately from the zone validation settings.

This allows users to apply Premium/Discount conditions to zone detection while independently managing the visual appearance of the chart.

8. Moving Average Trend Filter

AXOS Pure Price Action includes an optional Moving Average trend filter.

The filter provides additional trend-based conditions for the indicator's analysis.

Available Settings

InpUseMAFilter

Enables or disables the Moving Average filter.

InpMAPeriod

Defines the Moving Average calculation period.

InpMAMethod

Selects the Moving Average calculation method.

Default Configuration

The default Moving Average configuration uses a:

200-Period Exponential Moving Average (EMA 200)

Users can adjust these parameters according to their preferred analytical approach.

The Moving Average filter can be combined with supply and demand zones, market structure, and other analytical components.

9. Zone Detection and Management

AXOS Pure Price Action provides additional controls for supply and demand zone detection.

Available Parameters

InpRequireBOS

Enables or disables the BOS confirmation requirement.

InpMaxActiveZones

Defines the maximum number of active supply and demand zones displayed on the chart.

InpMinMoveBars

Defines the movement-related bar requirement used by the zone detection algorithm.

InpSwingLookback

Specifies the historical lookback period used for swing analysis.

InpMaxBars

Defines the maximum number of historical bars processed by the indicator.

These settings allow users to customize the zone detection process and control the number of zones displayed.

Changing detection parameters may affect which zones are identified.

10. Indicator Input Settings

AXOS Pure Price Action provides configurable input parameters for its technical analysis components.

Trend Filter

  • InpUseMAFilter: Enable or disable the Moving Average filter.

  • InpMAPeriod: Moving Average period.

  • InpMAMethod: Moving Average calculation method.

Market Structure

  • InpShowStructure: Show or hide market structure.

  • InpSwingDepth: Swing detection depth.

Liquidity

  • InpShowLiquidity: Enable or disable liquidity visualization.

  • InpBothSidesLiq: Display liquidity levels on both sides of the market.

  • InpShowSweptLiq: Show or hide swept liquidity levels.

  • InpLiqBars: Liquidity detection parameter.

  • InpLiqColor: Active liquidity level color.

  • InpLiqSweptColor: Swept liquidity level color.

Zone Touch Signals

  • InpShowTouchSignals: Enable or disable zone touch arrows.

  • InpBuyArrowColor: Buying arrow color.

  • InpSellArrowColor: Selling arrow color.

Fair Value Gaps

  • InpShowFVG: Show or hide Fair Value Gaps.

  • InpFVGFill: Enable or disable filled FVG display.

  • InpBullFVGColor: Bullish FVG color.

  • InpBearFVGColor: Bearish FVG color.

  • InpMaxActiveFVG: Maximum number of active FVG areas.

Premium and Discount

  • InpShowPDZones: Show or hide Premium/Discount reference levels.

  • InpStrictPDRule: Enable or disable strict Premium/Discount validation.

  • InpPDCookback: Lookback parameter used for Premium/Discount calculations.

  • InpPremiumColor: Premium area color.

  • InpEQColor: Equilibrium reference color.

  • InpDiscountColor: Discount area color.

Zone Detection

  • InpRequireBOS: BOS confirmation requirement.

  • InpMaxActiveZones: Maximum number of active zones.

  • InpMinMoveBars: Movement-related bar requirement.

  • InpSwingLookback: Swing analysis lookback.

  • InpMaxBars: Maximum historical bars processed.

Supply and Demand Visual Settings

  • InpBuyZoneColor: Demand zone color.

  • InpSellZoneColor: Supply zone color.

  • InpBorderColor: Zone border color.

  • InpTextColor: Zone label and volume text color.

These settings allow users to customize the indicator's analytical components and chart appearance according to their preferences.

11. Supported Markets and Timeframes

AXOS Pure Price Action can be applied to financial instruments supported by MetaTrader 4, including:

  • Forex currency pairs.

  • Gold (XAUUSD).

  • Cryptocurrencies.

  • Stock indices.

The availability of individual instruments depends on the broker.

Supported MT4 Timeframes

The indicator can be used on different MetaTrader 4 chart timeframes, including:

  • M1 – 1 Minute

  • M5 – 5 Minutes

  • M15 – 15 Minutes

  • M30 – 30 Minutes

  • H1 – 1 Hour

  • H4 – 4 Hours

  • D1 – Daily

  • W1 – Weekly

  • MN1 – Monthly

The indicator's behavior may vary depending on:

  • Financial instrument.

  • Chart timeframe.

  • Broker price and volume data.

  • Available historical data.

  • Selected input settings.

Users should evaluate the indicator on their preferred instruments and timeframes before making live trading decisions.

12. Suggested Analysis Workflow

A possible workflow for using AXOS Pure Price Action is:

  1. Open MetaTrader 4 and select a trading instrument and timeframe.

  2. Apply AXOS Pure Price Action to the chart.

  3. Review the identified liquidity levels and market structure.

  4. Examine supply and demand zones confirmed by the enabled detection conditions.

  5. Review the Premium/Discount location of the identified zones.

  6. Observe price behavior when it approaches a previously identified zone.

  7. Examine any displayed zone touch signals.

  8. Consider relevant Fair Value Gaps, estimated volume information, and optional Moving Average trend filtering.

  9. Evaluate possible trading setups using an independent trading plan.

  10. Determine entry, stop loss, take profit, and position size according to personal risk management rules.

The indicator provides technical reference information to support manual analysis.

It does not automatically determine, open, modify, or close trading positions.

13. Important Information and Risk Disclaimer

AXOS Pure Price Action is a technical analysis tool, not an automated trading system.

Supply and demand zones, liquidity levels, market structure events, Fair Value Gaps, and directional arrows are generated according to the indicator's internal calculation rules.

The appearance of a zone or signal does not guarantee:

  • A price reversal.

  • Trend continuation.

  • A successful trading opportunity.

  • A profitable transaction.

Volume values and estimated buying and selling percentages are calculated using available broker data.

In MetaTrader 4, Forex volume generally represents Tick Volume rather than complete exchange-level transaction volume.

These estimates should not be interpreted as verified institutional order flow or complete market-wide buying and selling activity.

Liquidity reference levels are inferred from price structure and do not confirm actual institutional order quantities.

Historical chart examples and previous price reactions do not guarantee future results.

Trading Forex, gold, indices, cryptocurrencies, and other financial instruments involves financial risk.

Users should:

  • Evaluate current market conditions.

  • Test the indicator with their selected settings.

  • Apply appropriate position sizing.

  • Use suitable stop-loss and risk management methods.

  • Make independent trading decisions.

AXOS Pure Price Action does not automatically open, modify, or close trades.

14. Installation and Setup – MetaTrader 4

Follow these steps to install AXOS Pure Price Action:

  1. Open the MetaTrader 4 (MT4) trading platform.

  2. Install the MT4 version of AXOS Pure Price Action from the MQL5 Market.

  3. Open the chart of your preferred financial instrument.

  4. Select the desired timeframe.

  5. Locate AXOS Pure Price Action in the MT4 Navigator window.

  6. Attach the indicator to the chart.

  7. Configure the supply and demand zone detection parameters.

  8. Enable or disable BOS confirmation and Premium/Discount validation as needed.

  9. Adjust market structure, liquidity, and Fair Value Gap settings.

  10. Configure zone touch signals and arrow colors.

  11. Adjust the optional Moving Average trend filter.

  12. Customize zone colors and other visual settings.

  13. Click OK to activate the indicator.

The indicator analyzes the available historical chart data and displays the technical elements enabled in its settings.

The quality and quantity of available historical data may influence the displayed results.

15. Why Choose AXOS Pure Price Action?

AXOS Pure Price Action combines multiple technical analysis concepts in one MT4 indicator.

Key Features

  • Developed for MetaTrader 4.

  • Automated identification of potential supply zones.

  • Automated identification of potential demand zones.

  • Break of Structure (BOS) confirmation option.

  • Premium/Discount zone validation.

  • Market structure analysis.

  • Change of Character (CHoCH) visualization.

  • Liquidity reference level detection.

  • Liquidity sweep identification.

  • Optional display of swept liquidity levels.

  • Fair Value Gap detection.

  • Separate bullish and bearish FVG colors.

  • Zone touch signals with directional arrows.

  • One arrow per continuous zone visit.

  • Additional signals for separate zone retests.

  • Calculated zone volume information.

  • Estimated buying and selling percentages.

  • Optional Moving Average trend filter.

  • Customizable zone detection parameters.

  • Adjustable swing analysis settings.

  • Customizable chart colors and visual elements.

  • Support for multiple financial instruments.

  • Compatibility with different MT4 timeframes.

  • Designed for manual technical analysis.

  • No automatic trade execution.

AXOS Pure Price Action provides a structured visual approach to evaluating price action, market structure, liquidity, and potential supply and demand areas.

AXOS Development Team

AXOS PURE PRICE ACTION

ANALYZE THE STRUCTURE.

IDENTIFY THE LIQUIDITY.

DISCOVER SUPPLY AND DEMAND ZONES.

UNDERSTAND PRICE ACTION.

TRADE WITH A PLAN.

AXOS Pure Price Action – Professional Smart Money, Liquidity & Price Action Analysis for MetaTrader 4.


おすすめのプロダクト
Quantum Balance is a modern arrow indicator that identifies key price reversal points in the market with high accuracy. It is based on a combination of WPR (Williams %R) and RSI (Relative Strength Index), which allows you to identify overbought/oversold moments and enter trades at points of maximum potential. The indicator analyzes price dynamics and market conditions, generating signals only when several confirming factors coincide. This reduces the number of false signals and increases tradin
Indicator for binary options arrow is easy to use and does not require configuration works on all currency pairs, cryptocurrencies buy signal blue up arrow sell signal red down arrow tips do not trade during news and 15-30 minutes before their release, as the market is too volatile and there is a lot of noise it is worth entering trades one or two candles from the current period (recommended for 1 candle) timeframe up to m 15 recommended money management fixed lot or fixed percentage of the depo
The indicator shows the potential trend direction by cyclical-wave dependence. Thus, all the rays of the intersection will be optimal rays, in the direction of which the price is expected to move, taking into account the indicator period. Rays can be used as a direction for potential market movement. But we must not forget that the approach must be comprehensive, the indicator signals require additional information to enter the market.
Introducing the POWER TRADE Indicator Created by a small group of experienced traders with years of profitable experience in the financial markets, the Power Trade Indicator is a plug-and-play trading tool designed to help traders spot high-quality setups with ease and confidence. What It Does: It provides powerful entry signals, profit-taking zones, and rebound areas — giving you a complete view of where price action is most likely to move next. The indicator reacts in real time, al
Simple indicator that supports decision makers. You will have the candles directions for different timeframes on your screen. That will allowed you to be one more scenario to analyze before you open your orders. In case you would like to have more details, just let me know.. so we can add it to the chart. Multicurrency that in inform you the directions for multi-timeframes!
「ダイナミック・スキャルピング・オシレーター」は、MT4向けの高度なカスタムCrypto_Forexインジケーターです。効率的な取引ツールです! - 新世代のオシレーター - 使い方は画像をご覧ください。 - ダイナミック・スキャルピング・オシレーターは、適応型の売られ過ぎ/買われ過ぎゾーンを備えています。 - オシレーターは、動的な売られ過ぎ/買われ過ぎエリアから正確なエントリーポイントを見つけるための補助ツールです。 - 売られ過ぎ値:グリーンラインより下、買われ過ぎ値:オレンジラインより上。 - このインジケーターは、プライスアクションパターンと組み合わせるのに最適です。 - 標準的なオシレーターよりもはるかに正確です。 - PCとモバイルの両方でアラート機能付き。 高品質のトレーディングロボットとインジケーターをご覧になるにはここをクリックしてください! これは、このMQL5ウェブサイトでのみ提供されるオリジナル製品です。
Forex Gump
Andrey Kozak
2.4 (5)
Forex Gump is a fully finished semi-automatic trading system. In the form of arrows, signals are displayed on the screen for opening and closing deals. All you need is to follow the instructions of the indicator. When the indicator shows a blue arrow, you need to open a buy order. When the indicator shows a red arrow, you need to open a sell order. Close orders when the indicator draws a yellow cross. In order to get the most effective result, we recommend using the timeframes H1, H4, D1. There
Lord Auto Fibonnaci is a free indicator for Meta Trader, in order to show the most famous chart in the financial market known as "Fibonnaci". As we can see in the images below, the fibonnaci table will automatically analyze the graph for you, with trend factors through percentage, almost infallible use, you can always work when the percentage is low or high, start shopping and sales on time, great for analyzing entries! In the images below we can see an example in gold in H4, where we are at
FREE
Quantum Falcon Signal Free is a smart visual trading indicator for MetaTrader 4 designed for Forex and Gold traders. The indicator combines: • Trend analysis • RSI momentum confirmation • MACD momentum filtering • ATR volatility filtering • Higher timeframe confirmation • Smart exit signal detection Main Features: • Smart Buy and Sell signals • Exit Buy / Exit Sell alerts • Real-time dashboard on chart • Professional candle arrows • Multi-timeframe trend confirmation • ATR market volatility filt
FREE
About
Tatiana Savkevych
About - Forex indicator. This trend indicator is used to determine the current trend in price movement, making it clear in which direction it is better to open a position: buy or sell. The About trend indicator is displayed on the chart and moves in parallel with the price. The Forex About trend indicator allows you to determine in time a change in the direction of price movement, thereby minimizing the likelihood of capital loss. In trading practice, various combinations of About and other ind
Trend PA
Mikhail Nazarenko
5 (3)
The Trend PA indicator uses   Price Action   and its own filtering algorithm to determine the trend. This approach helps to accurately determine entry points and the current trend on any timeframe. The indicator uses its own algorithm for analyzing price changes and Price Action. Which gives you the advantage of recognizing, without delay, a new nascent trend with fewer false positives. Trend filtering conditions can be selected in the settings individually for your trading style. The indicator
The Stochastic Oscillator is a momentum indicator that uses support and resistance levels. The term "stochastic" refers to the point of a current price in relation to its price range over a period of time. You can use a New Stochastic in the same way as classical one: Overbought and Oversold areas to make a Buy or Sell orders. This new indicator shows all variety of Fibonacci Levels (from 23.6 to 76.4) which can be used as Overbought and Oversold levels as well as points to close an open positio
This product is a part of  ON Trade Waves Patterns Harmonic Elliot Wolfe you can test free version on EURJPY from this link  Wolf Waves Indicator ウルフウェーブを発見しよう - あなたの究極の取引ツール! どんな時間軸でも簡単にウルフウェーブを見つけるための強力なツールを探していますか?もう探す必要はありません!私たちのウルフウェーブインジケーターは、その仕事を簡単にこなします。なぜこのインジケーターがあなたにぴったりか、以下でご紹介します。 主な特徴: 自動検出: ウルフウェーブインジケーターは、複雑なアルゴリズムを使用して、チャート上のキーポイントを自動的に見つけ、対応するラインを描画します。手動でパターンを探す手間が不要です。 使いやすさ: このインジケーターはシンプルなデザインで、経験豊富なトレーダーからウルフウェーブ初心者まで、誰でも簡単に利用できます。 高精度: 数多くのウルフウェーブインジケーターの中で、当社のものは完璧さの
Matrix is a Forex arrow indicator. Displays signals simply and clearly! The arrows show the direction of the transaction, and are colored accordingly, which can be seen in the screenshots. As you can see, trading with such an indicator is easy. I waited for an arrow to appear in the desired direction - I opened a deal. An arrow formed in the opposite direction - closed the deal. The indicator also displays the lines with the help of which the arrow signals are formed, taking into account the int
Binary Scalper 6 – MT4用の強力なバイナリーオプション指標 Binary Scalper 6 は、 MetaTrader 4 (MT4) 向けに設計された、先進的なトレンド分析とバイナリーオプショントレーディングツールです。すべてのレベルのトレーダーに適しており、明確なシグナルと統計を提供します。 主な特徴: トレンド検出 :トレンド市場を正確に特定し、明確な方向性を提示。 すべての通貨ペアに対応 :お好みの市場で取引可能。 あらゆるタイムフレームに対応 :1分足から月足まで。 1キャンドルの満期シグナル :迅速かつ簡潔なトレーディング機会。 統計情報を表示 :市場のパフォーマンスに関する貴重なデータを提供。 バッファ矢印 :取引エントリーを視覚的にサポート。 使用方法: MQL5 フォルダをダウンロードし、MetaTrader 4 ディレクトリに移動します。 こちら からダウンロードできます。
The principle of this indicator is very simple: detecting the trend with Moving Average, then monitoring the return point of graph by using the crossing of Stochastic Oscillator and finally predicting BUY and SELL signal with arrows, alerts and notifications. The parameters are fixed and automatically calculated on each time frame. Example: If you install indicator on EURUSD, timeframe M5: the indicator will detect the main trend with the Moving Average on this timeframe (for example the Moving
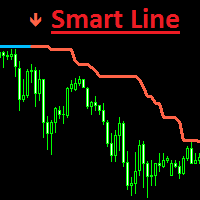
Smart Line is a trend indicator. It helps you find trend reversal points. This trading strategy is designed for trend trading. The indicator algorithm accurately determines the trend on various trading instruments, at different time intervals. The Smart Line indicator can be used as an additional tool, or as the main one. The color of the indicator lines changes depending on the current trend, as well as built-in indicators of possible entries in the position, indicated by arrows. Parameters
ROYAL DUTCH SKUNK USES THE TREND WAVE INDICATOR AND IT CAN IDENTIFY THE BEGINNING AND THE END OF A NEW WAVE TREND MOVEMENT. AS AN OSCILLATOR, THE INDICATOR IDENTIFIES THE OVERBOUGHT AND OVERSOLD ZONES. IT WORKS GREAT TO CATCH THE SHORT TERM PRICE REVERSALS AND USES A MARTINGALE STRATEGY TO CLOSE ALL TRADES IN PROFIT. USE DEFAULT SETTINGS ON H1 OR HIGHER TIME FRAME ON ANY PAIR FOR MORE ACCURATE TRADES WHY THIS EA : Smart entries calculated by 6 great strategies The EA can be run on even a $20000
Borders Arrow Signals MT4 The Ultimate Non-Repainting Smart Arrow Trading Indicator Borders Arrow Signals MT4 is a professional-grade MetaTrader 4 indicator designed for traders who demand precision, reliability, and high-probability trade entries. Built for the MT4 trading platform, it delivers intelligent Buy and Sell signals based on advanced market analysis while maintaining exceptional speed and efficiency. Unlike conventional arrow indicators that repaint historical signals and create fals
Binary Options Assistant (BOA) ICE Signals Indicator provides signals based on gkNextLevel Binary Options Strategy.  Indicators: 2 Bollinger Bands & Stochastic Stop missing trades, stop jumping from chart to chart looking for trade set-ups and get all the signals on 1 chart! U se any of the BOA Signals Indicator with the  Binary Options Assistant (BOA) Multi Currency Dashboard .   All BOA Signal Indicator settings are adjustable to give you more strategy combinations. The signals can be seen
FREE
The Perspective Trend indicator tracks the market trend with very high reliability. All intersection points will be ideal points at which the direction of the trend changes. Sharp price fluctuations, as well as noise around averaged prices, are ignored. Signal points, places where color changes, can be used as points of potential market reversal. The indiuctor algorithm implements a kind of technical analysis based on the idea that the market is cyclical in nature. This development can be used b
「Auto FIBO Pro」Crypto_Forex インジケーターは、取引の補助ツールとして最適です。 - インジケーターは、フィボナッチ レベルとローカル トレンド ライン (赤色) を自動的に計算してチャート上に配置します。 - フィボナッチ レベルは、価格が反転する可能性のある重要な領域を示します。 - 最も重要なレベルは、23.6%、38.2%、50%、61.8% です。 - リバーサル スキャルピングやゾーン グリッド取引に使用できます。 - Auto FIBO Pro インジケーターを使用して、現在のシステムを改善する機会も多数あります。 - Info Spread Swap Display があり、接続されている外国為替ペアの現在のスプレッドとスワップを表示します。 - ディスプレイには、アカウントの残高、エクイティ、マージンも表示されます。 - Info Spread Swap Display は、チャートのどのコーナーにも配置できます。 高品質のトレーディングロボットとインジケーターをご覧になるにはここをクリックしてください! これは、この MQL5 ウェブサイ
期間限定オファー 「限定ローンチ価格」 「バージョン2.0後に値上げ予定」 Currencies Gold Momentum Flow Dashboard — 市場の強さを瞬時に把握 複数時間足(M5〜D1)で、為替とゴールドのモメンタムをリアルタイムで表示する高性能ダッシュボード。 マルチタイムフレームROC分析 トレードシグナル搭載 通貨強弱分析 ヒートマップ表示 アラート+ワンクリック切替 市場が見えるようにトレードする 多くのトレーダーは“見えていない”。 他の人が見逃すものを見抜く これは単なるインジケーターではありません。 精度重視のトレーダー向け 優位性を内蔵 すべてが変わる ️ 多くの人が遅れて気づく真実 インジケーターでは稼げない。 「理解」が利益を生む。 今すぐ優位性を手に入れる ダウンロード Currencies Gold Momentum Flow Dashboard
Smart Reversal Signal  is a professional indicator for the MetaTrader 4 platform; it has been developed by a group of professional traders. This indicator is designed for Forex and binary options trading. By purchasing this indicator, you will receive: Excellent indicator signals. Free product support. Regular updates. Various notification options: alert, push, emails. You can use it on any financial instrument (Forex, CFD, options) and timeframe. Indicator Parameters Perod - indicator calculat
Beast Entry Signal for MetaTrader 4 Beast Entry Signal is a professional MetaTrader 4 indicator designed to help traders identify potential Buy and Sell opportunities with clear, easy-to-read arrow signals. It combines advanced momentum and trend analysis to deliver accurate entry signals while keeping the chart clean and simple. The indicator uses a non-repainting signal system, ensuring that once a candle closes, the signal remains fixed. This gives traders confidence when reviewing historical
This tool was developed and designed for binary options trading It has been noticed that it can also be used in stock markets and forex. There are 2 options for trading binary options using this indicator Option 1 We open a deal on the next candle after a signal for one cut of the current period Buy or Sell depending on the signal The blue up arrow is Buy The red down arrow is Sell / We enter only on the first signal on the next candle and ignore the rest / Option 2 We enter on a signal for the
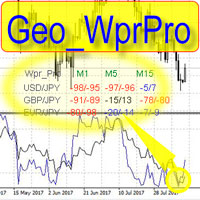
WPR by Profile, or WPR for Professionals Geo_WprPro is one of the well-known currency profile indicators. It simultaneously displays two WPR indicators with different parameters in the matrix form on all timeframes of multiple currency pairs forming the currency profile . As follows from the description, " WPR is a leading indicator that often goes ahead of the price chart. The oscillator frequently reaches extreme values before the price reversal as if anticipating that event: it almost always
The Trend Privacy indicator is easy to set up and works on all pairs and all time frames. Identifies the mainstream and helps analyze the market at a selected time frame It is extremely important for any trader to correctly determine the direction and strength of the trend movement. Unfortunately, there is no single correct solution to this problem. Many traders trade on different time frames. For this reason, the received signals are perceived subjectively. Trend indicators provide an opportu
トレーディング ゲームをターボチャージする準備はできましたか? Bullish Wave は、収益性の高いトレーダーになるために必要な優位性を提供する、完全に自動化された取引ソフトウェアです。 強力な分析、リアルタイムの市場データ、直感的なツールを備えています。 Bullish Wave を使用すると、プロのように外国為替市場で楽に取引することができます。 当社の完全に自動化された EA は、業界をリードする 2 つのインジケーター、Bears Power インジケーターと ADX インジケーターで動作します。 統合されたストップロス機能とテイクプロフィット機能を使用して、これまで以上に迅速かつ安全にポジションを開きます。 間違いを犯すのをやめて、Bullish Wave でプロのように取引を始めましょう! エキスパートは、2020 年 1 月 1 日から 2023 年 1 月までの EURUSD M15 履歴データでテストされました (MT4 での 3 年間のバックテスト)。 MT4 プラットフォームで EUR USD - M15 時間枠の履歴を正しくダウンロードしたことを
FREE
The Riko Trend indicator is a revolutionary trend trading and filtering solution with all the important features of a trend tool built into one tool! The Riko Trend indicator is good for any trader, suitable for any trader for both forex and binary options. You don’t need to configure anything, everything is perfected by time and experience, it works great during a flat and in a trend. The Riko Trend indicator is a technical analysis tool for financial markets that reflects the current price f
このプロダクトを購入した人は以下も購入しています
「Scalper Vault」は、デイトレードで安定した成果を目指すトレーダーのために設計された、強力かつ充実した機能を備えたトレーディングシステムです。 この高精度なインジケーターは、それ単体で完結するトレーディングシステムとして機能し、FXやバイナリーオプションのトレーダーに、機関投資家レベルの分析を提供します。 ご購入後、ぜひご連絡ください。 トレードのヒントに加え、豪華なボーナスをプレゼントいたします! 「Scalper Vault」を活用すれば、勘に頼った判断や複雑な手動分析は不要です。使いやすいトレード手法に集中し、純粋に「エントリー・決済」という実行フェーズに専念できます。 高精度なトレンドフォロー・シグナル:中核となるアルゴリズムが市場構造を分析し、主要なトレンド方向に沿った高確率なシグナルを提示します。これにより、誤ったエントリーを大幅に削減できます。 精度の高い天井・底の検知:市場の勢いが尽きたポイントをスキャンし、反転の可能性が高いゾーンを特定します。 ギャン(Gann)理論に基づく売買ゾーン:数学的な「ギャン・レベル」を自動的にチャート上に描画します。機関投資家
通貨強さウィザードは、取引を成功させるためのオールインワン ソリューションを提供する非常に強力な指標です。このインジケーターは、複数の時間枠のすべての通貨のデータを使用して、このまたはその外国為替ペアのパワーを計算します。このデータは、使いやすい通貨インデックスと通貨パワーラインの形式で表され、特定の通貨のパワーを確認するために使用できます。 必要なのは、取引したいチャートにインジケーターを接続することだけです。インジケーターは、取引する通貨の実際の強さを示します。このインジケーターは、トレンドに合わせて取引するときに有利に利用できる売買高の圧力の極値も示します。このインジケーターには、フィボナッチに基づく可能なターゲットも表示されます。 このインジケーターは、PUSH 通知を含むあらゆるタイプのアラートを提供します。 購入後ご連絡下さい。私の取引のヒントをあなたと共有し、素晴らしいボーナスインジケーターを無料で提供します! 幸せで有益な取引をお祈りします。
PRO Renko Systemは、特別にRENKOチャートを取引するために設計された高精度の取引システムです。 これは、様々な取引商品に適用することができる普遍的なシステムです。 システムは効果的に正確な逆転信号へのアクセスを与えるいわゆる市場の騒音を中和する。 表示器は非常に使いやすく、信号の生成に責任がある1つの変数だけがあります。 あなたは簡単にお好みの任意の取引ツールとレンコバーのサイズにツールを適応させることができます。 私はいつもあなたが私のソフトウェアで収益性の高い取引を支援するために余分なサポートを提供する準備ができています! 私はあなたに幸せで収益性の高い取引をしたいです! ご購入後にご連絡ください! 私はあなたに私のレンコチャートジェネレータを送信します。 私はまた、私の個人的な推奨事項やシステムの他のモジュールを無料で共有します!
SR Liquidity は、市場の流動性が集中し、価格が最も強く反応する「隠れたゾーン」を可視化するために設計されたトレーディング指標です。こうした流動性の高いエリアは強力なサポート(支持)およびレジスタンス(抵抗)レベルとして機能し、市場が反転する可能性が最も高いポイントを明確に示してくれます。 単なる一般的なサポートラインやレジスタンスラインを描画するのではなく、「SR Liquidity」は実際の価格変動を分析し、売りと買いの圧力が集中するゾーンを特定します。これらは、市場の真の動きを牽引する「流動性のプール(溜まり場)」そのものです。それらをチャート上に直接可視化することで、価格が実際に反応する前に、その動きを予測することが可能になります。つまり、このインジケーターは価格の方向性が変わる可能性を予測するのです。生のプライスアクションを、市場の重要な水準(転換点となり得るポイント)を示す、明確で実用的なロードマップへと変換してくれます。 このインジケーターは、FX、株価指数、貴金属、仮想通貨など、あらゆる銘柄や時間足で使用可能です。 ご購入後、取引手順や無料の優れた追加インジケ
M1 Sniper
Oleg Rodin
4.97 (30)
M1 SNIPER は使いやすいトレーディングインジケーターシステムです。M1時間足向けに設計された矢印インジケーターです。M1時間足でのスキャルピングのためのスタンドアロンシステムとして、また既存のトレーディングシステムの一部としても使用できます。このトレーディングシステムはM1時間足での取引に特化して設計されていますが、他の時間足でも使用できます。元々、この手法はXAUUSDとBTCUSDの取引用に設計しましたが、他の市場においても役立つと考えています。 インジケーターのシグナルは、トレンドの方向と逆方向に取引できます。インジケーターのシグナルを利用して両方向に取引するのに役立つ特別な取引テクニックをご紹介します。この手法は、特別な動的なサポートとレジスタンスの価格帯を利用することに基づいています。 ご購入後、M1 SNIPER矢印インジケーターをすぐにダウンロードできます。さらに、M1 SNIPERツールのすべてのユーザーに、以下のスクリーンショットに表示されているApollo Dynamic SRインジケーターを無料で提供しています。この2つのインジケーターを組み合わせることで
SIO Oscillator:自己最適化型セミバリアンス・インバランス・オシレーター インジケーターをご購入いただくと、それをベースにしたエキスパートアドバイザー(EA)を無料でお受け取りいただけます。 多くのオシレーターは、すべての価格変動を同じように扱います。SIOは上昇圧力と下降圧力を分けて捉え、その間のインバランス(不均衡)を測定することで、買い手と売り手のどちらが本当に相場を支配しているかを示します。インバランスが極値に達すると、SIOはエントリー、ストップロス(Stop Loss)、テイクプロフィット(Take Profit)の水準を伴う明確なシグナルを表示します。 SIOの大きな特長は、固定パラメーターに頼らないことです。内蔵の自己最適化機能が、現在の銘柄と時間足に適したパラメーターを継続的に探索し、使用する前に検証します。 2つのシグナルモード 平均回帰(Mean Reversion):インバランスの極値で取引し、均衡への回帰を狙います。 トレンドフォロー(Trend Following):持続的で優勢なインバランスの方向に取引します。 自動モード:最適化機能が直近のデ
Quant Direction
Georgios Kalomoiropoulos
Quant Direction は、3次元の市場分析ツールです。完全に客観的なアルゴリズムベースの市場分析を提供し、様々なパラメータにわたる正確なパーセンテージ偏差を同時に算出します。高度なAI搭載モデリングツールで開発され、厳密なテストを経て開発されたこのアルゴリズムは、かつてない精度で市場を分析するように設計されています。プラットフォーム上では、あらゆる通貨ペアや金融商品を分析できます。 短期取引、デイトレード、スイングトレードなど、どのような取引スタイルに も、Quant Directionは最適な選択肢です。 オペレーターの本当の利点 Quant Directionの真の利点は、感情、眼精疲労、過剰分析を完全に排除できる点にあります。方向性を探るために何十ものチャートを手作業で精査したり、自分の好みを常に疑ったりする必要がなくなります。このシステムは、8つの時間間隔(5ヶ月から月単位まで)をミリ秒単位で処理します。あらゆる瞬間に市場を支配している主体を正確に明らかにし、常に成功確率が最も高い方向で取引できるようにします。 市場分析の3つの側面 このアルゴリズムは市場を3つの
トレンドラインプロ   市場の真の方向転換点を理解するのに役立ちます。この指標は、真のトレンド反転と主要プレーヤーが再び参入するポイントを示します。 分かりますか     BOSライン   複雑な設定や不要なノイズなしに、より長い時間足でのトレンドの変化と重要なレベルを把握できます。シグナルは再描画されず、バーが閉じた後もチャート上に残ります。 VERSION MT 5     -     RFI LEVELS PRO インジケーター と組み合わせることで、その潜在能力を最大限に発揮します。 インジケーターが示す内容: 本当の変化   トレンド(BOSライン) 一度シグナルが現れたら、それは有効です!これは、リペイント機能を持つインジケーターとの重要な違いです。リペイント機能を持つインジケーターは、シグナルを発した後、それを変更し、資金の損失につながる可能性があります。これにより、より高い確率と精度で市場に参入できます。また、矢印が現れた後、目標値(利益確定)に達するか、反転シグナルが現れるまで、ローソク足の色を変更する機能もあります。 繰り返しエントリ       主要プレーヤーの
Hidden Cycles
Lev Vladimirovic Marushkin
5 (1)
The Only 100% Universal Tool! Stop trading against nature! This is your chance to secure the only indicator rooted in the absolute laws that govern the entire universe. Most tools guess—this one reveals the truth. Buy another toy or buy the truth. Your choice... Based on Universal Laws — NOT Some Guy’s Algorithm: Let the market adjust to the Hidden Cycles Geometry — not the other way around. Most indicators are based on a man-made formula. They often lag, fail over time, or need constant re-o
Price & Time Market Structure Indicator A professional market structure tool that analyzes waves through both price and time — not price alone. Main Description NeoWave PRO is a professional market structure indicator for MetaTrader 4 designed for traders who want to move beyond traditional one-dimensional wave tools such as ZigZag, swing indicators, and basic high/low systems. Most wave indicators analyze only one thing: Price. But a real market wave is not only a price movement. A true wave de
CRT Multi-Timeframe Market Structure & Liquidity Sweep Indicator Non-Repainting | Multi-Asset | MT5 Version Available MT5 Version:   https://www.mql5.com/en/market/product/162075 Full User Guide — explains what each feature does and why:   https://www.mql5.com/en/blogs/post/767525 Quick Start User Guide  — explains how to configure and in what order:  https://www.mql5.com/en/blogs/post/767540 Indicator Overview CRT Ghost Candle HTF Fractal is a complete institutional-grade market structure too
Neuro Poseidon is a new indicator by Daria Rezueva. It combines precise trading signals with adaptive TP/SL levels - creating best possible trades as a result! Message me and get  Neuro Poseidon Assistant  as a gift to automize your trading process! What makes it stand out? 1. Proven profitability on all assets and timeframes 2. Only confirmed BUY and SELL signals present on the chart 3. Adaptive TP & SL levels generated by the software for each trade 4. Easy to understand - suitable for all
Super Signal – Skyblade Edition プロ仕様のノンリペイント / ノーラグ・トレンドシグナルシステム。卓越した勝率を実現 | MT4 / MT5 対応 1分足、5分足、15分足などの低い時間足で最も効果を発揮します。 主な特徴: Super Signal – Skyblade Edition は、トレンド取引に特化したスマートなシグナルシステムです。マルチレイヤーのフィルターロジックを用いて、明確な方向性と実際のモメンタムに支えられた強力なトレンドのみを検出します。 このシステムは 天井や底を予測するものではありません 。次の3つの条件がすべて満たされた場合にのみシグナルを発生させます: 明確なトレンド方向 モメンタムの増加 健全なボラティリティ構造 市場セッションに基づく流動性分析と組み合わせることで、シグナルの精度とタイミングがさらに向上します。 シグナルの特性: すべての矢印シグナルは 100% 非リペイント / 遅延なし 一度出現したシグナルは固定され、点滅・消失しません チャート上の矢印、情報パネル、ポップアップ通知、音声アラート、プッシュ通知
Gann Made Easy は、ミスター・ギャンの理論を使用した取引の最良の原則に基づいた、プロフェッショナルで使いやすい外国為替取引システムです。 W・D・ガン。このインジケーターは、ストップロスとテイクプロフィットレベルを含む正確な買いと売りのシグナルを提供します。 PUSH通知を利用して外出先でも取引可能です。 ご購入後、取引方法の説明と優れた追加インジケーターを無料で入手するには、私にご連絡ください! おそらく、ギャンの取引手法についてはすでに何度も聞いたことがあるでしょう。通常、ギャンの理論は初心者のトレーダーだけでなく、すでにある程度の取引経験がある人にとっても非常に複雑なものです。なぜなら、ギャンの取引手法は理論的にはそれほど簡単に適用できるものではないからです。私はその知識を磨き、最良の原則を私の外国為替インジケーターに組み込むために数年を費やしました。 このインジケーターは非常に簡単に適用できます。必要なのは、それをチャートに添付し、簡単な取引推奨事項に従うだけです。このインジケーターは常に市場分析の仕事を行い、取引の機会を探します。適切なエントリーポイントを検出す
ゴールドラッシュ・トレンド・アロー・シグナル ゴールドラッシュ・トレンド・アロー・シグナル 指標は、XAU/USDにおける高速・短期スキャルパー向けに最適化された、正確でリアルタイムのトレンド分析を提供します。 1分足専用に設計されたこのツールは、明確なエントリーポイントを示す方向矢印を表示し、スキャルパーが変動の激しい市場状況でも自信を持って取引できるよう支援します。 この指標は、PRIMARY(主要)とSECONDARY(補助)のアラート矢印で構成されています。PRIMARYシグナルは、トレンドの方向転換を示す白と黒の方向矢印であり、SECONDARYシグナルは、PRIMARY矢印が示す方向を確認し、潜在的なエントリーポイントを示す青と赤の矢印です。 注意:トレンド方向の変化後にPRIMARYアラート矢印が1つだけ表示される場合、複数のSECONDARY青/赤矢印が表示される点に注意が必要です。SECONDARYシグナルは、シグナル基準を満たす任意のローソク足後に表示されます。したがって、長期的なトレンド移動の場合、画面に多くのSECONDARY矢印が表示されます(添付の
現在30%OFF! 初心者やエキスパートトレーダーのためのベストソリューション! このダッシュボードソフトウェアは、28の通貨ペアで動作しています。それは私達の主要な指標(高度な通貨の強さ28と高度な通貨インパルス)の2に基づいています。それは全体の外国為替市場の大きい概観を与えます。それは、すべての(9)時間枠で28の外国為替ペアのための高度な通貨の強さの値、通貨の動きの速度と信号を示しています。チャート上で1つのインディケータを使用して市場全体を観察し、トレンドやスキャルピングの機会をピンポイントで見つけることができたら、あなたのトレードがどのように改善されるか想像してみてください。 このインディケータには、強い通貨と弱い通貨の識別、潜在的な取引の識別と確認がより簡単になるような機能が搭載されています。このインディケータは、通貨の強さや弱さが増加しているか減少しているか、また、すべての時間枠でどのように機能しているかをグラフィカルに表示します。 新機能として、現在の市場環境の変化に適応するダイナミックなマーケットフィボナッチレベルが追加され、すでに当社のAdvanced
現在20%OFF! 初心者やエキスパートトレーダーに最適なソリューションです。 このインディケータは、エキゾチックペア・コモディティ・インデックス・先物など、あらゆるシンボルの通貨の強さを表示することに特化したインディケータです。金、銀、原油、DAX、US30、MXN、TRY、CNHなどの通貨の強さを表示するために、9行目にどのシンボルでも追加することができます。独自の機能を多数搭載し、新しい計算式を採用したため、ユニークで高品質、かつ手頃な価格のトレーディングツールとなっています。新しいトレンドやスキャルピングチャンスのトリガーポイントを正確に把握することができるため、あなたのトレードがどのように改善されるか想像してみてください。 ユーザーマニュアル:ここをクリック   https://www.mql5.com/en/blogs/post/708876 すべての時間枠に対応します。あなたはすぐにトレンドを見ることができるようになります! 新しいアルゴリズムに基づいて設計されているため、潜在的な取引の特定と確認がより簡単になります。これは、8つの主要通貨と1つのシンボルの強弱
Scalper Inside PRO は日中トレンドの分析を助け、エントリー前にトレードを組み立てられるインジケーターです。中核となるのは、相場をより正確に読むための3つの専用ストラテジー。シグナルが出た瞬間に方向を自動で判断し、主要な価格帯を計算するので、想定エントリーポイント、予想ストップロス、複数の利確レベルを前もって確認できます。詳細なパフォーマンス統計が、各銘柄とストラテジーが過去にどう機能したかを示し、今の相場に合った資産選びを助けます。単体のスキャルピングツールとしても、あなたのシステムの一部としても、自作 EA のベースとしても使えます。MetaTrader 4 プラットフォームで動作します。 インジケーターはエントリー、3つの利確レベル - TP1、TP2、TP3、そして任意のストップロスをチャート上に直接表示します。自作の矢印インジケーターを接続し、その統計と収益性を検証することも可能です。 ご購入後は直接ご連絡ください。専用のボーナス add-ons、実トレードでの活用に関する追加情報、そしてご自身のトレードシステムや EA への正しい接続のサポートをお渡しします
Cycle Sniper
Elmira Memish
4.39 (36)
Please contact us after your purchase and we will send you the complimentary indicators to complete the system Cycle Sniper is not a holy grail but when you use it in a system which is explained in the videos, you will feel the difference. If you are not willing to focus on the charts designed with Cycle Sniper and other free tools we provide, we recommend not buying this indicator. We recommend watching the videos about the indiactor and system before purchasing. Videos, settings  and descri
Elliott Wave Trend was designed for the scientific wave counting. This tool focuses to get rid of the vagueness of the classic Elliott Wave Counting using the guideline from the template and pattern approach. In doing so, firstly Elliott Wave Trend offers the template for your wave counting. Secondly, it offers Wave Structural Score to assist to identify accurate wave formation. It offers both impulse wave Structural Score and corrective wave Structure Score. Structural Score is the rating to sh
これはほぼ間違いなく、MetaTraderプラットフォームで見つけることができる最も完全な調和価格形成自動認識インジケーターです。 19種類のパターンを検出し、フィボナッチプロジェクションをあなたと同じように真剣に受け止め、潜在的逆転ゾーン(PRZ)を表示し、適切なストップロスとテイクプロフィットレベルを見つけます。 [ インストールガイド | 更新ガイド | トラブルシューティング | よくある質問 | すべての製品 ] 19の異なる調和価格形成を検出します プライマリ、派生および補完フィボナッチ投影(PRZ)をプロットします 過去の価格行動を評価し、過去のすべてのパターンを表示します この指標は、独自の品質とパフォーマンスを分析します 適切なストップロスとテイクプロフィットのレベルを表示します ブレイクアウトを使用して適切な取引を通知します すべてのパターン比をグラフにプロットします 電子メール/音声/視覚アラートを実装します スコット・M・カーニーの本に着想を得て、この指標は最も純粋で急を要するトレーダーのニーズを満たすように設計されています。ただし、トレードを容易にする
現在30%OFF! このダッシュボードは、複数のシンボルと最大9つのタイムフレームで動作するソフトウェアの非常に強力な部分です。 このソフトは、弊社のメインインジケーター(ベストレビュー:Advanced Supply Demand)をベースにしています。    Advanced Supply Demand ダッシュボードは、素晴らしい概要を提供します。それは示しています。  ゾーン強度評価を含むフィルタリングされた需給値。 ゾーン内/ゾーンへのPips距離。 ネストされたゾーンがハイライトされます。 選択されたシンボルの4種類のアラートを全ての(9)時間枠で提供します。 それはあなたの個人的なニーズに合わせて高度に設定可能です。 あなたの利益! すべてのトレーダーにとって最も重要な質問です。 市場に参入するのに最適なレベルはどこか? 成功のチャンスとリスク/リターンを得るために、強力な供給/需要ゾーン内またはその近くで取引を開始します。 損切りの最適な位置はどこですか? 最も安全なのは、強力な供給/需要ゾーンの下/上にストップを置くことです。 最適な利益
Miraculous Indicator Binary & Forex v3 StrategySafe Miraculous Indicator Binary & Forex v3 StrategySafe は、明確なシグナル、強力な確認ツール、そして Binary と Forex 市場で使える体系的な取引アプローチを求めるトレーダー向けのプロフェッショナル指標です。 v3 では、MIR Dashboard、Miraculous Confirmation Dashboard、GANN Law、Square of 9 レベル、GANN 角度、そしてより高度な Forex モードが搭載されています。 主な特徴 Binary と Forex の両方に対応。 MIR Dashboard による素早い市場分析。 Miraculous Confirmation Dashboard によるエントリー確認。 Forex 分析用の GANN Law drawing lines。 Square of 9 のライン、レベル、方向表示。 1x1 GANN Angle によるトレンド圧力の確認。 Entry I
MT4用 Ultimate AIO ICT Concept Indicator: Smart Money Concepts を自動的にマスターする 毎日何時間も手作業でチャートを分析することに疲れていませんか? AIO ICT Concept インジケーターは、Smart Money Concepts をマスターするための完全なオールインワンソリューションです。手動によるテクニカル分析の推測や感情的な疲労を排除するように設計されたこの強力なアルゴリズムツールは、最も重要なプライスアクション要素をチャート上に直接、自動的にマッピングします。 市場の方向性と上位足のバイアスをマスターする (Master Market Direction and High Timeframe Bias): 市場がどこに向かっているかを知ることは、戦いの半分です。当社の高度な Market Structure マッピングと Change in State of Delivery (CISD) の検出により、真の市場トレンドを即座に特定できます。日次および週次の方向性のバイアスを一目で簡単に判断できます。スイン
Cycles Predictor Indicator This indicator uses past market cycles to predict future price movements. The indicator scans through past data and considers  combinations  of cycles. When cycles  coincide  at the same future date/time then it is considered a valid future prediction. The predictions are drawn as vertical lines on the right side of the chart in the future. A prediction will often result in type of candle (ex. bull or bear) and/or a reversal point (ex. bottom or top) forming at this ex
フィボナッチ・トレンド・マーカー (Fibonacci Trend Marker) は、現在のローソク足が過去のローソク足の高値-安値(High-Low、HL)範囲に対してどのように振る舞うかを、フィボナッチ・リトレースメントレベルを用いて分析するトレンド指標です。トレンドの強さを視覚的に追跡し、ローソク足の色の変化を通じてトレンドの弱まりや反転の可能性を示します。 特徴: トレンド重視のトレーダーのために設計されており、フィボナッチレベルに基づいてトレンドの変化を素早く検出します。 市場のボラティリティが十分で、3~5本のローソク足が明確な動きを形成する場合、あらゆる時間枠で有効です。 ローソク足のサイズはチャートのスケールに自動的に適応し、ズーム時にも正確な表示を保証します。 現在のローソク足をリアルタイムで分析することでトレンド変化に高い感度を持ち、M1やM5の時間枠でのスキャルピングに最適です。 取引方法: エントリー: 前の閉じたローソク足の色が変化した後にポジションを開きます。例えば、赤いローソク足の後に青で閉じた場合、上昇トレンドのシグナルとなり、買い(Buy)の取引
"The Squeeze indicator attempts to identify periods of consolidation in a market. In general the market is either in a period of quiet consolidation or vertical price discovery. By identifying these calm periods, we have a better opportunity of getting into trades with the potential for larger moves. Once a market enters into a "squeeze," we watch the overall market momentum to help forecast the market direction and await a release of market energy." Modified TTM Squeeze Indicator is a modifica
Indicator plots price cycle blocks and sends signals with smart volume confirmation. Price cycles and fractals are combined to determine the demand/supply blocks. The indicator can be used alone or combined with other Cycle Indicators Inputs: Period: Recommended value is between 35 and 55( Which are Set 1 and Set 2 periods of cycle sniper ) Engulfing: If true, you will be able to see the engulfing bar confirmation. Volume Filter: True (The  arrow comes with volume confirmation ) Videos with dif
ForexTrendMT4 Indicator: A Reliable Tool for Market Tracking The ForexTrendMT4 indicator offers reliable market trend tracking, filtering out sudden fluctuations and market noise. This tool helps identify trends and signals favorable entry points into the market using arrows. It is suitable for both scalping on shorter timeframes and long-term trading strategies. Based on the principles of technical analysis, ForexTrendMT4 takes into account the cyclical nature of the market. Key Features and A
KURAMA GOLD SIGNAL PRO MT4版 ゴールドのサインに、目で見えるトレード計画を。 ゴールドのサインが出た。利確はどこか。損切りはどこか。エントリー前に何を確認すべきか。 自動注文を使いたい方へ:MT5用EA版もあります Gold Signal Pro EA with Auto TP SLは、Gold Signal Proエンジンにサイン選別、自動注文、自動TP/SLとリスク設定を組み合わせた別売りのMT5用EAです。GOLDのM5・M15向け。サイン確認だけの使い方と自動注文を選べます。EAは単独で動作し、このインジケーターの購入には含まれません。MT4では動作しません。 EA版の機能・画面・価格を見る KURAMA GOLD SIGNAL PROは、その判断材料をチャートに集約します。XAUUSDのM5、M15向けに、売買サイン、自動計算TP/SL、3段階のサイン評価、注意すべき相場条件を知らせるMARKETパネルを搭載。 セットアップ、決済目安、相場の注意点を一か所で確認。情報を集める手間を減らし、トレードの判断に集中できます。 買い切り購入者限定特典 AI
作者のその他のプロダクト
AXOS Smart Money Supply and Demand AXOS Smart Money Supply and Demand is a technical indicator for MetaTrader 5 that identifies potential supply and demand zones using price movement and swing analysis. The indicator displays calculated volume information for each zone, including estimated buying and selling percentages. It also includes an optional Moving Average trend filter and configurable zone detection settings. The indicator can be used for technical analysis on Forex, Gold, indices and c
FREE
AXOS Smart Money Supply and Demand – MetaTrader 4 (MT4) 対応のプロフェッショナルな需給ゾーン分析インジケーター スマートマネー分析 | 需給ゾーンの検出 | 出来高分析 | 買い圧力・売り圧力の推定 | 移動平均線トレンドフィルター | ゾーンの自動更新 | 複数市場・時間足に対応 はじめに AXOS Smart Money Supply and Demand は、 MetaTrader 4 (MT4) 向けに開発されたテクニカルインジケーターです。価格変動とスイング高値・安値(Swing High / Swing Low)の分析に基づき、潜在的な供給ゾーンと需要ゾーンを検出します。 本インジケーターは、各ゾーンに関連する計算上の出来高情報を表示し、推定買い比率と推定売り比率も確認できます。また、オプションの移動平均線(Moving Average)トレンドフィルターと、カスタマイズ可能なゾーン検出設定を備えています。 MetaTrader 4 で利用可能な外国為替(Forex)、ゴールド、株価指数、暗号資産のチャート分析に使用で
FREE
AXOS Color Trend – Smart Trend Following & Scalping Indicator for MT5 Advanced Trend Confirmation | Color-Based Trend Visualization | Smart Market Filters | Scalping | Forex | Gold | Crypto Introduction AXOS Color Trend is an advanced trend-following and scalping indicator developed for MetaTrader 5. It combines multiple technical calculations, price action principles, trend-strength analysis, volatility filtering, and higher-timeframe confirmation to help traders identify potential trading oppo
FREE
AXOS PRO – MT5対応・リペイントなしの高度なトレンド確認インジケーター 複数インジケーターによる確認 | プライスアクション | 上位時間足との整合性 | FX | ゴールド | 暗号資産 はじめに AXOS PRO は、MetaTrader 5向けに開発された高度なトレンド確認インジケーターです。複数のテクニカル指標とプライスアクション分析を組み合わせ、潜在的なトレンド転換やトレンド継続の取引機会を特定します。 従来のインジケーターのように市場の反転を早期に予測しようとするのではなく、AXOS PROは市場方向の変化が確認されるまで待機し、その後にエントリーシグナルを生成します。 システムはチャート上に明確なBUY(買い)およびSELL(売り)の矢印を直接表示し、トレーダーが潜在的なエントリーポイントを把握し、現在のトレンドを支持する条件が維持されているかを評価できるようにします。 AXOS PROは、FX通貨ペア、ゴールド(XAUUSD)、暗号資産市場向けに設計されています。 主な機能 リペイントなしの確定シグナル: シグナル足の確定後、表示された矢印が固定されるように
AXOS Pure Price Action AXOS Pure Price Action は、MetaTrader 5 向けのテクニカル分析インジケーターです。プライスアクション(Price Action)、市場構造、流動性分析、およびスマートマネーコンセプト(Smart Money Concepts、SMC)や ICT スタイルのトレーディングに一般的に関連する概念を組み合わせています。 このインジケーターは、流動性スイープ(Liquidity Sweeps)、構造のブレイク(Break of Structure、BOS)、およびプレミアム/ディスカウント(Premium/Discount)の検証を使用して、潜在的な供給ゾーンと需要ゾーンを特定します。また、ゾーンへの接触シグナル、推定出来高情報、フェアバリューギャップ(Fair Value Gaps、FVG)、市場構造の参照情報、およびオプションの移動平均線フィルターも提供します。 このインジケーターは、手動によるテクニカル分析を支援することを目的としています。取引を自動的に実行するものではありません。 1. 供給ゾーンと需要ゾー
AXOS Liquidity Sweep – MT5向けスマート需給ゾーンとリアルタイム流動性分析インジケーター リアルタイム流動性分析 | 需給ゾーン | リクイディティスイープ検出 | スマートマネーコンセプト(SMC)| 出来高分析 | BUY・SELLシグナル はじめに AXOS Liquidity Sweep は、MetaTrader 5向けに開発された高度なテクニカル分析インジケーターです。リアルタイムの流動性分析、需給ゾーン(Supply & Demand)、プライスアクション、スイング構造、出来高情報を組み合わせ、トレーダーが潜在的な取引機会を特定できるよう支援します。 トレードにおける大きな課題の一つは、どの流動性レベルが重要なのかを判断することです。 多くのトレーダーはサポート、レジスタンス、供給ゾーン、需要ゾーンを特定できますが、どの流動性エリアに注目すべきかを判断するのは簡単ではありません。 AXOS Liquidity Sweepは、関連するゾーンを自動的に特定し、流動性に関連する価格変動を監視し、リクイディティスイープの検出条件が満たされた際に方向性を示す矢
AXOS Golden EA 9.06 – MT5対応のゴールド専用プロフェッショナル・モメンタム&トレンド自動売買EA 高度なモメンタム分析 | トレンドフォロー戦略 | M15内部市場分析 | ATRベースの動的ストップロス&テイクプロフィット | パーセンテージベースのリスク管理 | プロップファーム口座への対応を想定 | マーチンゲール不使用 | グリッド不使用 | ヘッジ不使用 | スキャルピング不使用 はじめに AXOS Golden EA 9.06 は、MetaTrader 5(MT5)でのゴールド(XAUUSD)取引に特化して開発された、高度な自動売買エキスパートアドバイザー(EA)です。 本EAは、モメンタム分析、トレンドフォローの原則、ボラティリティに基づくリスク管理を組み合わせ、さまざまな市場環境における潜在的な取引機会を特定します。 積極的な損失回復システムに依存する一部の自動売買ロボットとは異なり、AXOS Golden EAはマーチンゲール、グリッド取引、ヘッジ戦略を使用しません。 また、スキャルピングEAでもありません。高頻度取引や小さな利益を狙う取引の繰
フィルタ:
レビューなし
レビューに返信