Delta Footprint Chart

  • インディケータ
  • Yuxin Lyu
    Yuxin Lyu
    I build chart and volume tools for MetaTrader 5 — session volume profiles, order-flow style strength visuals, and lightweight manual trading panels.
  • バージョン: 1.12
  • アップデート済み: 5 11月 2026
  • アクティベーション: 10

Overview

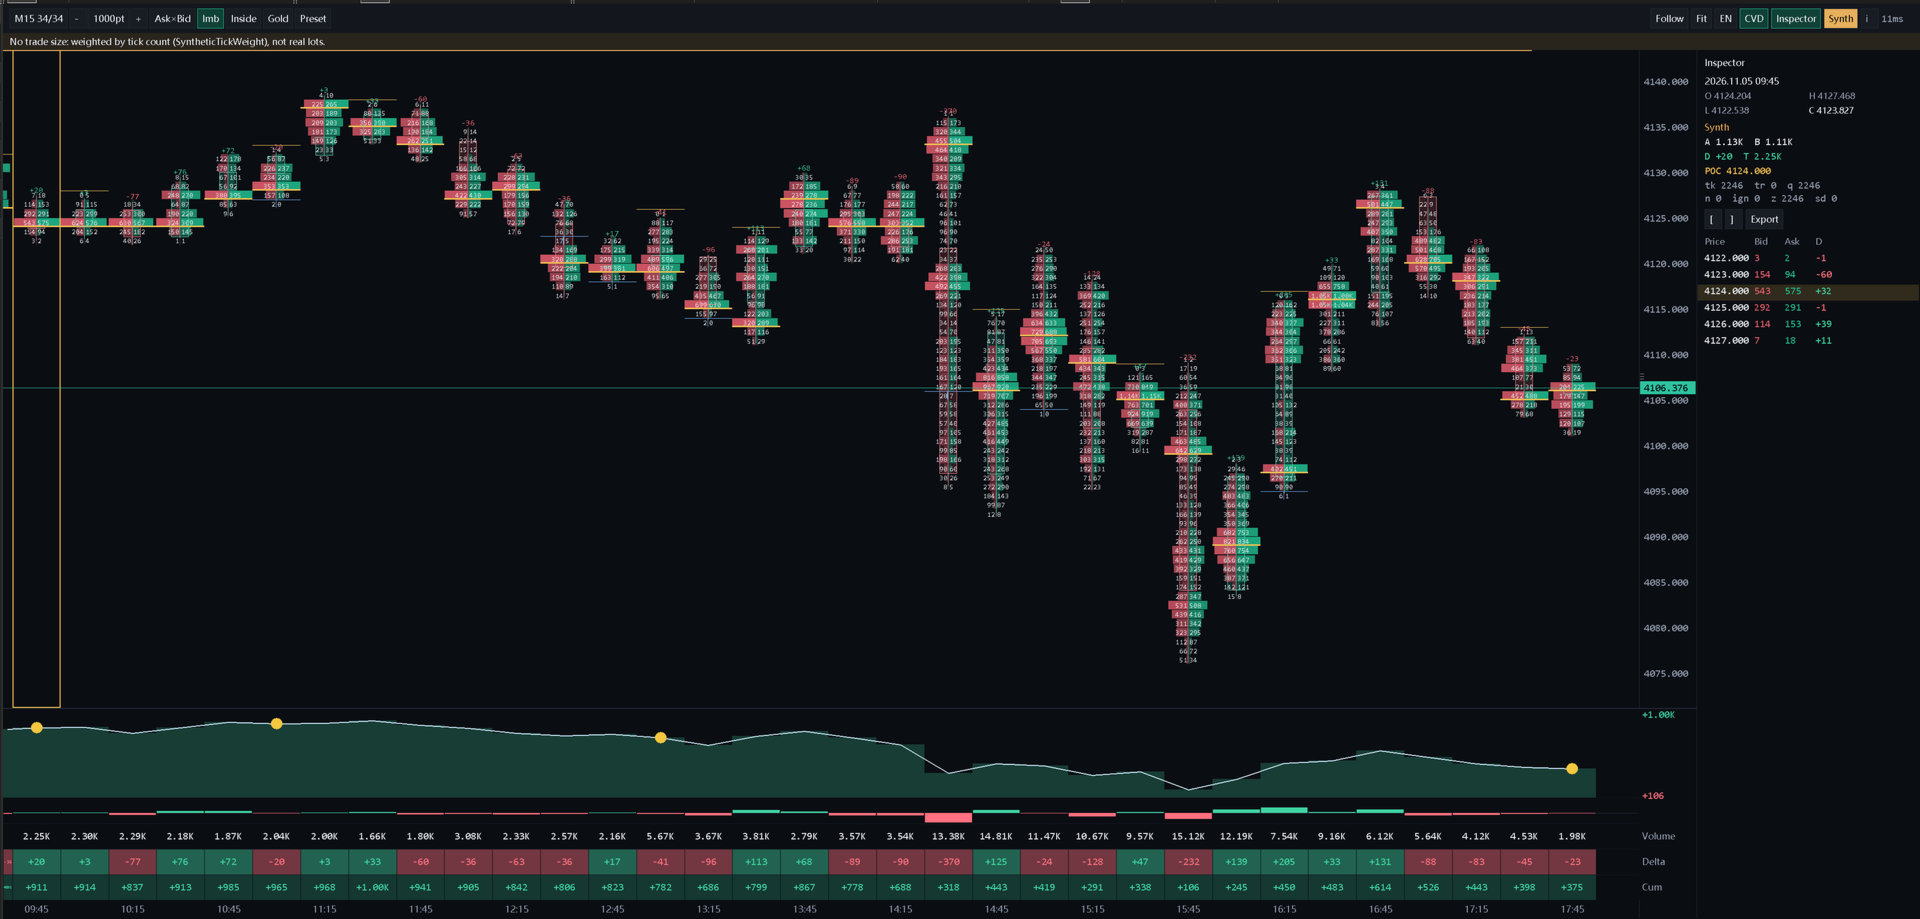
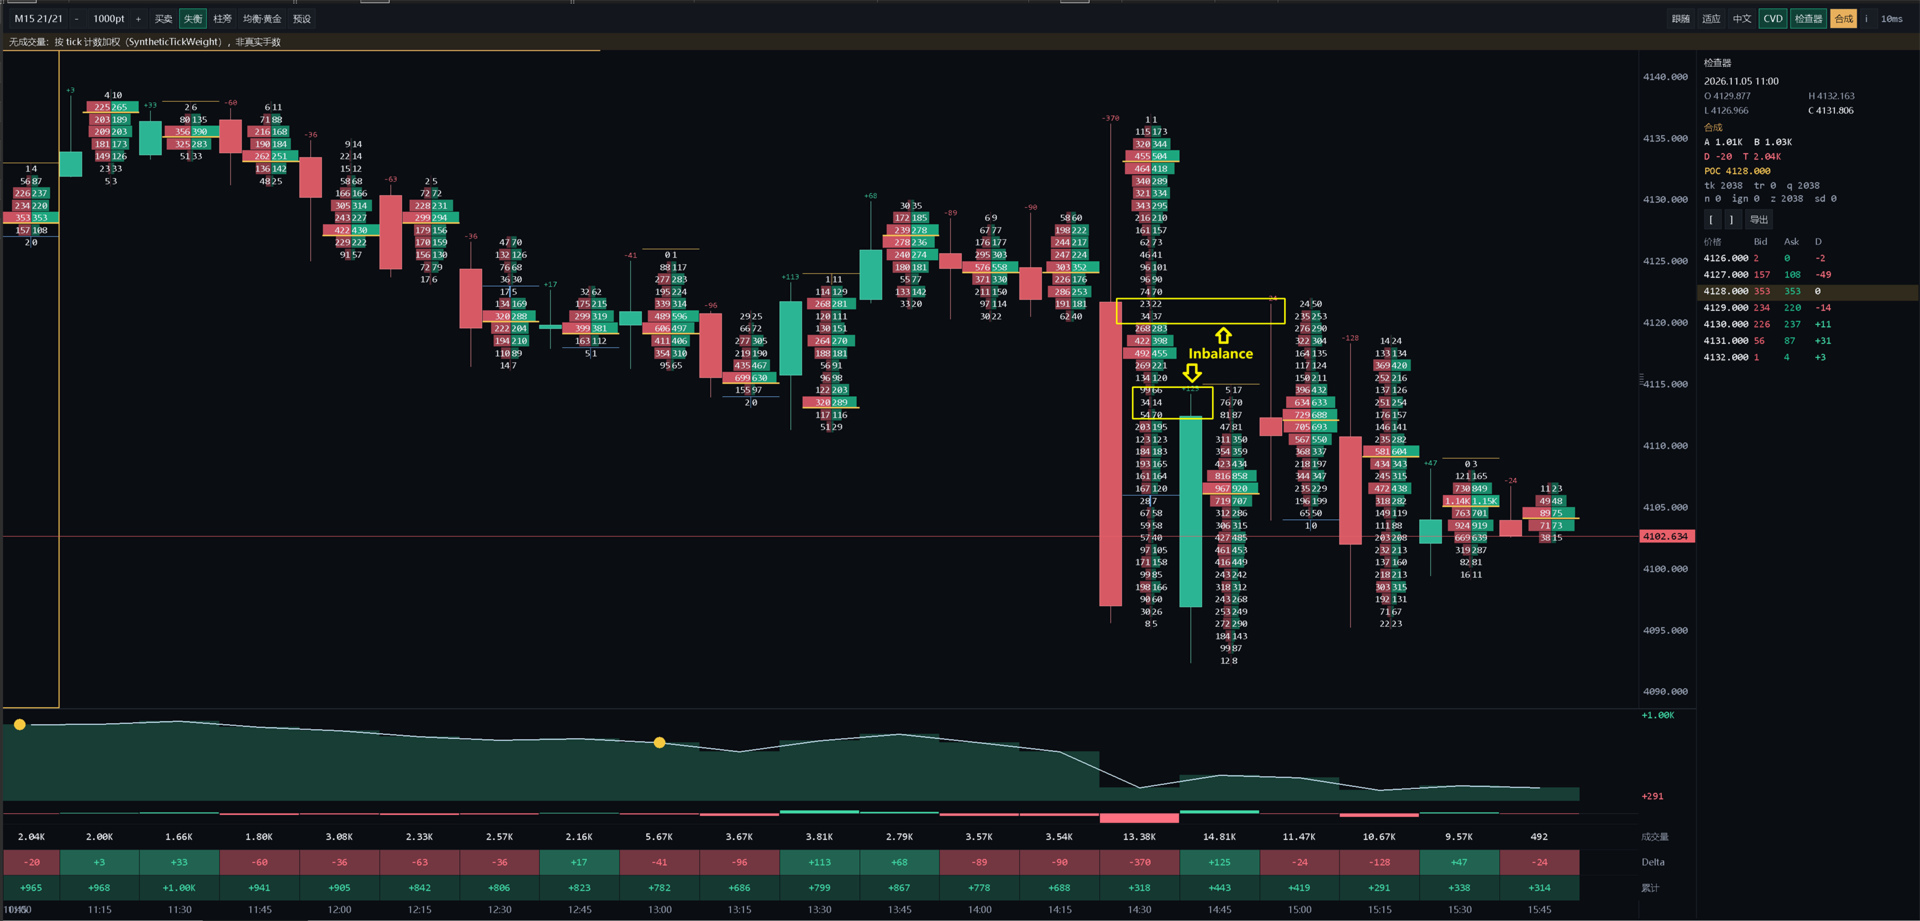
Delta Footprint Chart is a Canvas-based footprint chart indicator for MetaTrader 5. It renders self-drawn candles, numeric Buy×Sell footprint ladders, cumulative volume delta (CVD), and a selected-bar inspector — all on a single bitmap overlay. No chart objects, no buffer plots, no layered windows.

Data Source & Honest Limits

Order-flow style views are built from your broker ticks ( CopyTicks / range APIs). Aggressor side uses AggressorRule_v1. A tick takes the Trade path only when it simultaneously carries Last, volume, and TICK_FLAG_BUY or TICK_FLAG_SELL . Otherwise the quote path synthesizes direction from bid/ask/last movement. The data source chip (amber = Synthetic, green = Trade, blue = Mix) on the toolbar tells you which path produced the numbers.

  • Not exchange Level 2
  • Not a full-market tape
  • Not institutional order flow

This is an honest synthetic footprint for FX/CFD traders — never marketed as exchange depth.

Main Features

  • Footprint ladders — Inside each candle, every price row displays Bid volume (left) and Ask volume (right). Cell heat maps relative volume intensity. When the cell is wide enough, full Ask×Bid digits appear; when narrower, a signed Delta; when too small, a colored glyph.
  • Imbalance & Stacked levels — Rows where one side dominates by a configurable ratio (default 3:1) are highlighted. Consecutive imbalanced rows in the same direction get a stack marker — a visual cue for absorption or exhaustion.
  • POC (Point of Control) — The price row with the highest total volume in each bar is marked with an amber bar.
  • CVD strip — A resizable cumulative volume delta curve below the chart, scaled to the visible window. Optional delta histogram and a three-row data table (Volume / Delta / Cumulative) aligned under each bar.
  • CVD Divergence — Optional yellow circles marking bars where close and CVD moved in opposite directions — a neutral observation, not a trade signal.
  • Inspector panel — Right-side table showing the selected bar's OHLC, total Ask/Bid/Delta, POC price, tick breakdown (trade vs. quote vs. neutral vs. ignored), and a scrollable price-level ladder.
  • Delta table — Per-bar Volume, Delta, and Cumulative Delta values in a compact strip beneath the CVD curve.
  • Independent viewport — Wheel zoom, Shift+Left pan (time + price), price-axis drag to scale. Bars can widen up to 280px each.
  • Instrument presets — One-tick switch between Gold / FX / Index profiles (row size, spread cap, CVD height, colors).
  • Performance presets — Balanced / Gold / Lite / Manual — tune CPU vs. history depth.
  • Bilingual UI — English / Chinese toolbar, inspector, and labels.

How to Install & Use

  1. In MetaTrader 5 → Navigator → Indicators → open DeltaFootprintChart (or drag it onto a chart).
  2. Start with XAUUSD M5 (or your liquid symbol) during market hours so tick ladders fill.
  3. On first attach, leave most defaults. Set Language to English or Chinese, and pick an InstrumentPreset if you want a one-click Gold/FX/Index start.
  4. Click OK. Wait for the first tick rebuild (history depth = HistoryBarsTarget).
  5. Use the mouse wheel to zoom until Bid×Ask digits are readable. If digits stay hidden, raise MaxPxPerBar or zoom further.
  6. Click a candle to pin the inspector. Use toolbar chips for CVD / Inspector / Imbalance / instrument switching.
  7. Empty ladders when the market is closed (no ticks) are normal — wait for live ticks.

Chart Controls (After Attach)

  • Wheel — Zoom bars (px/bar). Digits appear only when bar width and cell height pass the thresholds.
  • Shift + Left-drag — Pan time and price together; any pan clears Follow-last-bar.
  • Left-drag on price axis — Scale the price span (native MT5 feel). Row height and digit font follow.
  • Plain left-drag on chart — Free for MT5 objects (rectangle, etc.); pan is Shift+Left.
  • Double-click price axis or plot, F, or toolbar Fit — Fit visible high/low.
  • Home — Follow latest bar and fit price.
  • [ / ] — Move inspector to older / newer bar. Click plot to pin selection.
  • E — Export selected bar to Common/Files as CSV (honesty header + price,bid,ask,delta rows).
  • I / Esc — Toggle About panel (rule summary, cache key, tick count, self-test status).
  • Ctrl+wheel / Shift+wheel / wheel on price axis — Zoom price span.
  • Drag CVD top edge — Adjust CVD strip height (96–520px before UiScale).
  • Toolbar — instrument preset, layout, volume mode, CVD, inspector, language, About.

Instrument Presets

Preset Performance Row size Spread cap CVD height Palette
Off From inputs From inputs From inputs From inputs From inputs
Gold Gold Manual 50pt 250pt 280px Warm gold/green/red
FX Balanced Auto 80pt 220px Cool blue/green
Index Lite Manual 20pt 400pt 200px Muted gray

Presets change row size, spread cap, CVD height, and colors. They do not drop ticks already in memory. A row or spread change rebuilds ladders only.

Recommended Starter Settings

  • Gold (XAUUSD): InstrumentPreset = Gold, or PerformancePreset = Gold, RowSizeMode = Manual with RowSizePoints suited to your broker digits.
  • FX majors: InstrumentPreset = FX, PerformancePreset = Balanced, RowSizeMode = Auto.
  • Indices: InstrumentPreset = Index, PerformancePreset = Lite if the CPU is busy.
  • Readable UI: UiScale 1.40–1.80, FontSizeUi 14–16, FontSizeDigits 11–13, ShowDeltaTable = true.
  • Clean look: ShowSessionShade = false, HideNativeCandles = true, FollowLastBar = true, RightPaddingBars = 3.

Parameters — How to Configure

Data

  • HistoryBarsTarget — how many bars keep footprint ladders (default 400). Higher = more history, more RAM/CPU.
  • TickChunkSize — soft cap per CopyTicksRange chunk (default 80000).
  • SyntheticTickWeight — weight when tick volume is 0 (default 1.0).
  • MaxSpreadPoints — filter wide spreads: -1 auto (200 metals / 80 FX), 0 off, else points.
  • PreferTradeTicks — use real BUY/SELL flags when the feed provides them (default true).
  • AggressorRuleVersion — keep AggressorRule_v1 for production.
  • EnableSynthesisAudit — debug only; replay/compare synthesis (leave false).

Rows

  • RowSizeMode — Auto (adapts) or Manual.
  • RowSizePoints — bucket height in points when Manual (e.g. gold often needs a larger step).
  • PriceMapMode — SideAware (default), Last, or Mid — how ticks map into price rows.

Footprint

  • LadderLayout — Beside (ladder next to candle) or Inside (inside the body).
  • VolumeDisplay — AskBid (default), Delta, or TotalDelta.
  • ShowImbalance / ImbalanceRatio / MinImbalanceVolume / StackedLevels — imbalance highlight rules (default ratio 3.0, stack 3).
  • MinPxPerBarForDigits / MinCellHeightForDigits — minimum zoom before Bid×Ask numbers paint.

Candles

  • ShowCandles, BodyOpacity, BullColor, BearColor — candle look on the Canvas.

CVD

  • ShowCVD — show the CVD strip (also forced on when the delta table is on).
  • CVDReset — None / Daily / Session / ManualAnchor.
  • SessionTemplate — FX London overlap or Custom; Custom uses SessionStartHour / SessionEndHour.
  • CVDManualAnchorTime — reset anchor when CVDReset = ManualAnchor.
  • ShowSessionShade — soft session wash (default off for a clean solid chart).
  • CvdStripHeight / ShowCvdCurve — strip height and whether the CVD curve draws.

Divergence

  • ShowCvdDivergence — yellow neutral circles on CVD (default true). Not trade arrows.
  • CvdDivMarkSize / CvdDivMarkColor — mark size and color.

Viewport

  • MinPxPerBar / MaxPxPerBar — zoom range (raise Max to keep digits readable; max 280).
  • DefaultBarsVisible — first-load bar count (default 32).
  • FollowLastBar — stick to the live candle until you pan.
  • RightPaddingBars — empty bars to the right of the live candle (default 3).
  • HideNativeCandles — hide MT5 candles so only Canvas candles show (default true).
  • CanvasBehindObjects — keep Bubble/objects paintable above the Canvas.

UI

  • UiScale — global UI scale (default 1.60). Toolbar + inspector scale together.
  • FontSizeUi / FontSizeDigits — UI labels vs footprint digits.
  • ShowDeltaTable / DeltaTableHeight / ShowDeltaHistogram — bottom Volume|Delta|Cum block.

Inspector

  • ShowInspector / InspectorWidth — right-side selected-bar panel.

Performance

  • PerformancePreset — Balanced (default), Gold (heavier / denser), Lite (lighter), Manual (you own TimerMs / caps).
  • TimerMs — refresh timer when Manual (default 75).
  • MaxTicksInStore — tick store cap (default 3,000,000).

Preset

  • InstrumentPreset — Off (keep inputs), Gold, FX, Index. Toolbar can switch live. Off keeps your typed inputs.

Honesty / Language / Colors / Alerts / Debug

  • ShowHonestyBadge — set-file only; not drawn on chart by default.
  • Language — Lang_zh or Lang_en.
  • Ask/Bid/Delta/Imbalance/POC/Background colors — visual theme.
  • Session shade colors / second session — optional shade only; does not reset CVD unless CVDReset = Session.
  • EnableAlerts + cooldown / popup / push / email — optional alerts (default off).
  • VerboseLog — Experts log noise for debugging (leave false).

Honesty Contract

The honesty statement — "Synthetic order flow, not exchange Level 2 / not a full-market tape" — appears in:

  • The #property description (visible in the indicator dialog)
  • The Experts log on init
  • The About panel (toolbar i or press I)
  • Every exported CSV header

The on-chart badge is off by default. The data source chip (Synth / Trade / Mix) in the toolbar always reflects the active classification path.

Architecture

  • One bitmap — All pixels (candles, ladders, axes, CVD, inspector, toolbar) are drawn on a single CCanvas. No OBJ_LABEL, OBJ_TEXT, OBJ_RECTANGLE, or ObjectCreate calls.
  • Tick window is authoritative — Ticks are stored in absolute millisecond time. Bar ladders are a replay cache. A timeframe switch increments the generation, drops all ladders, and discards any in-flight tick copy whose generation no longer matches.
  • Generation guard — m_ctxGen protects against stale CopyTicksRange results during symbol/period switches.
  • Incremental update — The latest bar is updated incrementally as new ticks arrive; completed bars are committed and not re-replayed unless their row size or spread filter changes.
  • Empty-tick handling — When CopyTicksRange returns 0 with no error, the range is retried twice then accepted as empty. Bars with no ticks are marked offline and drawn as candles without ladders — never as fake zero-delta rows.
  • Self-test — RunSelfTest() runs on every OnInit. 45 test cases verify the classification rule, row accumulation, provisional vs. replayed bar, imbalance/stack, cell mode, cache key, and series lookup. A failure shows a red chip on the toolbar.

Performance Presets

Preset History bars Tick cap Timer Default bars Row target
Balanced 500 3,000,000 75ms 32 14
Gold 180 1,200,000 100ms 30 10
Lite 120 600,000 75ms 24 8
Manual 20-800 50K-5M 25-250ms 5+ from input

Balanced auto-selects Gold caps on XAU/GOLD/XAG/SILVER symbols. Timer downloads ticks and replays them; OnCalculate only refreshes rates when the bar count changes. Frame time is shown on the toolbar and turns amber above 16ms.

Expected Behavior

Closed market / no ticks results in empty footprint is normal. Same symbol on different brokers can produce different ladders. Synthesis is honest Path A for FX/CFD when trade flags are absent — never marketed as exchange L2.

Complements

Works alongside bubble-style delta tools and session volume profile workflows. This product is a footprint + CVD chart — not a bubble clone and not a session VP replacement.

Disclaimer

For analysis only. No profit claims. Always manage your own risk.
おすすめのプロダクト
WaveMaster Oscilloscope transforms your MT5 chart into a professional-grade oscilloscope -  a precision instrument that converts market behavior into a live, multi-channel waveform. Instead of guessing what price is "doing," you simply watch it happen in real time. Inspired by the signal-analysis tools used in advanced electronics laboratories, WaveMaster oscilloscope   reads the pulse of the market and renders it as a beautiful, animated waveform directly on your chart. This is not another lin
FREE
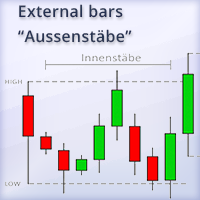
This indicator shows external bars ("Aussenstäbe") in the chart in candle form. The colors of the candles can be set individually. Also different colors for bearish and bullish bars are possible. In addition, the color of the wicks or outlines is also adjustable. Outside bars are mentioned e.g. by Michael Voigt in the book "Das große Buch der Markttechnik". All other candles are inner bars.
Fixed Range Volume Profile is an MT5 volume analysis tool that calculates and displays volume distribution across any custom price and time range using standard chart trendlines for Forex, Gold (XAUUSD), Indices, and Crypto. Designed for day trading, scalping, and swing trading, this indicator automatically maps the Point of Control (POC), Value Area boundaries (VAH/VAL), and high-volume support and resistance levels without requiring manual object naming or complex setup. Core Volume Profile Ar
Institutional Orderflow Entry Scanner Volume Profile • Value Area • Order Blocks • Multi-Symbol Scanner Turn your chart into a professional institutional order-flow cockpit. This indicator scans up to 60 Market Watch symbols in real time, detects high-probability setups from three proven Value-Area strategies, and delivers clean, actionable entries with institutional-grade risk management — all on a single, flicker-free interface. What It Does The scanner continuously analyses the previous sess
ForeCastX AI はMetaTrader 5用のチャートインジケーターです。スイングに基づくトレンド着色、売買矢印、サプライ/デマンドゾーン、複数時間足の売買パワーパネル、任意の投影パスを表示します。 投影パスは直近の構造とパネル値から描く視覚的な線です。価格予測ではなく、単独の売買シグナルでもありません。 チャート表示 現在のスイングトレンドでローソク足を着色 確定したスイング高値または安値のブレイクで矢印 強度ラベル付きのサプライ/デマンド矩形 選択した時間足の売買パワーバーと平均行 投影セグメントはバイアス方向の最寄りゾーン付近で止まる場合があります アラート ポップアップ、プッシュ、メール、サウンドを有効にできます。確定足のみの設定では、形成中の足ではアラートしません。 EA向け 非表示バッファ:+1 上昇、-1 下降、0 なし。 注意 チャート分析用です。注文は出しません。過去の形状は将来の結果を示すものではありません。ご自身のルールとリスク管理と併用してください。 MQL5グループ: https://www.mql5.com/en/messages/03590900
1. GENERAL OVERVIEW AND ARCHITECTURAL PHILOSOPHY. TradeRadar LITE V3.4 represents an advanced, quantitative analytical multi-symbol and multi-timeframe scanner indicator engineered exclusively for the MetaTrader 5 platform. The overarching architectural philosophy behind this software is to eliminate subjective chart reading by translating standard Price Action and Smart Money Concepts (SMC) into a strict, mathematically driven algorithmic scoring model. Unlike conventional indicators that rely
Algo Trading Indicaor MT5 The ATC ALGO indicator has been developed to work on the MetaTrader 5 platform. It has the same specifications and zones as the MetaTrader 4 version. There may be slight lag, which we believe is due to differences in MetaTrader 5 programming. We will work on improving it, God willing. MT5 Version                    https://www.mql5.com/en/market/product/170028 MT4 Version                    https://www.mql5.com/en/market/product/88034 With this indicator , you’ll have
=================================================================================== PRODUCT DESCRIPTION: KRYPTON TREND KINETIC PRO BY VERITASALGO =================================================================================== Krypton Trend Kinetic Pro (KTK) is a high-performance mathematical model and trend-following system designed exclusively for the MetaTrader 5 platform. Engineered specifically to meet the strict listing requirements of the MQL5 Market, this premium analytical tool offe
ベータ指数、またはベータインジケーターは、ヘッジ機関の参考指標の一つです。 これは、通貨や商品などの個別資産の相対的なリスクを市場ポートフォリオ、通貨クロス、米ドル指数、株価指数と比較して測定するのに役立ちます。資産が市場基準と比較してどのように動くかを理解することで、投資リスクについてより明確な理解を得ることができます。 主な特徴: 正確なリスク評価:ベータ指数は、資産のリスクを市場全体と比較して正確に評価し、情報を元に投資判断を行うのに役立ちます。 分散戦略:この指数を活用して、さまざまな資産カテゴリーを横断して投資ポートフォリオを最適化し、分散戦略の機会を探ることができます。 マルチ通貨ヘッジに適しています:マルチ通貨ヘッジに参加する投資家は、この指数を重要な参考指標として考慮できます。 リアルタイムの洞察:タイムリーな意思決定のためにリアルタイムのデータ分析を利用できます。 ベータ指数を取引ツールに組み込むことで、データとリスク分析の力を活用できます。より賢明な選択をして、ポートフォリオの無駄なリスクを軽減しましょう。 β = 1:βが1と等しい場合、資産の価格変動は市場全体と
Trend Factor is an indicator based on the calculation of price values ​​to answer questions about what direction the trend is acting on the market at the moment and when this trend will end. By launching the Trend Factor indicator, the user will see two lines and bars of different colors, which can change color to green during an uptrend, to red during a downtrend or to be yellow during an uncertainty. The trader uses the Trend Factor indicator to determine the market situation. This is a tre
Advanced Market Pressure Indicator - Professional Trading Tool Stop Guessing. Start Trading with Precision. WHAT IT DOES This indicator reveals WHO controls the market - Buyers or Sellers - and predicts their next move using advanced algorithms. 5 Powerful Systems in ONE Indicator: Real-Time Pressure Analysis - Shows exact buyer/seller force (0-100%) Automatic Divergence Detection - Catches reversals BEFORE they happen AI Confidence Score (70-100%) - Filters out false signals automat
Multi-Timeframe Breakout Pressure and Confirmation Dashboard TAGLINE Track compression, stored pressure, breakout direction, and confirmation in one dashboard. PRODUCT OVERVIEW BreakoutPulse Navigator MT5 is a professional multi-timeframe breakout dashboard for MetaTrader 5. It is designed to detect two different stages of a breakout: 1. Pressure building before the breakout 2. Directional confirmation after price leaves the channel The indicator combines: - Bollinger Band squeeze - ATR
FREE
HA Pullback Resume MT5 Systematic Trend Retracement and Momentum Resumption Engine The HA Pullback Resume indicator for MetaTrader 5 provides an objective analytical framework designed to identify high-probability trend-continuation setups following shallow corrective pullbacks. Active intraday traders and scalpers frequently encounter execution timing errors during trend pauses: entering prematurely before a correction completes, suffering stop-outs from erratic boundary wicks during quiet cons
Candle Stick Timer Indicator ️ Know Your Candle. Know Your Time. Trade With Confidence. Stop guessing when the current candle will close.   Candle Stick Timer Indicator   gives you a clear, real-time countdown directly on your trading chart, helping you stay aware of every second of the candle’s formation. Whether you trade   Forex, Gold, Crypto, Indices, or other markets , this indicator helps you monitor candle timing without constantly checking the clock. Key Features ️   Real-Time Candl
Anchored VWAP Trading Indicator Struggling to identify true market value and key support/resistance levels? The Anchored VWAP Trading Indicator helps you track price based on real traded volume, giving you a clear edge in your trading decisions. This tool allows you to anchor VWAP from any point on the chart, making it ideal for analyzing trends, reversals, and institutional activity. Key Features Anchored VWAP from any candle Accurate volume-weighted price calculation Works on all symbol
The Commissioner indicator is very sensitive to current price activity and displays signals quite well. Reacts quickly to trend changes, clearly shows the price movement. The colored version of the indicator signals a trend change. The indicator allows you to see a rising or falling trend. In addition to the direction of the trend, the indicator shows the change in the slope, the analysis of which allows you to filter signals using filters by angle, this can be used when building a bot with th
The Trend Strength Meter Core  is a powerful on-chart dashboard designed to give you an instant, clear reading of the current market momentum . By combining the data from Moving Averages, RSI, and MACD, it calculates a highly accurate Trend Score (0 to 100), ensuring you always trade on the right side of the market . Key Features Advanced Confluence Algorithm: Calculates a dynamic score by analyzing price position relative to MA, RSI overbought/oversold zones, and MACD signal crossovers . Enhanc
FREE
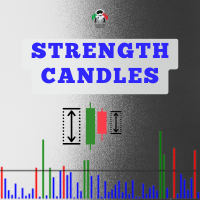
Strength Candles
Luis Paulo Rodrigues Pastor
Indicator in histogram format, which is calculated using data on financial volume, tick volume and the body of the bar. It is possible to visualize moments where there was a large entry of volume, both financial and in ticks, and that the market managed to progress and advance in one direction (up or down) due to the size of the bar body, which is where there really was a victory for one side of the negotiation (buyers and sellers). By default, all bars in the indicator's histogram are colore
VProfile Rebounce Scanner Pro Institutional Volume Profile Entries — Automated Across Your Entire Market Watch Stop guessing where price will react. Let the market's own volume tell you. Every session, the market builds a footprint — where the heaviest trading actually happened, not just where price wandered. That footprint is the Value Area and its center, the Point of Control (POC). Institutions build positions around these levels. Retail traders usually can't see them at all, let alone act o
FREE
Sequence Algo
Itumeleng Mohlouwa Kgotso Tladi
SEQUENCE ALGO - Your Trading Edge Unlock Market Opportunities with Precision Signal Intelligence SEQUENCE ALGO is a sophisticated trading indicator designed to help you identify high-probability entry and exit points in real-time. Built for traders who demand accuracy and clarity in their decision-making process. Key Benefits: Clear Visual Signals   - Eliminate guesswork with intuitive BUY and SELL alerts that cut through market noise and highlight potential trading opportunities. Real-Time Ana
Automatically detect bullish or bearish order blocks to optimize your trade entries with our powerful indicator. Ideal for traders following ICT (The Inner Circle Trader). Works with any asset type, including cryptocurrencies, stocks, and forex. Displays order blocks on multiple timeframes, from M2 to W1. Alerts you when an order block is detected, migrated, or a higher timeframe order block is created/migrated. Perfect for both scalping and swing trading. Enhanced by strong VSA (Volume Spread A
Vision  by Quant Atlas Creator:  https://www.quant-atlas.com/ Vision by Quant Atlas  is a multi component reversal signal indicator designed to identify short term bullish and bearish exhaustion points across liquid markets. The model aggregates several independent technical evidence layers, including momentum behavior, mean reversion pressure, volatility based conditions, trend interaction, timing structure, and moving average related confirmation. The final output is converted into visual conv
50% Off Today Only! Price Goes Back Up at 11 PM (EST) uGenesys Volume Indicator: Your Key to Mastering Market Volume Analysis What Traders Are Saying: "A must-have indicator...really a game-changer." – wuzzy66 "Amazing indicator...strongly recommend to beginners." – joinbehar Understanding Market Volume:   Volume in the market is a critical indicator of movement and opportunity. The uGenesys Volume Indicator is specially crafted to pinpoint when the market has the most volume, allowing you to
is a versatile analytical tool designed for both advanced traders and beginners. It combines classic trend line analysis with automatic Fibonacci level plotting to deliver precise market entries and structural clarity. Built as an intuitive and clean on-screen dashboard, this indicator simplifies multi-timeframe analysis without cluttering your main workspace. Technical Analysis and Entry Points The indicator automates the most critical aspects of price action and structural trading: Trend L
弱い通貨に対して強い通貨を取引することは、常に最も安全なプレイです。この指標は、主要通貨間の相対的な強さを測定し、金融商品の選択、入場、退出をより簡単にします。基本的な考え方は、弱い通貨をカウンター通貨として使用し、その逆を使用することです。弱さに対する強さおよび強さに対する短い弱さを購入します。 [ インストールガイド | 更新ガイド | トラブルシューティング | よくある質問 | すべての製品 ] 一目で強い通貨と弱い通貨を見つける ある通貨を別の通貨と簡単に比較する 通貨は強化されていますか?長い間探します 通貨は弱くなっていますか?ショートパンツを探す 複数時間枠のダッシュボードを実装します それは取引のための最高品質の確認です インディケーターは最適化をまったく必要としません カスタマイズ可能なルックバック期間 インジケーターは再描画されていません インジケーターの解釈はかなり簡単です。 27通貨ペアの現在と以前の価格を比較し、各通貨が他のすべての通貨に対して獲得または損失した回数をカウントします。通貨は8つしかないため、最大スコアは+7(他のすべてに対して獲得された通貨
Here's a post-ready description. It uses emoji and plain formatting, so it pastes cleanly into Telegram, MQL5 or a forum. Dynamic SMC & Market Structure PRO (MT5) A complete Smart Money Concepts toolkit on one clean chart: market structure, supply and demand, key liquidity levels, and a live dashboard. It is light on the chart and built to run without lag. What it shows BOS & CHoCH: automatic structure breaks. A break in the trend's direction is labelled BOS, and a break against it is labe
No Wick Candle Scanner is a powerful, lightweight tool built for MetaTrader 5 designed to isolate pure market momentum. In trading, candles that close without an upper or lower tail (wick) represent absolute dominance by buyers or sellers. This indicator scans your charts in real-time, instantly flagging these high-probability momentum bars with clean visual markers, allowing you to catch strong trend continuations and sudden breakouts with ease. Key Advantages & Features: 6-in-1 Filtering Matr
FREE
Level Alert Utility is an essential workflow tool for MetaTrader 5 designed to eliminate constant screen fatigue. Effortlessly drag the interactive level line directly on your chart—the indicator instantly configures trigger rules and delivers real-time notifications via customizable sound repeats, popup alerts, mobile Push notifications, and email. Equipped with high-speed millisecond monitoring, gap and impulse protection, quick-action chart buttons, hotkey support, and state persistence acros
Pro Traders Dynamic Index TDI rsi BB Signal Filter - Technical Specification and User Manual 1. Product Overview and Structural Architecture Pro Traders Dynamic Index TDI rsi BB Signal Filter is a multi-layered technical analysis indicator developed natively for the MetaTrader 5 trading platform. The architecture integrates the mathematical models of the classic Traders Dynamic Index (TDI), an adaptive dual-speed Relative Strength Index (RSI) dynamic line engine, baseline volatility envelope ch
Symbol Changer Indicator This is a simple yet intuitive indicator.  The indicator provide easy navigation across various symbols and across different time frames all in a chart. The buttons are displayed on the main chart. It is flexible and easy to use with fast response speed. FEATURES         Use Custom Pairs : If set to true, load all the available symbols in the Market Watch. No means it loads the pairs selected below.     Pairs (Separated by Comma) : This enables selected pairs
このプロダクトを購入した人は以下も購入しています
Gann Made Easy   は、ミスター・ギャンの理論を使用した取引の最良の原則に基づいた、プロフェッショナルで使いやすい外国為替取引システムです。 W・D・ガン。このインジケーターは、ストップロスとテイクプロフィットレベルを含む正確な買いと売りのシグナルを提供します。 PUSH通知を利用して外出先でも取引可能です。 ご購入後、取引方法の説明と優れた追加インジケーターを無料で入手するには、私にご連絡ください! おそらく、ギャンの取引手法についてはすでに何度も聞いたことがあるでしょう。通常、ギャンの理論は初心者のトレーダーだけでなく、すでにある程度の取引経験がある人にとっても非常に複雑なものです。なぜなら、ギャンの取引手法は理論的にはそれほど簡単に適用できるものではないからです。私はその知識を磨き、最良の原則を私の外国為替インジケーターに組み込むために数年を費やしました。 このインジケーターは非常に簡単に適用できます。必要なのは、それをチャートに添付し、簡単な取引推奨事項に従うだけです。このインジケーターは常に市場分析の仕事を行い、取引の機会を探します。適切なエントリーポイントを検
Entry Points Proは、注文を出す前に、どこでエントリーし、どこにストップを置き、どのロットで取引するかを示します。 価格 現在 149 USD、この価格での販売は残り1本です。その後は 199 USD に値上がりし、最終価格は 349 USD です。 私は相場のトレードで収入を得ており、それを公開しています。だから、このインジケーターを誰にでも売る必要はありません。自分の頭で考えるトレーダーのためのツールであり、魔法のボタンではありません。 矢印はローソク足の確定時に表示され、リペイントしません。設定は2つ:あなたの資金と1回のトレードあたりのリスクです。 お支払い前にご確認ください:無料デモはMT5のストラテジーテスターで動作し、2分で済みます。ご購入後は、私が個人的に設定をお手伝いします。 2019年、私はこのインジケーターの実力を世界中に示しました。そのシグナルに従って手動で、リアル口座で、公開の場でトレードしたのです。口座はMyfxbookでモニタリングされ、私はこの実験の経過をFacebookで詳しく発信していました。結果:4か月で10,000ドルが941,4
ULTRAは、「オールインワン」方式で機能するテクニカル指標です。市場を独自に分析し、売買シグナルを生成し、ストップロス注文を設定するための水準を表示し、利益を確定したり損失を最小限に抑えたりするためにポジションを決済すべきタイミングを提案します。 つまり、市場の分析方法や、水準(ストップロスをどこに設定すべきか)の見極め方がわからなくても、あるいは資金管理に苦労していても問題ありません。ULTRAがすべて代行してくれます! 購入者限定特典 :「ULTRA」インジケーターをご購入後、私にプライベートメッセージをお送りいただければ、「ULTRA BOT」を無料プレゼントとしてお受け取りいただけます。これは、このインジケーターからのシグナルに基づいて、オープンしたトレードを管理するのに役立つ特別なツールです(各トレードにストップロスを設定し、最適な結果が得られるよう、戦略のルールに従って自動的にトレードを決済します)。  また、インジケーターを最大限に活用できるよう、さまざまな資産向けの既成の設定も購入者の皆様に提供しています。これらの「超お得な特典」を無料で入手するには、私へダイレクトメ
M1 SNIPER は使いやすいトレーディングインジケーターシステムです。M1時間足向けに設計された矢印インジケーターです。M1時間足でのスキャルピングのためのスタンドアロンシステムとして、また既存のトレーディングシステムの一部としても使用できます。このトレーディングシステムはM1時間足での取引に特化して設計されていますが、他の時間足でも使用できます。元々、この手法はXAUUSDとBTCUSDの取引用に設計しましたが、他の市場においても役立つと考えています。 インジケーターのシグナルは、トレンドの方向と逆方向に取引できます。インジケーターのシグナルを利用して両方向に取引するのに役立つ特別な取引テクニックをご紹介します。この手法は、特別な動的なサポートとレジスタンスの価格帯を利用することに基づいています。 ご購入後、M1 SNIPER矢印インジケーターをすぐにダウンロードできます。さらに、M1 SNIPERツールのすべてのユーザーに、以下のスクリーンショットに表示されているApollo Dynamic SRインジケーターを無料で提供しています。この2つのインジケーターを組み合わせることで
Adaptive Price Action Engine インジケーターを購入すると、EAが無料に マルチタイムフレーム対応・自己最適化トレンド&ローソク足パターン分析 市場環境は常に変化しており、すべてのPrice Actionパターンが、あらゆる市場環境で同じ価値を持つわけではありません。 Adaptive Price Action Engine は、変化する市場環境への適応を目的として、 トレンド構造、マルチタイムフレーム分析、ローソク足パターン、統計的最適化 を1つの分析フレームワークに統合しています。 2つのアダプティブモード Dual Alpha Trend Mode 低い時間足と高い時間足のAlpha Trendパラメータを自動的に探索し、直近の市場動向に合わせてトレンド判定を適応させます。 Candlestick + Alpha Mode Alpha Trendによる市場レジーム判定と、 22種類の強気・弱気ローソク足パターン を組み合わせます。すべてのパターンを同じように扱うのではなく、さまざまなパターンの組み合わせを統計的に評価し、選択された市場環境において過去
Auto Optimized SpeedAngle は、継続的なウォークフォワード最適化(WFO:Walk-Forward Optimization)によりカーブフィッティング(過剰最適化)を排除した、機関投資家レベルのモメンタムベクトルシステムです。市場レジームの変化時に効果が低下する静的な入力に依存せず、アウトオブサンプル(OOS)検証を用いてパラメーターを動的に再キャリブレーションすることで、表示されるシグナルが単なる過去の偶然ではなく、確実な統計的優位性に基づいていることを保証します。 主な機関投資家向けフレームワーク ウォークフォワード最適化エンジン: ルックバック期間やしきい値の数千に及ぶ組み合わせを継続的にスキャンし、データをインサンプルとアウトオブサンプルに厳格に分離します。未検証のデータ環境において数学的優位性が証明された場合にのみ、新しいパラメーター設定を採用します。 定量的目的関数: 単なる純利益の追求ではなく、機関投資家レベルの安定性指標をターゲットとします。システム品質ナンバー(SQN)、期待値(1トレードあたりの平均Rマルチプル)、またはネットRの最適化を選
ARICoin is a powerful trading companion designed to generate high-probability entry signals with dynamic TP/SL/DP levels based on volatility. Built-in performance tracking shows win/loss stats, PP1/PP2 hits, and success rates all updated live. Key Features: Buy/Sell signals with adaptive volatility bands Real-time TP/SL/DP levels based on ATR Built-in MA Filter with optional ATR/StdDev volatility Performance stats panel (Success, Profit/Loss, PP1/PP2) Alerts via popup, sound, push, or email Cust
Boba Analysis Suite
Trade Ready Solutions LLC
5 (2)
Boba Analysis Suite Boba Analysis Suite は、MetaTrader 5 向けの分析インジケーターです。市場構造、重要な価格帯、相場全体の状況を、一つのチャート画面にまとめて表示します。 トレーダーおよびトレーディング指導者としての実務経験をもとに開発され、市場の方向性の評価、重要な価格水準の特定、複数の時間足を組み合わせた分析など、体系的な分析プロセスを支援します。 相場の背景を踏まえた分析 個々のシグナルの意味は、相場の状況によって変わります。Boba Analysis Suite は、現在のチャート状況をより大きな市場構造と関連付け、あらかじめ定めたルールに沿って取引アイデアを検討するための分析を支援します。 主な分析機能: トレンドと市場構造: 市場の方向性と、その背景にある構造を評価します。 重要な価格帯と価格水準: さらに分析すべき重要な領域を視覚的に表示します。 複数の時間足: 異なる時間足の情報を組み合わせ、相場全体の状況を評価します。 視覚的な分析プロセス: 分析情報をチャート上で直接確認できます。 自主的な取引判断を支援 Boba
ScalpPoint is a powerful trading companion designed to generate high-probability entry signals with dynamic TP/SL/DP levels based on volatility. Built-in performance tracking shows win/loss stats, PP1/PP2 hits, and success rates — all updated live. Key Features: Buy/Sell signals with adaptive volatility bands Real-time TP/SL/DP levels based on ATR Built-in MA Filter with optional ATR/StdDev volatility Performance stats panel (Success, Profit/Loss, PP1/PP2) Alerts via popup, sound, push, or emai
「Scalper Vault」は、デイトレードで安定した成果を目指すトレーダーのために設計された、強力かつ充実した機能を備えたトレーディングシステムです。 この高精度なインジケーターは、それ単体で完結するトレーディングシステムとして機能し、FXやバイナリーオプションのトレーダーに、機関投資家レベルの分析を提供します。 ご購入後、ぜひご連絡ください。 トレードのヒントに加え、豪華なボーナスをプレゼントいたします! 「Scalper Vault」を活用すれば、勘に頼った判断や複雑な手動分析は不要です。使いやすいトレード手法に集中し、純粋に「エントリー・決済」という実行フェーズに専念できます。 高精度なトレンドフォロー・シグナル:中核となるアルゴリズムが市場構造を分析し、主要なトレンド方向に沿った高確率なシグナルを提示します。これにより、誤ったエントリーを大幅に削減できます。 精度の高い天井・底の検知:市場の勢いが尽きたポイントをスキャンし、反転の可能性が高いゾーンを特定します。 ギャン(Gann)理論に基づく売買ゾーン:数学的な「ギャン・レベル」を自動的にチャート上に描画します。機関投資
Apex Patterns PRO インジケーターをご購入いただくと、それに基づいたExpert Advisorを無料でご提供します。 自己最適化するチャートパターンおよびブレイクアウト分析システム 従来のパターンスキャナーは固定のパラメータに依存しているため、市場のボラティリティや構造が変化するとパフォーマンスが低下することがよくあります。 Apex Patterns PROは、構造的なチャートパターン認識、モメンタムフィルタリング、および統計的な自己最適化を単一の分析フレームワークに統合することで、変化する市場環境に適応するように設計されています。 適応型スキャンエンジン 自己最適化パターンモード 最近の履歴データから適切なパターンパラメータを自動的に検索し、静的な設定を使用するのではなく、現在の市場の動きに合わせてインジケーターの構造検出を適応させます。 スマートブレイクアウトフィルタリング 古典的なパターン認識と、モメンタム、ボリューム、プライスアクションの指標を組み合わせます。すべてのブレイクアウトを同じように扱うのではなく、システムが根底にある市場構造を評価し、現在の統計
Volatility Master for MetaTrader is a real-time dashboard tool that scans up to  50 symbols  to identify high-volatility , trending markets instantly. With bullish/bearish signals, customizable alerts, and a user-friendly interface, it helps you avoid range-bound conditions and focus on high-probability trades. Clarity leads to confidence. Trade confidently and protect your capital effectively with this powerful dashboard. We don't offer free or bonus indicators in exchange of reviews from you.
SIO Oscillator:自己最適化型セミバリアンス・インバランス・オシレーター インジケーターをご購入いただくと、それをベースにしたエキスパートアドバイザー(EA)を無料でお受け取りいただけます。 多くのオシレーターは、すべての価格変動を同じように扱います。SIOは上昇圧力と下降圧力を分けて捉え、その間のインバランス(不均衡)を測定することで、買い手と売り手のどちらが本当に相場を支配しているかを示します。インバランスが極値に達すると、SIOはエントリー、ストップロス(Stop Loss)、テイクプロフィット(Take Profit)の水準を伴う明確なシグナルを表示します。 SIOの大きな特長は、固定パラメーターに頼らないことです。内蔵の自己最適化機能が、現在の銘柄と時間足に適したパラメーターを継続的に探索し、使用する前に検証します。 2つのシグナルモード 平均回帰(Mean Reversion):インバランスの極値で取引し、均衡への回帰を狙います。 トレンドフォロー(Trend Following):持続的で優勢なインバランスの方向に取引します。 自動モード:最適化機能が直近のデ
多通貨対応の通貨強弱・モメンタム・インジケーター MT5 Dynamic Forex28 Navigator は、長年ご好評いただいているインジケーターの発展版で、3 つの機能を 1 つに統合したものです: Advanced Currency Strength28 Indicator (700 件のレビュー) Advanced Currency IMPULSE with ALERT (530 件のレビュー) CS28 Combo Signals(最近のボーナス) この 2 つの前身インジケーターは MQL5 Market で合計 1,200 件を超えるレビューを獲得しており、2016 年から MT4 コミュニティで定番となっています。Dynamic Forex28 Navigator MT5 は、実績ある同じロジックを引き継いでいます。 MetaTrader 5 向けに完全に再構築 – MT5 ネイティブのマルチシンボル・アーキテクチャを最大限に活かす設計です。 ユーザーマニュアル: https://www.mql5.com/en/blogs/post/758844 MT4 版をお探し
Neuro Poseidon is a new indicator by Daria Rezueva. It combines precise trading signals with adaptive TP/SL levels - creating best possible trades as a result! Message me and get  Neuro Poseidon Assistant  as a gift to automize your trading process! What makes it stand out? 1. Proven profitability on all assets and timeframes 2. Only confirmed BUY and SELL signals present on the chart 3. Adaptive TP & SL levels generated by the software for each trade 4. Easy to understand - suitable for al
AriFocus - Non-Repainting Buy/Sell Signals AriFocus - one clear signal. AriFocus marks buy and sell signals directly on the chart and suggests a stop-loss level for each one. Every signal is confirmed on bar close and never repaints. - Buy/sell arrows, confirmed on bar close - Suggested stop-loss level for every signal - Trend band and candle coloring to show direction at a glance - 10 ready-made presets, or your own settings (14 calculation methods) - Pop-up, push and email alerts with entr
通貨強さウィザードは、取引を成功させるためのオールインワン ソリューションを提供する非常に強力な指標です。このインジケーターは、複数の時間枠のすべての通貨のデータを使用して、このまたはその外国為替ペアのパワーを計算します。このデータは、使いやすい通貨インデックスと通貨パワーラインの形式で表され、特定の通貨のパワーを確認するために使用できます。 必要なのは、取引したいチャートにインジケーターを接続することだけです。インジケーターは、取引する通貨の実際の強さを示します。このインジケーターは、トレンドに合わせて取引するときに有利に利用できる売買高の圧力の極値も示します。このインジケーターには、フィボナッチに基づく可能なターゲットも表示されます。 このインジケーターは、PUSH 通知を含むあらゆるタイプのアラートを提供します。 購入後ご連絡下さい。私の取引のヒントをあなたと共有し、素晴らしいボーナスインジケーターを無料で提供します! 幸せで有益な取引をお祈りします。
Advance AI Scanner is a multi-symbol analysis indicator for MetaTrader 5. It scans Forex pairs, metals, energy, stock indices and cryptocurrencies at the same time and rates each instrument with its own self-training model. It explains in plain English what moved each market and why, and it estimates how far upcoming economic news usually moves each symbol, measured on your broker's own price history. $199 instead of $499. 10 copies left at this price. One time purchase  Installation and User
Azimuth Pro
Ottaviano De Cicco
5 (7)
Azimuth Pro V2:MT5向けシンセティック・フラクタル構造分析と確認済みエントリー 概要 Azimuth Pro は Merkava Labs によるマルチレベルスイング構造インジケーターです。4つのネストされたスイングレイヤー、スイングアンカーVWAP、ABCパターン検出、3タイムフレーム構造フィルタリング、そして確定バーでの確認済みエントリー — 1つのチャートで、ミクロスイングからマクロサイクルまでを網羅するワークフロー。 これはブラインドシグナル製品ではありません。ロケーション、コンテキスト、タイミングを重視するトレーダーのための構造ファーストワークフローです。 ハロウィンプロモーション — 35%オフ 相場が不気味に揺れても、あなたの優位性は鋭いまま。このオファーが霧の中に消える前に、35%オフで手に入れよう。 Azimuth Proが現在259 USD(通常399 USD)。 1. V2での変更点 シンセティック・マルチタイムフレームエンジン 上位タイムフレーム分析をMeridian Proと同じ独自のシンセティックアーキテクチャで一から再構築。より
SkyHammer Signal Pro Entry、SL、TP レベルを固定表示する、プロ仕様のノーリペイント・トレンドシグナルインジケーター SkyHammer Signal Pro は、明確で固定され、検証可能なシグナルを求めるトレーダー向けに設計された、構造的なトレンド・モメンタム系シグナルインジケーターです。 特に M1 と M5 などの短期時間足で最も効果を発揮します。 このインジケーターは、天井や底を予測するためのものではありません。シグナルを出す前に、確認された市場構造、トレンド方向、モメンタムの強さ、健全なボラティリティ、そしてターゲットまでの十分な値幅を確認します。 主な機能 固定シグナルメカニズム シグナルが確認されると、矢印、Entry、Stop Loss、TP1、TP2 の各レベルはチャート上に永久的に固定されます。 その後のローソク足の動きによって、シグナルが消えたり、移動したり、変更されたりすることはありません。 これにより、トレーダーは各シグナルを明確に確認でき、リアルタイム相場中にシグナルが消えるという一般的な問題を避けることができます。 完全な過去シ
Bill Williams Advanced is designed for automatic chart analysis using Bill Williams' "Profitunity" system. The indicator analyzes four timeframes at once. Manual (Be sure to read before purchasing) Advantages 1. Analyzes the chart using Bill Williams' "Profitunity" system. Signals are displayed in a table in the corner of the screen and on the price chart. 2. Finds all known AO and AC signals, as well as zone signals. Equipped with a trend filter based on the Alligator. 3. Finds "Divergence Bar
Apollo SR Master は、サポート/レジスタンスゾーンを利用した取引をより容易かつ確実にする特別な機能を備えたサポート/レジスタンスインジケーターです。このインジケーターは、ローカル価格の高値と安値を検出することで、タイムラグなしでリアルタイムにサポート/レジスタンスゾーンを計算します。そして、新たに形成されたSRゾーンを確認するために、インジケーターは特別なシグナルを表示します。このシグナルは、SRゾーンを実際の売りまたは買いシグナルとして考慮して使用できることを示します。この場合、SRゾーンの強度が高まり、SRエリアからの取引が成功する確率も高まります。これがこのインジケーターの基本的な考え方です。 SRゾーンは、ストップロスとテイクプロフィットの設定を容易にします。シグナルの方向に応じて、SRゾーンの上または下のスペースをストップロスとして設定できます。さらに、反対側のSRゾーンは、潜在的なテイクプロフィットエリアとして設定できます。 また、Apollo SRマスターインジケーターをご利用のすべてのユーザーには、「Apollo Price Action System」
このインジケーターを購入された方には、以下の特典を 無料 で提供しています: 各トレードを自動で管理し、ストップロスとテイクプロフィットを設定し、戦略ルールに基づいてポジションを決済する補助ツール 「Bomber Utility」 様々な銘柄に合わせたインジケーターの設定ファイル(セットファイル) 「最小リスク」、「バランスリスク」、「待機戦略」 の3つのモードで使用できる Bomber Utility 用の設定ファイル このトレーディング戦略をすぐに導入・設定・開始できる ステップバイステップのビデオマニュアル ご注意: 上記の特典を受け取るには、MQL5のプライベートメッセージシステムを通じて販売者にご連絡ください。 オリジナルのカスタムインジケーター 「Divergence Bomber(ダイバージェンス・ボンバー)」 をご紹介します。これは、MACDのダイバージェンス(乖離)戦略に基づいた 「オールインワン」型のトレーディングシステム です。 このテクニカルインジケーターの主な目的は、価格とMACDインジケーターの間に発生するダイバージェンスを検出 し、将来の価格の動きを示
SUPERHEROインジケーターは、「オールインワン」方式に基づいて設計された多通貨対応の取引システムです。このインジケーターは市場を独自に分析し、取引の開始および終了のタイミングに関するシグナルを提供します。ストップロス注文とテイクプロフィット注文を使用します。R:R比率は1:1です。 このシステムはスマートフォンにプッシュ通知を送信できるため、PCに縛られることなく「外出先」からでも取引を行うことができます。自己勘定取引を行う企業に最適です。 すべてのお客様への特典: このインジケーターをご購入いただいたすべてのお客様に、私から特別なユーティリティをプレゼントいたします。その内容は以下の通りです: 自動的にストップロス注文とテイクプロフィット注文を発注します 価格が目標水準に達すると、自動的に取引を決済します 指値注文による取引に対応しています 平均化取引モードに対応しています この優れた、しかも非常に便利なユーティリティをプレゼントとして受け取りたい場合は、SUPERHEROインジケーターをご購入後、直ちにMQL5プラットフォームのプライベートメッセージを通じて私までご連絡くださ
トレンドラインプロ   市場の真の方向転換点を理解するのに役立ちます。この指標は、真のトレンド反転と主要プレーヤーが再び参入するポイントを示します。 分かりますか     BOSライン   複雑な設定や不要なノイズなしに、より長い時間足でのトレンドの変化と重要なレベルを把握できます。シグナルは再描画されず、バーが閉じた後もチャート上に残ります。 VERSION MT 4     -     RFI LEVELS PRO インジケーター と組み合わせることで、その潜在能力を最大限に発揮します。 インジケーターが示す内容: 本当の変化   トレンド(BOSライン) 一度シグナルが現れたら、それは有効です!これは、リペイント機能を持つインジケーターとの重要な違いです。リペイント機能を持つインジケーターは、シグナルを発した後、それを変更し、資金の損失につながる可能性があります。これにより、より高い確率と精度で市場に参入できます。また、矢印が現れた後、目標値(利益確定)に達するか、反転シグナルが現れるまで、ローソク足の色を変更する機能もあります。 繰り返しエントリ       主要プレーヤーの
FootPrint Chart MT5
Gayathiri Gopalakrishnan
5 (1)
Turn every candle into a bid x ask footprint built from real tick data. See who is actually trading at each price, with delta, volume profile, imbalance zones and a scored setup engine that prints entry, stop and target Order Flow Footprint Chart Pro Most indicators tell you what price did. This one tells you who did it. Order Flow Footprint Chart Pro rebuilds every candle on your chart from raw tick data and shows you the volume that traded at each individual price inside it, split into the am
Quantum TrendPulse を ご紹介します。これは、   SuperTrend   、   RSI   、および Stochastic のパワーを 1 つの包括的なインジケーターに組み合わせて、取引の可能性を最大限に引き出す究極の取引ツールです。精度と効率を求めるトレーダー向けに設計されたこのインジケーターは、市場のトレンド、勢いの変化、最適なエントリー ポイントとエグジット ポイントを自信を持って特定するのに役立ちます。 主な特徴: SuperTrend 統合: 現在の市場動向に簡単に追従し、収益性の波に乗ることができます。 RSI精度: 買われすぎと売られすぎのレベルを検出し、市場の反転のタイミングに最適で、SuperTrendのフィルターとして使用されます。 確率的精度: 確率的振動を活用して、変動の激しい市場で隠れたチャンスを見つけます。SuperTrend のフィルターとして使用されます。 マルチタイムフレーム分析:   M5 から H1 または H4 まで、さまざまなタイムフレームで市場を常に把握します。 カスタマイズ可能なアラート: カスタム取引条件が満たされ
現在33%オフ 初心者にもエキスパートトレーダーにも最適なソリューション このインジケーターは独自の機能と新しい公式を多数内蔵しており、ユニークで高品質かつ手頃な取引ツールです。このアップデートでは、2つの時間枠ゾーンを表示できるようになります。より長いTFだけでなく、チャートTFとより長いTF(ネストゾーンを表示)の両方を表示できます。すべてのSupply Demandトレーダーの皆さんのお気に召すはずです。:) 重要情報の公開 Advanced Supply Demandの可能性を最大化するには、 https://www.mql5.com/ja/blogs/post/720245 にアクセスしてください。   エントリーまたはターゲットの正確なトリガーポイントを正確に特定できれば取引がどのように改善されるか想像してみてください。新しい基盤となるアルゴリズムに基づいて構築されているため、買い手と売り手の間の潜在的な不均衡をさらに簡単に特定できます。これは、最も強い需要と供給のゾーンと、過去のパフォーマンス(古いゾーンを表示)がグラフィカルに表現されるためです。これらの機能は、最適な
UZFX {SSS} スキャルピング・スマートシグナル v5.0 MT5は、変動の激しい市場において正確かつリアルタイムのシグナルを求めるスキャルパー、デイトレーダー、スイングトレーダー向けに設計された、リペイントのない高性能な取引インジケーターです。(UZFX-LABS)によって開発されたこのインジケーターは、価格行動分析、トレンド確認、スマートフィルタリングを組み合わせることで、すべての通貨ペアおよび時間枠において、高確率の売買シグナル、警告シグナル、トレンド継続の機会を生成します。 トレードの判断に迷うのはもうやめましょう。明確さ、正確さ、そして規律ある市場執行を求めるトレーダーのために設計された、体系的なシグナルシステムに従い始めましょう。 間違いなく、MQL5で入手可能な最高のインジケーターの一つです。絶対に見逃さないでください!!「スマートなトレーダーのためのスマートシグナル」 最新バージョン5.0がリリースされました。価格は予告なく最大499.99ドルまで値上がりする可能性がありますので、チャンスを逃さないようお早めにお求めください!! 購入を決める前に!無料トライアル
PainX GainX Blue Spike Fusion AI Synthetic Index Spike Analysis Indicator for MetaTrader 5 Overview PainX GainX Blue Spike Fusion AI is a technical analysis indicator for MetaTrader 5, designed to help traders monitor potential spike setups on compatible synthetic indices. The indicator combines signal monitoring, market-condition analysis, chart markers, notifications, and an on-chart information panel. It presents relevant market information in an organized format to help traders evaluate pote
作者のその他のプロダクト
Pre-Purchase Notice:   This indicator performs best on zero-spread accounts or fixed-spread accounts — i.e., broker accounts that do not widen spreads during news events. Prefer to use the Exness Zero-spread account. DeltaVolumeBubble — Volume Bubble Indicator A visualization tool distilled from Order Flow Delta. Using   bubble size × color , it lets you instantly read the true bull-bear battle behind every single candlestick. What Problem Does This Indicator Solve? Price can deceive you, bu
Scalp Quick Panel Pro — One-Click Scalping & Visual Planner (v13) Scalp Quick Panel Pro is a lightweight on-chart trading panel designed for manual and scalping traders. It integrates one-click execution, lot management, position management, daily P&L tracking, and a Visual Trade Planner into one compact UI. Key Highlights One-Click Execution: Market BUY/SELL with fixed SL/TP and async sending. Visual Planner: Drag Entry/SL/TP tags on the chart. Auto lot sizing based on fixed USD risk. Positi
Session Volume Profile Session Volume Profile (SVP) is a professional trading indicator for MetaTrader 5 that visualizes volume distribution across major trading sessions. It divides each trading session into three time segments and color-codes them, allowing traders to identify institutional vs. retail activity zones at a glance. Key Features Four Trading Sessions — Independently calculates and displays Volume Profiles for Sydney, Asia, Europe, and US sessions. Each session can be individually
フィルタ:
レビューなし
レビューに返信