Delta Footprint Chart

  • Indicateurs
  • Yuxin Lyu
    Yuxin Lyu
    I build chart and volume tools for MetaTrader 5 — session volume profiles, order-flow style strength visuals, and lightweight manual trading panels.
  • Version: 1.12
  • Mise à jour: 5 novembre 2026
  • Activations: 10

Overview

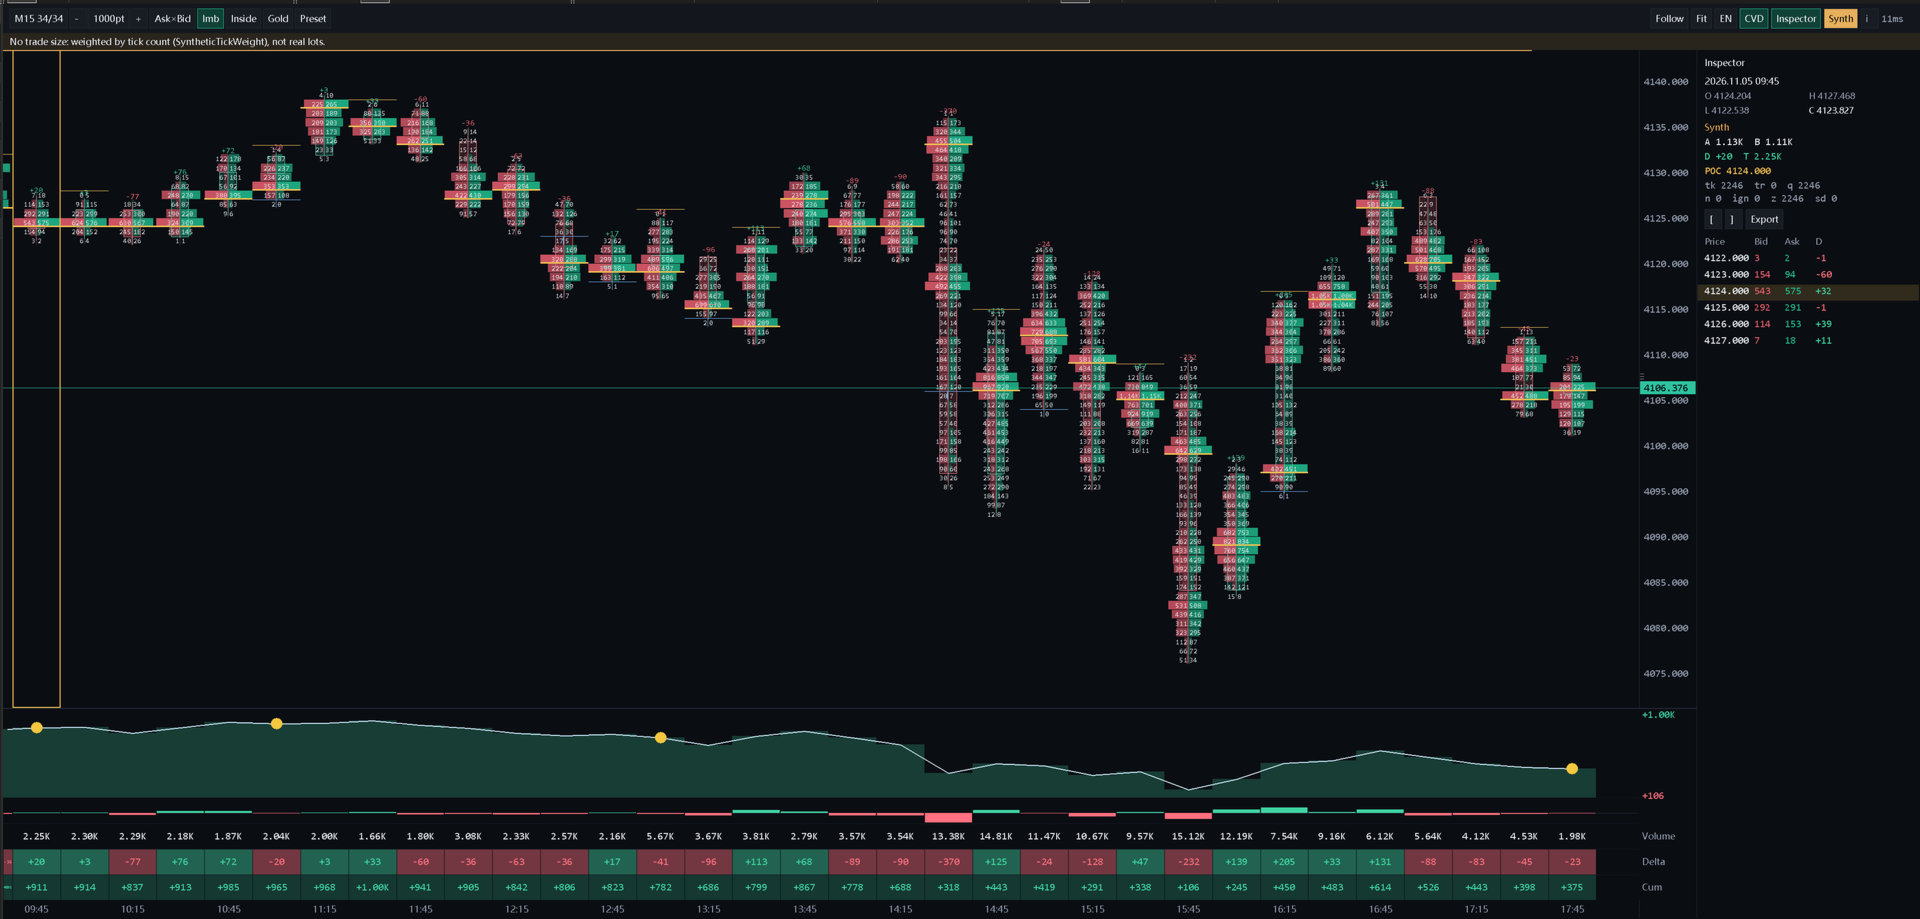
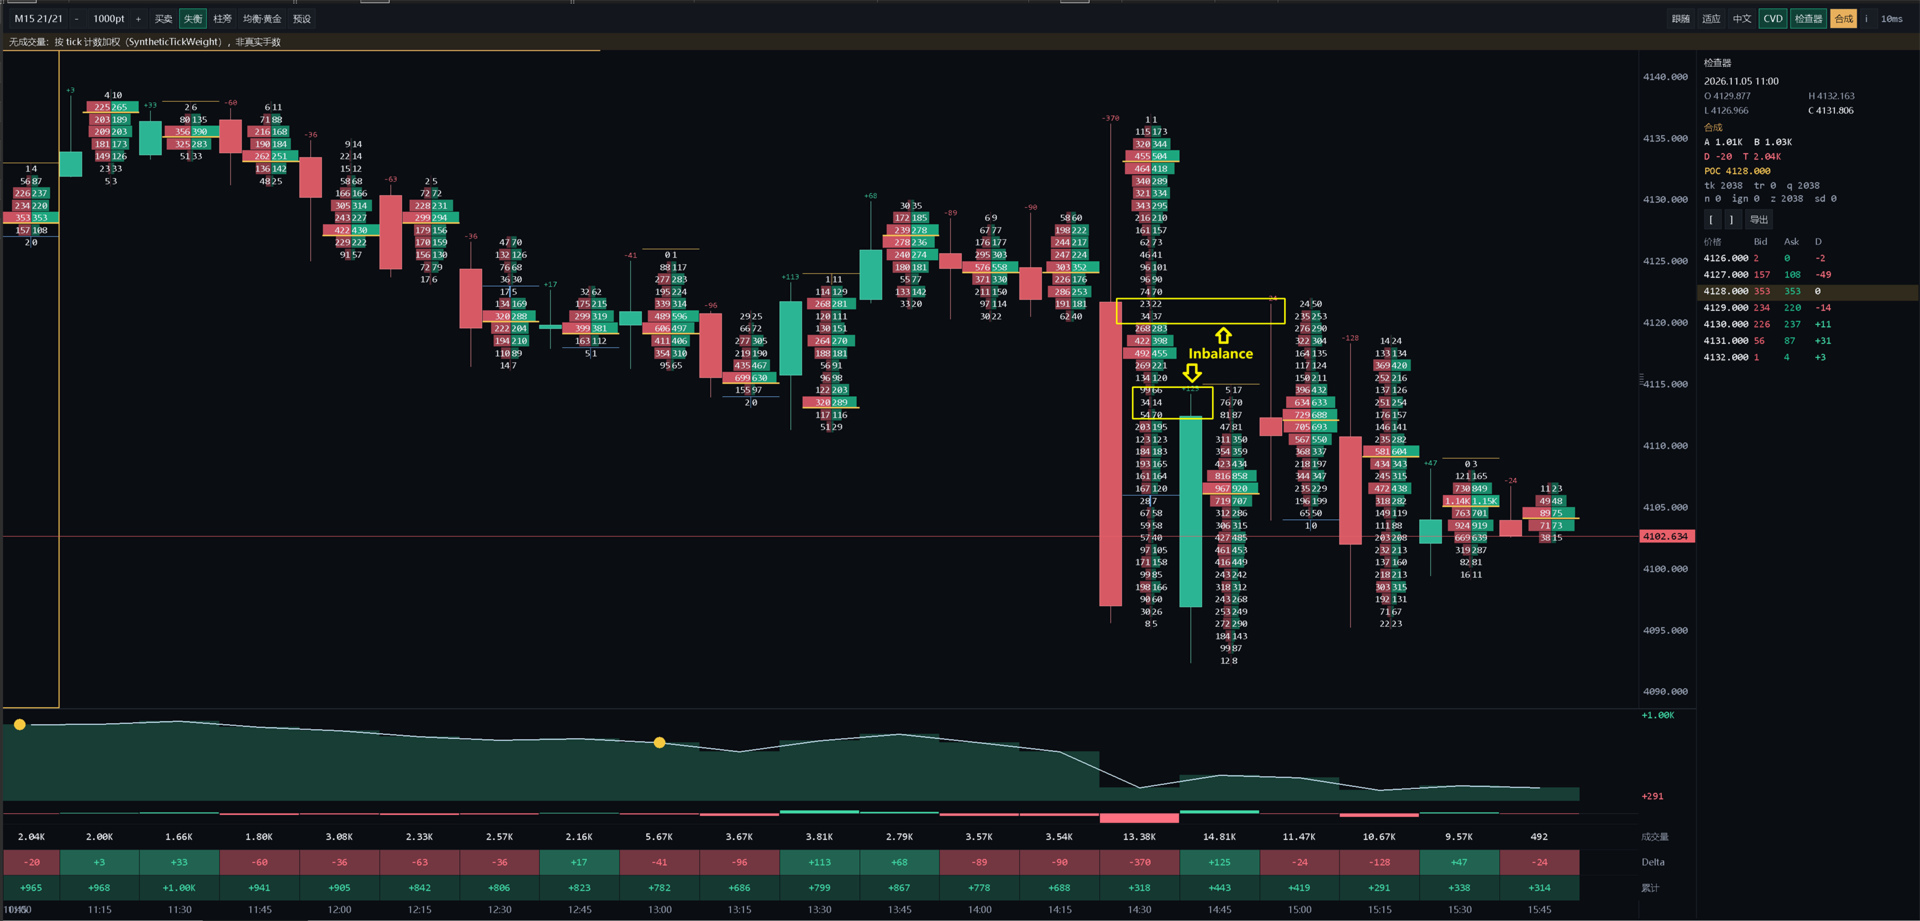
Delta Footprint Chart is a Canvas-based footprint chart indicator for MetaTrader 5. It renders self-drawn candles, numeric Buy×Sell footprint ladders, cumulative volume delta (CVD), and a selected-bar inspector — all on a single bitmap overlay. No chart objects, no buffer plots, no layered windows.

Data Source & Honest Limits

Order-flow style views are built from your broker ticks ( CopyTicks / range APIs). Aggressor side uses AggressorRule_v1. A tick takes the Trade path only when it simultaneously carries Last, volume, and TICK_FLAG_BUY or TICK_FLAG_SELL . Otherwise the quote path synthesizes direction from bid/ask/last movement. The data source chip (amber = Synthetic, green = Trade, blue = Mix) on the toolbar tells you which path produced the numbers.

  • Not exchange Level 2
  • Not a full-market tape
  • Not institutional order flow

This is an honest synthetic footprint for FX/CFD traders — never marketed as exchange depth.

Main Features

  • Footprint ladders — Inside each candle, every price row displays Bid volume (left) and Ask volume (right). Cell heat maps relative volume intensity. When the cell is wide enough, full Ask×Bid digits appear; when narrower, a signed Delta; when too small, a colored glyph.
  • Imbalance & Stacked levels — Rows where one side dominates by a configurable ratio (default 3:1) are highlighted. Consecutive imbalanced rows in the same direction get a stack marker — a visual cue for absorption or exhaustion.
  • POC (Point of Control) — The price row with the highest total volume in each bar is marked with an amber bar.
  • CVD strip — A resizable cumulative volume delta curve below the chart, scaled to the visible window. Optional delta histogram and a three-row data table (Volume / Delta / Cumulative) aligned under each bar.
  • CVD Divergence — Optional yellow circles marking bars where close and CVD moved in opposite directions — a neutral observation, not a trade signal.
  • Inspector panel — Right-side table showing the selected bar's OHLC, total Ask/Bid/Delta, POC price, tick breakdown (trade vs. quote vs. neutral vs. ignored), and a scrollable price-level ladder.
  • Delta table — Per-bar Volume, Delta, and Cumulative Delta values in a compact strip beneath the CVD curve.
  • Independent viewport — Wheel zoom, Shift+Left pan (time + price), price-axis drag to scale. Bars can widen up to 280px each.
  • Instrument presets — One-tick switch between Gold / FX / Index profiles (row size, spread cap, CVD height, colors).
  • Performance presets — Balanced / Gold / Lite / Manual — tune CPU vs. history depth.
  • Bilingual UI — English / Chinese toolbar, inspector, and labels.

How to Install & Use

  1. In MetaTrader 5 → Navigator → Indicators → open DeltaFootprintChart (or drag it onto a chart).
  2. Start with XAUUSD M5 (or your liquid symbol) during market hours so tick ladders fill.
  3. On first attach, leave most defaults. Set Language to English or Chinese, and pick an InstrumentPreset if you want a one-click Gold/FX/Index start.
  4. Click OK. Wait for the first tick rebuild (history depth = HistoryBarsTarget).
  5. Use the mouse wheel to zoom until Bid×Ask digits are readable. If digits stay hidden, raise MaxPxPerBar or zoom further.
  6. Click a candle to pin the inspector. Use toolbar chips for CVD / Inspector / Imbalance / instrument switching.
  7. Empty ladders when the market is closed (no ticks) are normal — wait for live ticks.

Chart Controls (After Attach)

  • Wheel — Zoom bars (px/bar). Digits appear only when bar width and cell height pass the thresholds.
  • Shift + Left-drag — Pan time and price together; any pan clears Follow-last-bar.
  • Left-drag on price axis — Scale the price span (native MT5 feel). Row height and digit font follow.
  • Plain left-drag on chart — Free for MT5 objects (rectangle, etc.); pan is Shift+Left.
  • Double-click price axis or plot, F, or toolbar Fit — Fit visible high/low.
  • Home — Follow latest bar and fit price.
  • [ / ] — Move inspector to older / newer bar. Click plot to pin selection.
  • E — Export selected bar to Common/Files as CSV (honesty header + price,bid,ask,delta rows).
  • I / Esc — Toggle About panel (rule summary, cache key, tick count, self-test status).
  • Ctrl+wheel / Shift+wheel / wheel on price axis — Zoom price span.
  • Drag CVD top edge — Adjust CVD strip height (96–520px before UiScale).
  • Toolbar — instrument preset, layout, volume mode, CVD, inspector, language, About.

Instrument Presets

Preset Performance Row size Spread cap CVD height Palette
Off From inputs From inputs From inputs From inputs From inputs
Gold Gold Manual 50pt 250pt 280px Warm gold/green/red
FX Balanced Auto 80pt 220px Cool blue/green
Index Lite Manual 20pt 400pt 200px Muted gray

Presets change row size, spread cap, CVD height, and colors. They do not drop ticks already in memory. A row or spread change rebuilds ladders only.

Recommended Starter Settings

  • Gold (XAUUSD): InstrumentPreset = Gold, or PerformancePreset = Gold, RowSizeMode = Manual with RowSizePoints suited to your broker digits.
  • FX majors: InstrumentPreset = FX, PerformancePreset = Balanced, RowSizeMode = Auto.
  • Indices: InstrumentPreset = Index, PerformancePreset = Lite if the CPU is busy.
  • Readable UI: UiScale 1.40–1.80, FontSizeUi 14–16, FontSizeDigits 11–13, ShowDeltaTable = true.
  • Clean look: ShowSessionShade = false, HideNativeCandles = true, FollowLastBar = true, RightPaddingBars = 3.

Parameters — How to Configure

Data

  • HistoryBarsTarget — how many bars keep footprint ladders (default 400). Higher = more history, more RAM/CPU.
  • TickChunkSize — soft cap per CopyTicksRange chunk (default 80000).
  • SyntheticTickWeight — weight when tick volume is 0 (default 1.0).
  • MaxSpreadPoints — filter wide spreads: -1 auto (200 metals / 80 FX), 0 off, else points.
  • PreferTradeTicks — use real BUY/SELL flags when the feed provides them (default true).
  • AggressorRuleVersion — keep AggressorRule_v1 for production.
  • EnableSynthesisAudit — debug only; replay/compare synthesis (leave false).

Rows

  • RowSizeMode — Auto (adapts) or Manual.
  • RowSizePoints — bucket height in points when Manual (e.g. gold often needs a larger step).
  • PriceMapMode — SideAware (default), Last, or Mid — how ticks map into price rows.

Footprint

  • LadderLayout — Beside (ladder next to candle) or Inside (inside the body).
  • VolumeDisplay — AskBid (default), Delta, or TotalDelta.
  • ShowImbalance / ImbalanceRatio / MinImbalanceVolume / StackedLevels — imbalance highlight rules (default ratio 3.0, stack 3).
  • MinPxPerBarForDigits / MinCellHeightForDigits — minimum zoom before Bid×Ask numbers paint.

Candles

  • ShowCandles, BodyOpacity, BullColor, BearColor — candle look on the Canvas.

CVD

  • ShowCVD — show the CVD strip (also forced on when the delta table is on).
  • CVDReset — None / Daily / Session / ManualAnchor.
  • SessionTemplate — FX London overlap or Custom; Custom uses SessionStartHour / SessionEndHour.
  • CVDManualAnchorTime — reset anchor when CVDReset = ManualAnchor.
  • ShowSessionShade — soft session wash (default off for a clean solid chart).
  • CvdStripHeight / ShowCvdCurve — strip height and whether the CVD curve draws.

Divergence

  • ShowCvdDivergence — yellow neutral circles on CVD (default true). Not trade arrows.
  • CvdDivMarkSize / CvdDivMarkColor — mark size and color.

Viewport

  • MinPxPerBar / MaxPxPerBar — zoom range (raise Max to keep digits readable; max 280).
  • DefaultBarsVisible — first-load bar count (default 32).
  • FollowLastBar — stick to the live candle until you pan.
  • RightPaddingBars — empty bars to the right of the live candle (default 3).
  • HideNativeCandles — hide MT5 candles so only Canvas candles show (default true).
  • CanvasBehindObjects — keep Bubble/objects paintable above the Canvas.

UI

  • UiScale — global UI scale (default 1.60). Toolbar + inspector scale together.
  • FontSizeUi / FontSizeDigits — UI labels vs footprint digits.
  • ShowDeltaTable / DeltaTableHeight / ShowDeltaHistogram — bottom Volume|Delta|Cum block.

Inspector

  • ShowInspector / InspectorWidth — right-side selected-bar panel.

Performance

  • PerformancePreset — Balanced (default), Gold (heavier / denser), Lite (lighter), Manual (you own TimerMs / caps).
  • TimerMs — refresh timer when Manual (default 75).
  • MaxTicksInStore — tick store cap (default 3,000,000).

Preset

  • InstrumentPreset — Off (keep inputs), Gold, FX, Index. Toolbar can switch live. Off keeps your typed inputs.

Honesty / Language / Colors / Alerts / Debug

  • ShowHonestyBadge — set-file only; not drawn on chart by default.
  • Language — Lang_zh or Lang_en.
  • Ask/Bid/Delta/Imbalance/POC/Background colors — visual theme.
  • Session shade colors / second session — optional shade only; does not reset CVD unless CVDReset = Session.
  • EnableAlerts + cooldown / popup / push / email — optional alerts (default off).
  • VerboseLog — Experts log noise for debugging (leave false).

Honesty Contract

The honesty statement — "Synthetic order flow, not exchange Level 2 / not a full-market tape" — appears in:

  • The #property description (visible in the indicator dialog)
  • The Experts log on init
  • The About panel (toolbar i or press I)
  • Every exported CSV header

The on-chart badge is off by default. The data source chip (Synth / Trade / Mix) in the toolbar always reflects the active classification path.

Architecture

  • One bitmap — All pixels (candles, ladders, axes, CVD, inspector, toolbar) are drawn on a single CCanvas. No OBJ_LABEL, OBJ_TEXT, OBJ_RECTANGLE, or ObjectCreate calls.
  • Tick window is authoritative — Ticks are stored in absolute millisecond time. Bar ladders are a replay cache. A timeframe switch increments the generation, drops all ladders, and discards any in-flight tick copy whose generation no longer matches.
  • Generation guard — m_ctxGen protects against stale CopyTicksRange results during symbol/period switches.
  • Incremental update — The latest bar is updated incrementally as new ticks arrive; completed bars are committed and not re-replayed unless their row size or spread filter changes.
  • Empty-tick handling — When CopyTicksRange returns 0 with no error, the range is retried twice then accepted as empty. Bars with no ticks are marked offline and drawn as candles without ladders — never as fake zero-delta rows.
  • Self-test — RunSelfTest() runs on every OnInit. 45 test cases verify the classification rule, row accumulation, provisional vs. replayed bar, imbalance/stack, cell mode, cache key, and series lookup. A failure shows a red chip on the toolbar.

Performance Presets

Preset History bars Tick cap Timer Default bars Row target
Balanced 500 3,000,000 75ms 32 14
Gold 180 1,200,000 100ms 30 10
Lite 120 600,000 75ms 24 8
Manual 20-800 50K-5M 25-250ms 5+ from input

Balanced auto-selects Gold caps on XAU/GOLD/XAG/SILVER symbols. Timer downloads ticks and replays them; OnCalculate only refreshes rates when the bar count changes. Frame time is shown on the toolbar and turns amber above 16ms.

Expected Behavior

Closed market / no ticks results in empty footprint is normal. Same symbol on different brokers can produce different ladders. Synthesis is honest Path A for FX/CFD when trade flags are absent — never marketed as exchange L2.

Complements

Works alongside bubble-style delta tools and session volume profile workflows. This product is a footprint + CVD chart — not a bubble clone and not a session VP replacement.

Disclaimer

For analysis only. No profit claims. Always manage your own risk.
Produits recommandés
WaveMaster Oscilloscope transforms your MT5 chart into a professional-grade oscilloscope -  a precision instrument that converts market behavior into a live, multi-channel waveform. Instead of guessing what price is "doing," you simply watch it happen in real time. Inspired by the signal-analysis tools used in advanced electronics laboratories, WaveMaster oscilloscope   reads the pulse of the market and renders it as a beautiful, animated waveform directly on your chart. This is not another lin
FREE
Aussenstab Markttechnik
Alexander Josef Zeidler
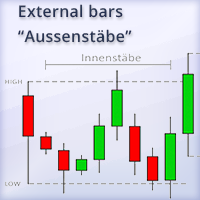
This indicator shows external bars ("Aussenstäbe") in the chart in candle form. The colors of the candles can be set individually. Also different colors for bearish and bullish bars are possible. In addition, the color of the wicks or outlines is also adjustable. Outside bars are mentioned e.g. by Michael Voigt in the book "Das große Buch der Markttechnik". All other candles are inner bars.
Fixed Range Volume Profile is an MT5 volume analysis tool that calculates and displays volume distribution across any custom price and time range using standard chart trendlines for Forex, Gold (XAUUSD), Indices, and Crypto. Designed for day trading, scalping, and swing trading, this indicator automatically maps the Point of Control (POC), Value Area boundaries (VAH/VAL), and high-volume support and resistance levels without requiring manual object naming or complex setup. Core Volume Profile Ar
Institutional Orderflow Entry Scanner Volume Profile • Value Area • Order Blocks • Multi-Symbol Scanner Turn your chart into a professional institutional order-flow cockpit. This indicator scans up to 60 Market Watch symbols in real time, detects high-probability setups from three proven Value-Area strategies, and delivers clean, actionable entries with institutional-grade risk management — all on a single, flicker-free interface. What It Does The scanner continuously analyses the previous sess
ForeCastX AI
Marco Engstermann
ForeCastX AI est un indicateur graphique pour MetaTrader 5. Il affiche une coloration de tendance selon les swings, des flèches d’achat et de vente, des zones d’offre et de demande, un panneau de force acheteur/vendeur sur plusieurs unités de temps, et un tracé optionnel. Ce tracé est un schéma visuel basé sur la structure récente et le panneau. Ce n’est pas une prévision de prix ni un signal de trading à lui seul. Sur le graphique Bougies colorées selon la tendance de swing en cours Flèches lor
1. GENERAL OVERVIEW AND ARCHITECTURAL PHILOSOPHY. TradeRadar LITE V3.4 represents an advanced, quantitative analytical multi-symbol and multi-timeframe scanner indicator engineered exclusively for the MetaTrader 5 platform. The overarching architectural philosophy behind this software is to eliminate subjective chart reading by translating standard Price Action and Smart Money Concepts (SMC) into a strict, mathematically driven algorithmic scoring model. Unlike conventional indicators that rely
Algo Trading Indicaor MT5 The ATC ALGO indicator has been developed to work on the MetaTrader 5 platform. It has the same specifications and zones as the MetaTrader 4 version. There may be slight lag, which we believe is due to differences in MetaTrader 5 programming. We will work on improving it, God willing. MT5 Version                    https://www.mql5.com/en/market/product/170028 MT4 Version                    https://www.mql5.com/en/market/product/88034 With this indicator , you’ll have
=================================================================================== PRODUCT DESCRIPTION: KRYPTON TREND KINETIC PRO BY VERITASALGO =================================================================================== Krypton Trend Kinetic Pro (KTK) is a high-performance mathematical model and trend-following system designed exclusively for the MetaTrader 5 platform. Engineered specifically to meet the strict listing requirements of the MQL5 Market, this premium analytical tool offe
The Beta index, also known as the Beta indicator, is one of the key reference indicators for hedging institutions. It allows you to measure the relative risk of individual assets, such as currencies and commodities, in comparison to market portfolios, cross-currency pairs, the U.S. dollar index, and stock indices. By understanding how your assets perform in relation to market benchmarks, you will have a clearer understanding of your investment risk. Key Features: Accurate Risk Assessment: The Be
TrendFactor
Vitalii Zakharuk
Trend Factor is an indicator based on the calculation of price values ​​to answer questions about what direction the trend is acting on the market at the moment and when this trend will end. By launching the Trend Factor indicator, the user will see two lines and bars of different colors, which can change color to green during an uptrend, to red during a downtrend or to be yellow during an uncertainty. The trader uses the Trend Factor indicator to determine the market situation. This is a tre
Advanced Market Pressure Indicator - Professional Trading Tool Stop Guessing. Start Trading with Precision. WHAT IT DOES This indicator reveals WHO controls the market - Buyers or Sellers - and predicts their next move using advanced algorithms. 5 Powerful Systems in ONE Indicator: Real-Time Pressure Analysis - Shows exact buyer/seller force (0-100%) Automatic Divergence Detection - Catches reversals BEFORE they happen AI Confidence Score (70-100%) - Filters out false signals automat
Multi-Timeframe Breakout Pressure and Confirmation Dashboard TAGLINE Track compression, stored pressure, breakout direction, and confirmation in one dashboard. PRODUCT OVERVIEW BreakoutPulse Navigator MT5 is a professional multi-timeframe breakout dashboard for MetaTrader 5. It is designed to detect two different stages of a breakout: 1. Pressure building before the breakout 2. Directional confirmation after price leaves the channel The indicator combines: - Bollinger Band squeeze - ATR
FREE
HA Pullback Resume MT5 Systematic Trend Retracement and Momentum Resumption Engine The HA Pullback Resume indicator for MetaTrader 5 provides an objective analytical framework designed to identify high-probability trend-continuation setups following shallow corrective pullbacks. Active intraday traders and scalpers frequently encounter execution timing errors during trend pauses: entering prematurely before a correction completes, suffering stop-outs from erratic boundary wicks during quiet cons
Candle Stick Timer Indicator ️ Know Your Candle. Know Your Time. Trade With Confidence. Stop guessing when the current candle will close.   Candle Stick Timer Indicator   gives you a clear, real-time countdown directly on your trading chart, helping you stay aware of every second of the candle’s formation. Whether you trade   Forex, Gold, Crypto, Indices, or other markets , this indicator helps you monitor candle timing without constantly checking the clock. Key Features ️   Real-Time Candl
Anchored VWAP Trading Indicator Struggling to identify true market value and key support/resistance levels? The Anchored VWAP Trading Indicator helps you track price based on real traded volume, giving you a clear edge in your trading decisions. This tool allows you to anchor VWAP from any point on the chart, making it ideal for analyzing trends, reversals, and institutional activity. Key Features Anchored VWAP from any candle Accurate volume-weighted price calculation Works on all symbol
The Commissioner indicator is very sensitive to current price activity and displays signals quite well. Reacts quickly to trend changes, clearly shows the price movement. The colored version of the indicator signals a trend change. The indicator allows you to see a rising or falling trend. In addition to the direction of the trend, the indicator shows the change in the slope, the analysis of which allows you to filter signals using filters by angle, this can be used when building a bot with th
The Trend Strength Meter Core  is a powerful on-chart dashboard designed to give you an instant, clear reading of the current market momentum . By combining the data from Moving Averages, RSI, and MACD, it calculates a highly accurate Trend Score (0 to 100), ensuring you always trade on the right side of the market . Key Features Advanced Confluence Algorithm: Calculates a dynamic score by analyzing price position relative to MA, RSI overbought/oversold zones, and MACD signal crossovers . Enhanc
FREE
Strength Candles
Luis Paulo Rodrigues Pastor
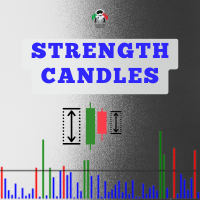
Indicator in histogram format, which is calculated using data on financial volume, tick volume and the body of the bar. It is possible to visualize moments where there was a large entry of volume, both financial and in ticks, and that the market managed to progress and advance in one direction (up or down) due to the size of the bar body, which is where there really was a victory for one side of the negotiation (buyers and sellers). By default, all bars in the indicator's histogram are colore
VProfile Rebounce Scanner Pro Institutional Volume Profile Entries — Automated Across Your Entire Market Watch Stop guessing where price will react. Let the market's own volume tell you. Every session, the market builds a footprint — where the heaviest trading actually happened, not just where price wandered. That footprint is the Value Area and its center, the Point of Control (POC). Institutions build positions around these levels. Retail traders usually can't see them at all, let alone act o
FREE
Sequence Algo
Itumeleng Mohlouwa Kgotso Tladi
SEQUENCE ALGO - Your Trading Edge Unlock Market Opportunities with Precision Signal Intelligence SEQUENCE ALGO is a sophisticated trading indicator designed to help you identify high-probability entry and exit points in real-time. Built for traders who demand accuracy and clarity in their decision-making process. Key Benefits: Clear Visual Signals   - Eliminate guesswork with intuitive BUY and SELL alerts that cut through market noise and highlight potential trading opportunities. Real-Time Ana
Order Block Detector
Cao Minh Quang
5 (2)
Automatically detect bullish or bearish order blocks to optimize your trade entries with our powerful indicator. Ideal for traders following ICT (The Inner Circle Trader). Works with any asset type, including cryptocurrencies, stocks, and forex. Displays order blocks on multiple timeframes, from M2 to W1. Alerts you when an order block is detected, migrated, or a higher timeframe order block is created/migrated. Perfect for both scalping and swing trading. Enhanced by strong VSA (Volume Spread A
Vision : description du produit Vision par Quant Atlas est un indicateur de signaux de retournement multi composants, conçu pour identifier les points d’essoufflement haussiers et baissiers à court terme sur les marchés liquides. Le modèle agrège plusieurs couches indépendantes de preuves techniques, notamment le comportement du momentum, la pression de retour à la moyenne, les conditions fondées sur la volatilité, l’interaction avec la tendance, la structure temporelle et les confirmations liée
UGenesys Volume MT5
Odaine Ramon Mcmillan
50% Off Today Only! Price Goes Back Up at 11 PM (EST) uGenesys Volume Indicator: Your Key to Mastering Market Volume Analysis What Traders Are Saying: "A must-have indicator...really a game-changer." – wuzzy66 "Amazing indicator...strongly recommend to beginners." – joinbehar Understanding Market Volume:   Volume in the market is a critical indicator of movement and opportunity. The uGenesys Volume Indicator is specially crafted to pinpoint when the market has the most volume, allowing you to
is a versatile analytical tool designed for both advanced traders and beginners. It combines classic trend line analysis with automatic Fibonacci level plotting to deliver precise market entries and structural clarity. Built as an intuitive and clean on-screen dashboard, this indicator simplifies multi-timeframe analysis without cluttering your main workspace. Technical Analysis and Entry Points The indicator automates the most critical aspects of price action and structural trading: Trend L
Simplify forex analysis: evaluate currency strength with ease This indicator evaluates all eight individual currencies by reading major, minor and crosses pairs using an indicator of your choice, and processing each currency into an index, which you can use to know the market situation of any particular currency in a simple, familiar and understandable way. [ Installation Guide | Update Guide | Troubleshooting | FAQ | All Products ] Find strong and weak currencies at a glance Compare one curren
Here's a post-ready description. It uses emoji and plain formatting, so it pastes cleanly into Telegram, MQL5 or a forum. Dynamic SMC & Market Structure PRO (MT5) A complete Smart Money Concepts toolkit on one clean chart: market structure, supply and demand, key liquidity levels, and a live dashboard. It is light on the chart and built to run without lag. What it shows BOS & CHoCH: automatic structure breaks. A break in the trend's direction is labelled BOS, and a break against it is labe
No Wick Candle Scanner is a powerful, lightweight tool built for MetaTrader 5 designed to isolate pure market momentum. In trading, candles that close without an upper or lower tail (wick) represent absolute dominance by buyers or sellers. This indicator scans your charts in real-time, instantly flagging these high-probability momentum bars with clean visual markers, allowing you to catch strong trend continuations and sudden breakouts with ease. Key Advantages & Features: 6-in-1 Filtering Matr
FREE
Level Alert Utility is an essential workflow tool for MetaTrader 5 designed to eliminate constant screen fatigue. Effortlessly drag the interactive level line directly on your chart—the indicator instantly configures trigger rules and delivers real-time notifications via customizable sound repeats, popup alerts, mobile Push notifications, and email. Equipped with high-speed millisecond monitoring, gap and impulse protection, quick-action chart buttons, hotkey support, and state persistence acros
Pro Traders Dynamic Index TDI rsi BB Signal Filter - Technical Specification and User Manual 1. Product Overview and Structural Architecture Pro Traders Dynamic Index TDI rsi BB Signal Filter is a multi-layered technical analysis indicator developed natively for the MetaTrader 5 trading platform. The architecture integrates the mathematical models of the classic Traders Dynamic Index (TDI), an adaptive dual-speed Relative Strength Index (RSI) dynamic line engine, baseline volatility envelope ch
Symbol Changer Indicator This is a simple yet intuitive indicator.  The indicator provide easy navigation across various symbols and across different time frames all in a chart. The buttons are displayed on the main chart. It is flexible and easy to use with fast response speed. FEATURES         Use Custom Pairs : If set to true, load all the available symbols in the Market Watch. No means it loads the pairs selected below.     Pairs (Separated by Comma) : This enables selected pairs
Les acheteurs de ce produit ont également acheté
Gann Made Easy   est un système de trading Forex professionnel et facile à utiliser qui est basé sur les meilleurs principes de trading en utilisant la théorie de mr. WD Gann. L'indicateur fournit des signaux d'ACHAT et de VENTE précis, y compris les niveaux Stop Loss et Take Profit. Vous pouvez échanger même en déplacement en utilisant les notifications PUSH. VEUILLEZ ME CONTACTER APRÈS L'ACHAT POUR RECEVOIR GRATUITEMENT DES INSTRUCTIONS DE TRADING ET D'EXCELLENTS INDICATEURS SUPPLÉMENTAIRES! V
Entry Points Pro vous montre où entrer, où placer le stop et avec quel lot trader — avant que vous ne passiez l'ordre. PRIX Actuellement 149 USD, et c'est le dernier exemplaire à ce prix. Ensuite, le prix passe à 199 USD, et le prix final est de 349 USD. Je gagne ma vie en tradant sur les marchés, et je le montre, donc je n'ai pas besoin de vendre cet indicateur à tout le monde. C'est un outil pour les traders qui réfléchissent par eux-mêmes, pas un bouton magique. La flèche apparaît à la clôtu
Ultra Indicator
Ihor Otkydach
5 (1)
ULTRA est un indicateur technique « tout-en-un » : il analyse le marché de manière autonome, génère des signaux de trading, affiche les niveaux permettant de définir des ordres stop-loss et suggère le moment opportun pour clôturer les positions afin de sécuriser les bénéfices ou de minimiser les pertes. En d'autres termes, peu importe que vous ne sachiez pas analyser le marché, déterminer les niveaux (où placer votre stop-loss) ou que vous ayez du mal à gérer votre capital. ULTRA s'occupera de t
M1 Sniper MT5
Oleg Rodin
5 (7)
M1 SNIPER   est un système d'indicateurs de trading facile à utiliser. Il s'agit d'un indicateur à flèche conçu pour l'unité de temps M1. Cet indicateur peut être utilisé seul pour le scalping sur l'unité de temps M1 ou intégré à votre système de trading existant. Bien que conçu spécifiquement pour le trading sur l'unité de temps M1, ce système peut également être utilisé avec d'autres unités de temps. Initialement, j'avais conçu cette méthode pour le trading du XAUUSD et du BTCUSD. Cependant, j
Adaptive Price Action Engine Achetez un indicateur, obtenez l'EA gratuitement Analyse auto-optimisée des tendances et des figures de chandeliers Multi-Timeframe Les marchés évoluent constamment, et tous les modèles de Price Action n’ont pas la même valeur dans toutes les conditions de marché. Adaptive Price Action Engine a été conçu pour s’adapter aux changements du marché en combinant structure de tendance, analyse Multi-Timeframe, figures de chandeliers et optimisation statistique au sein d’un
Auto Optimized SpeedAngle est un système de vectorisation du momentum de niveau institutionnel qui élimine l'ajustement de courbe ( curve-fitting ) grâce à une optimisation continue par avancement ( Walk-Forward Optimization , WFO). Plutôt que de s'appuyer sur des entrées statiques qui se dégradent lorsque les régimes de marché changent, l'indicateur recalibre dynamiquement ses paramètres en utilisant une validation hors échantillon ( Out-of-Sample , OOS), garantissant ainsi que les signaux affi
Boba Analysis Suite
Trade Ready Solutions LLC
5 (2)
Boba Analysis Suite Boba Analysis Suite est un indicateur d’analyse pour MetaTrader 5. Il réunit la structure du marché, les zones de prix pertinentes et le contexte général du marché dans une même vue graphique. Développé à partir de l’expérience pratique d’un trader et formateur en trading, il accompagne une démarche d’analyse structurée : évaluer la direction du marché, identifier les niveaux importants et analyser plusieurs unités de temps conjointement. Une analyse en contexte La significat
Scalper Vault est un système de trading puissant et complet, conçu pour les traders en quête de régularité dans le cadre du trading intrajournalier. Cet indicateur de haute précision constitue un système de trading autonome et exhaustif, offrant des analyses de qualité institutionnelle, aussi bien pour le Forex que pour les options binaires. VEUILLEZ ME CONTACTER APRÈS VOTRE ACHAT POUR OBTENIR MES CONSEILS DE TRADING AINSI QU'UN EXCELLENT BONUS ! En éliminant les incertitudes et les analyses man
Apex Patterns PRO Achetez l'indicateur - Obtenez GRATUITEMENT l'Expert Advisor basé sur celui-ci. Intelligence auto-optimisée des figures chartistes et des cassures Les scanners de figures traditionnels s'appuient sur des paramètres fixes, sous-performant souvent lorsque la volatilité et les structures du marché changent. Apex Patterns PRO est conçu pour s'adapter aux conditions changeantes du marché en combinant la reconnaissance des figures chartistes structurelles, le filtrage du momentum et
Volatility Master for MetaTrader is a real-time dashboard tool that scans up to  50 symbols  to identify high-volatility , trending markets instantly. With bullish/bearish signals, customizable alerts, and a user-friendly interface, it helps you avoid range-bound conditions and focus on high-probability trades. Clarity leads to confidence. Trade confidently and protect your capital effectively with this powerful dashboard. We don't offer free or bonus indicators in exchange of reviews from you.
SIO Oscillator : oscillateur auto-optimisé de déséquilibre de semi-variance Achetez l’indicateur et recevez GRATUITEMENT l’Expert Advisor (EA) basé sur celui-ci. La plupart des oscillateurs traitent tous les mouvements de prix de la même manière. SIO sépare la pression haussière de la pression baissière et mesure le déséquilibre entre les deux, montrant quel camp contrôle réellement le marché : les acheteurs ou les vendeurs. Lorsque le déséquilibre atteint un extrême, SIO génère un signal clair
Indicateur de force et de momentum multi-devises MT5 Dynamic Forex28 Navigator est l'évolution de nos indicateurs populaires de longue date et réunit la puissance de trois outils en un : Advanced Currency Strength28 Indicator (700 avis) Advanced Currency IMPULSE with ALERT (530 avis) CS28 Combo Signals (bonus actuel) Les deux indicateurs précédents totalisent plus de 1 200 avis sur le MQL5 Market et font partie des outils incontournables de la communauté MT4 depuis 2016. Dynamic Forex28 Navigato
Neuro Poseidon MT5
Daria Rezueva
4.68 (53)
Neuro Poseidon is a new indicator by Daria Rezueva. It combines precise trading signals with adaptive TP/SL levels - creating best possible trades as a result! Message me and get  Neuro Poseidon Assistant  as a gift to automize your trading process! What makes it stand out? 1. Proven profitability on all assets and timeframes 2. Only confirmed BUY and SELL signals present on the chart 3. Adaptive TP & SL levels generated by the software for each trade 4. Easy to understand - suitable for al
AriFocus
Temirlan Kdyrkhan
AriFocus - Non-Repainting Buy/Sell Signals AriFocus - one clear signal. AriFocus marks buy and sell signals directly on the chart and suggests a stop-loss level for each one. Every signal is confirmed on bar close and never repaints. - Buy/sell arrows, confirmed on bar close - Suggested stop-loss level for every signal - Trend band and candle coloring to show direction at a glance - 10 ready-made presets, or your own settings (14 calculation methods) - Pop-up, push and email alerts with entr
Currency Strength Wizard   est un indicateur très puissant qui vous offre une solution tout-en-un pour un trading réussi. L'indicateur calcule la puissance de telle ou telle paire de devises en utilisant les données de toutes les devises sur plusieurs périodes. Ces données sont représentées sous la forme d'un indice de devise facile à utiliser et de lignes électriques de devise que vous pouvez utiliser pour voir la puissance de telle ou telle devise. Tout ce dont vous avez besoin est d'attacher
Advance AI Scanner
Mohamed Samsudeen
5 (1)
Advance AI Scanner is a multi-symbol analysis indicator for MetaTrader 5. It scans Forex pairs, metals, energy, stock indices and cryptocurrencies at the same time and rates each instrument with its own self-training model. It explains in plain English what moved each market and why, and it estimates how far upcoming economic news usually moves each symbol, measured on your broker's own price history. $199 instead of $499. 10 copies left at this price. One time purchase  Installation and User
Azimuth Pro
Ottaviano De Cicco
5 (7)
Azimuth Pro V2: Synthetic Fractal Structure and Confirmed Entries for MT5 Overview Azimuth Pro is a multi-level swing structure indicator by Merkava Labs . Four nested swing layers, swing-anchored VWAP, ABC pattern detection, three-timeframe structural filtering, and closed-bar confirmed entries — one chart, one workflow from micro-swings to macro-cycles. This is not a blind signal product. It is a structure-first workflow for traders who care about location, context, and timing. Halloween P
SkyHammer Signal Pro Indicateur professionnel de signaux de tendance sans repaint, avec niveaux Entry, SL et TP verrouillés SkyHammer Signal Pro est un indicateur de tendance et de momentum structuré, conçu pour les traders qui recherchent des signaux clairs, fixes et vérifiables. Il fonctionne le mieux sur les timeframes courts, comme M1 et M5 . L’indicateur ne cherche pas à prédire les sommets ou les creux du marché. Il attend plutôt une structure de marché confirmée, une direction de tendance
Bill Williams Advanced
Siarhei Vashchylka
5 (11)
Bill Williams Advanced is designed for automatic chart analysis using Bill Williams' "Profitunity" system. The indicator analyzes four timeframes at once. Manual (Be sure to read before purchasing) Advantages 1. Analyzes the chart using Bill Williams' "Profitunity" system. Signals are displayed in a table in the corner of the screen and on the price chart. 2. Finds all known AO and AC signals, as well as zone signals. Equipped with a trend filter based on the Alligator. 3. Finds "Divergence Bar
Apollo SR Master est un indicateur de support/résistance doté de fonctionnalités spéciales qui simplifient et fiabilisent le trading basé sur les zones de support/résistance. Cet indicateur calcule ces zones en temps réel, sans aucun décalage, en détectant les sommets et les creux locaux des prix. Pour confirmer la nouvelle zone de support/résistance, il affiche un signal spécifique indiquant que cette zone peut être prise en compte et utilisée comme un véritable signal d'achat ou de vente. Dans
Divergence Bomber
Ihor Otkydach
4.89 (94)
Chaque acheteur de cet indicateur reçoit également gratuitement : L’outil exclusif « Bomber Utility », qui accompagne automatiquement chaque opération de trading, fixe les niveaux de Stop Loss et de Take Profit, et clôture les positions selon les règles de la stratégie Des fichiers de configuration (set files) pour adapter l’indicateur à différents actifs Des set files pour configurer le Bomber Utility selon différents modes : « Risque Minimum », « Risque Équilibré » et « Stratégie d’Attente »
Superhero
Ihor Otkydach
5 (3)
L'indicateur SUPERHERO est un système de trading multidevises conçu selon un principe « tout compris ». Cet indicateur analyse le marché de manière autonome et fournit des signaux indiquant quand ouvrir et clôturer des positions. Il utilise des ordres Stop Loss et Take Profit. Le rapport R:R est de 1:1. Ce système peut envoyer des notifications push sur votre smartphone, ce qui vous permet de passer des ordres « où que vous soyez », sans avoir à rester devant un ordinateur. C'est la solution idé
TREND LINES PRO     Cet indicateur permet de comprendre les véritables changements de direction du marché. Il révèle les renversements de tendance et les points de retour des principaux acteurs. Tu vois     Lignes BOS     Détection des changements de tendance et des niveaux clés sur des unités de temps supérieures, sans paramètres complexes ni interférences inutiles. Les signaux restent affichés sur le graphique même après la fermeture de la bougie. VERSION MT 4    -     Révèle son potentiel max
FootPrint Chart MT5
Gayathiri Gopalakrishnan
5 (1)
Turn every candle into a bid x ask footprint built from real tick data. See who is actually trading at each price, with delta, volume profile, imbalance zones and a scored setup engine that prints entry, stop and target Order Flow Footprint Chart Pro Most indicators tell you what price did. This one tells you who did it. Order Flow Footprint Chart Pro rebuilds every candle on your chart from raw tick data and shows you the volume that traded at each individual price inside it, split into the am
Quantum TrendPulse
Bogdan Ion Puscasu
5 (26)
Présentation de   Quantum TrendPulse   , l'outil de trading ultime qui combine la puissance de   SuperTrend   ,   RSI   et   Stochastic   dans un seul indicateur complet pour maximiser votre potentiel de trading. Conçu pour les traders qui recherchent précision et efficacité, cet indicateur vous aide à identifier les tendances du marché, les changements de dynamique et les points d'entrée et de sortie optimaux en toute confiance. Caractéristiques principales : Intégration SuperTrend :   suivez f
Advanced Supply Demand MT5
Bernhard Schweigert
4.53 (15)
La meilleure solution pour tout commerçant débutant ou expert ! Cet indicateur est un outil de trading unique, de haute qualité et abordable car nous avons intégré un certain nombre de fonctionnalités propriétaires et une nouvelle formule. Avec cette mise à jour, vous pourrez afficher des zones à double horaire. Vous pourrez non seulement afficher un TF plus élevé, mais afficher les deux, le graphique TF, PLUS le TF supérieur : AFFICHAGE DES ZONES NICHÉES. Tous les traders Supply Demand vont ado
L'indicateur UZFX {SSS} Scalping Smart Signals v5.0 MT5 est un indicateur de trading haute performance sans « repaint », conçu pour les scalpers, les day traders et les swing traders qui recherchent des signaux précis et en temps réel sur des marchés très volatils. Développé par (UZFX-LABS), cet indicateur combine l'analyse de l'action des cours, la confirmation des tendances et un filtrage intelligent pour générer des signaux d'achat et de vente à forte probabilité, des signaux d'alerte et des
PainX GainX Blue Spike Fusion AI Synthetic Index Spike Analysis Indicator for MetaTrader 5 Overview PainX GainX Blue Spike Fusion AI is a technical analysis indicator for MetaTrader 5, designed to help traders monitor potential spike setups on compatible synthetic indices. The indicator combines signal monitoring, market-condition analysis, chart markers, notifications, and an on-chart information panel. It presents relevant market information in an organized format to help traders evaluate pote
ARIPoint
Temirlan Kdyrkhan
1 (4)
ARIPoint is a powerful trading companion designed to generate high-probability entry signals with dynamic TP/SL/DP levels based on volatility. Built-in performance tracking shows win/loss stats, PP1/PP2 hits, and success rates all updated live. Key Features: Buy/Sell signals with adaptive volatility bands Real-time TP/SL/DP levels based on ATR Built-in MA Filter with optional ATR/StdDev volatility Performance stats panel (Success, Profit/Loss, PP1/PP2) Alerts via popup, sound, push, or email Cu
Bonjour à tous les traders ! De nombreux investisseurs individuels utilisent des scripts web lents. Une approche systématique est essentielle pour un trading rentable. L'indicateur Astro AI n'est pas un simple affichage sur un graphique. Il s'agit d'un réseau neuronal sophistiqué composé de deux agents fonctionnant directement dans le terminal. Détails techniques du système : 1. Agent 1 : Analyste (Réseau neuronal graphique – GNN) Le marché n'est pas constitué de barres de prix individuelle
Plus de l'auteur
Pre-Purchase Notice:   This indicator performs best on zero-spread accounts or fixed-spread accounts — i.e., broker accounts that do not widen spreads during news events. Prefer to use the Exness Zero-spread account. DeltaVolumeBubble — Volume Bubble Indicator A visualization tool distilled from Order Flow Delta. Using   bubble size × color , it lets you instantly read the true bull-bear battle behind every single candlestick. What Problem Does This Indicator Solve? Price can deceive you, bu
Scalp Quick Panel Pro — One-Click Scalping & Visual Planner (v13) Scalp Quick Panel Pro is a lightweight on-chart trading panel designed for manual and scalping traders. It integrates one-click execution, lot management, position management, daily P&L tracking, and a Visual Trade Planner into one compact UI. Key Highlights One-Click Execution: Market BUY/SELL with fixed SL/TP and async sending. Visual Planner: Drag Entry/SL/TP tags on the chart. Auto lot sizing based on fixed USD risk. Positi
Session Volume Profile Session Volume Profile (SVP) is a professional trading indicator for MetaTrader 5 that visualizes volume distribution across major trading sessions. It divides each trading session into three time segments and color-codes them, allowing traders to identify institutional vs. retail activity zones at a glance. Key Features Four Trading Sessions — Independently calculates and displays Volume Profiles for Sydney, Asia, Europe, and US sessions. Each session can be individually
Overview InRangeVP is an MT5 main-chart indicator designed for interactive Range Volume Profile . It allows you to select any time window using two vertical lines or a range rectangle. The indicator then constructs a true cumulative Value Area within that specific window, rendering the POC, VAH, VAL, a Canvas histogram, and a compact info bar. It is built for discretionary traders who need to study acceptance and rejection inside a custom swing, impulse, or consolidation—rather than relying on f
Filtrer:
Aucun avis
Répondre à l'avis