Cardwell Range Pro
- インディケータ
-
Shipra Gupta
 私はShipra Gupta、数学、経済学、アルゴリズム取引システムに強いバックグラウンドを持つトレーダー兼クオンツ戦略開発者です。これまで、Forex、ゴールド、指数、コモディティ、暗号資産市場に幅広く携わり、一貫性、精度、規律ある執行を重視したデータ駆動型の取引戦略を構築してきました。
 - バージョン: 1.0
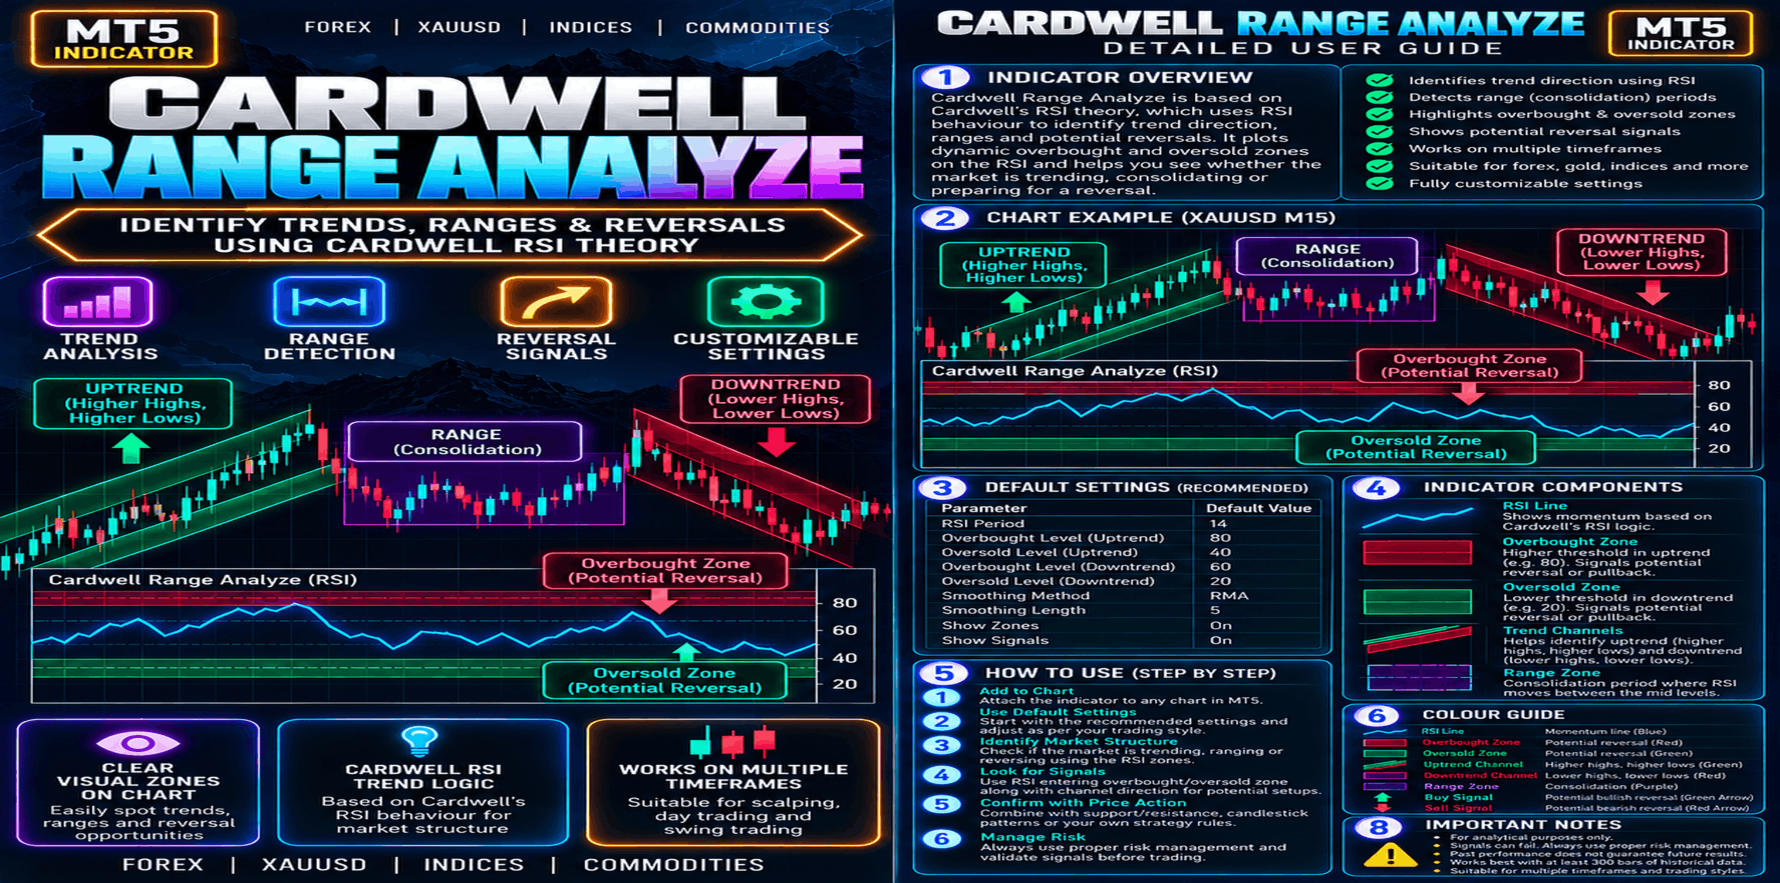
Cardwell Range Analyze
Is RSI really overbought — or is the market simply trending strongly? Could the same RSI reading mean something different when the market regime changes?
Cardwell Range Analyze — An RSI Range and Momentum Analysis Indicator for MetaTrader 5
Traditional RSI analysis often focuses on fixed overbought and oversold levels, but momentum can behave differently in trending and ranging markets. Cardwell Range Analyze is a MetaTrader 5 indicator designed for traders who want to examine RSI ranges and relative strength behavior as part of a broader market analysis process.
Inspired by Cardwell-style RSI interpretation, this MT5 indicator supports a more context-aware approach to momentum analysis. It can complement technical strategies for forex, gold, indices, and other supported instruments, helping traders study RSI behavior alongside price structure rather than interpreting an oscillator reading in isolation.
MT5 Expert Advisor Collection
Explore automated systems built for Gold & Bitcoin, covering breakout, scalping, momentum and multi-horizon strategies.
Gold: Range Striker | Gold Flash | Vortex Pro | Neural Scalper | Titan Forge | Quantum Pulse | GoldGridBreakout | Gold Micro Account | Gold Cortex AI
Bitcoin: BTC Strike | Alpha Vault | Edge Pilot
Nasdaq: Nasdaq Sniper Open
Key Features
-
RSI Range Analysis: Examine relative strength behavior within different market conditions.
-
Momentum Context: Support a broader interpretation of RSI movement.
-
Trend-Oriented Analysis: Help traders study momentum behavior alongside directional price movement.
-
Technical Analysis Integration: Combine RSI observations with price action, support and resistance, or other indicators.
-
Multi-Timeframe Use: Explore RSI behavior across supported symbols and chart periods.
How to Use
-
Add Cardwell Range Analyze to a chart in MetaTrader 5.
-
Review and configure the available parameters.
-
Observe RSI behavior alongside the prevailing price structure and trend.
-
Compare readings across historical periods and different market conditions.
-
Evaluate whether the indicator complements your existing analysis process.
Who Is This Indicator For?
Cardwell Range Analyze may suit RSI users, momentum traders, technical analysts, and traders who want to investigate how relative strength behaves beyond fixed threshold interpretations. It can be used as a supplementary tool when researching or refining a trading methodology.
Compatibility and Customization
Designed for MetaTrader 5. Available input settings can be adjusted according to individual analysis preferences. Indicator behavior can vary across instruments, timeframes, and market conditions.
Important Notes
RSI range analysis is not a standalone prediction of market direction. Do not assume that a particular RSI reading guarantees continuation or reversal. Use historical testing, independent confirmation, and appropriate risk controls when evaluating trading setups.
Keywords: Cardwell Range Analyze, Cardwell RSI, RSI range indicator, MT5 RSI indicator, MetaTrader 5 indicator, relative strength analysis, momentum trading indicator, forex technical analysis, XAUUSD RSI indicator.