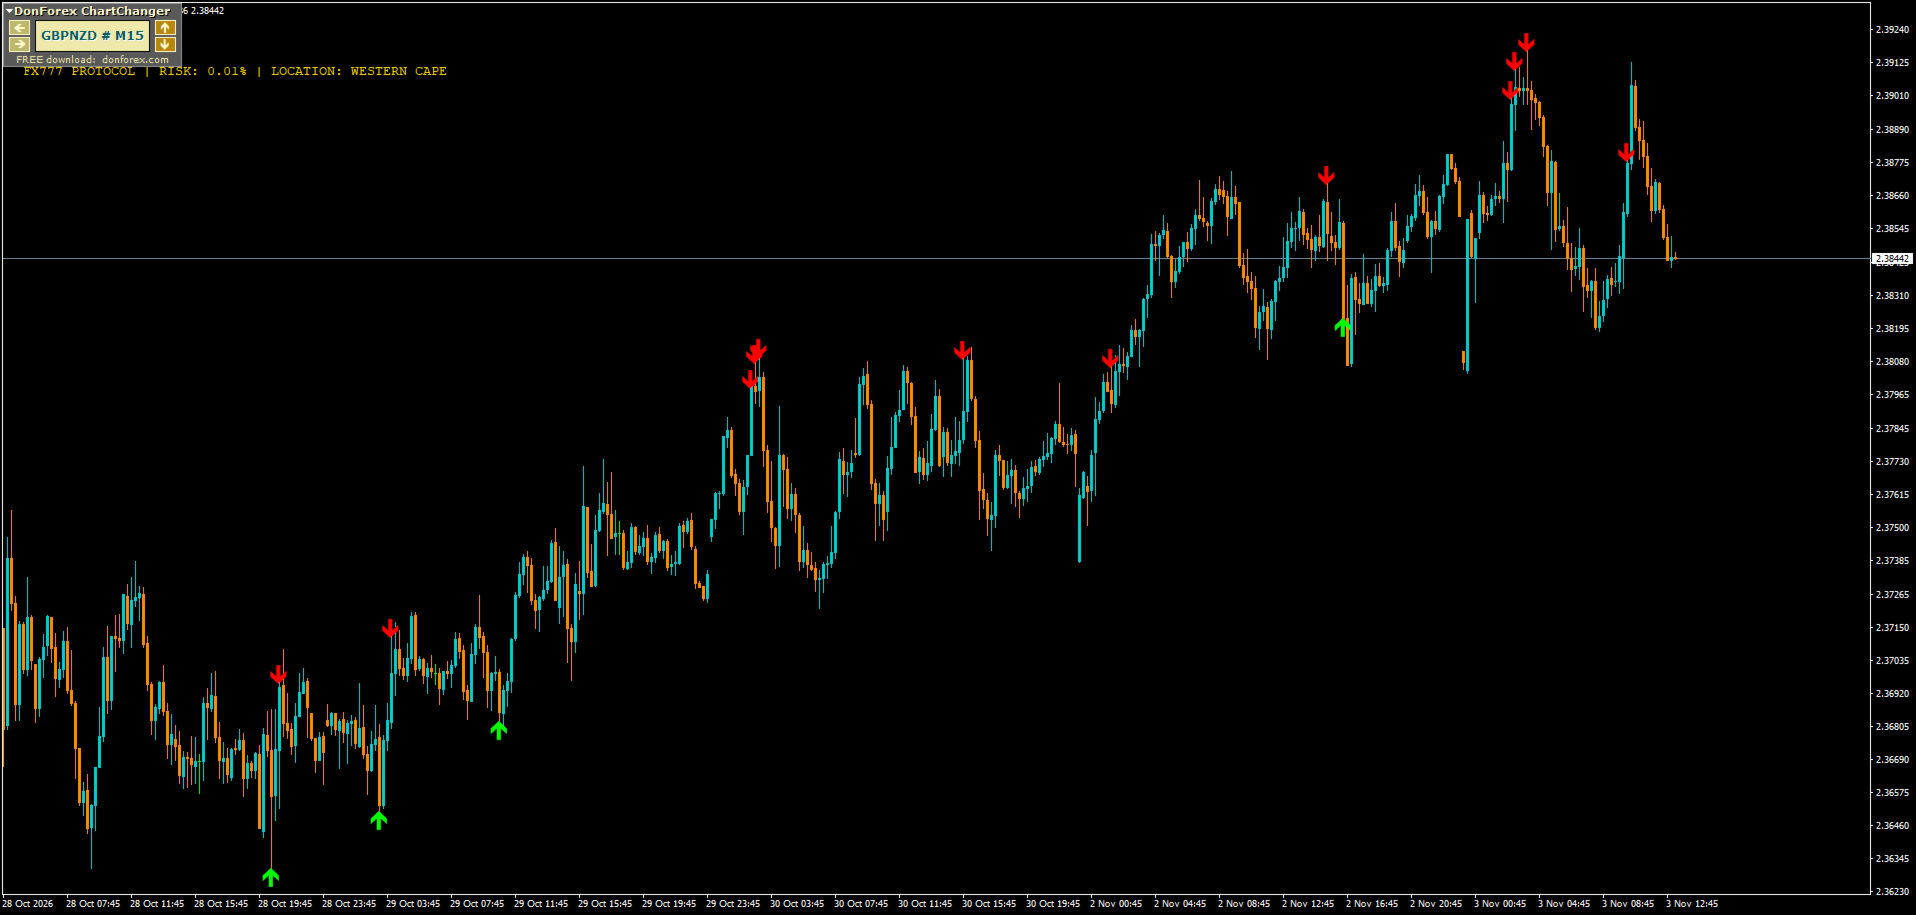
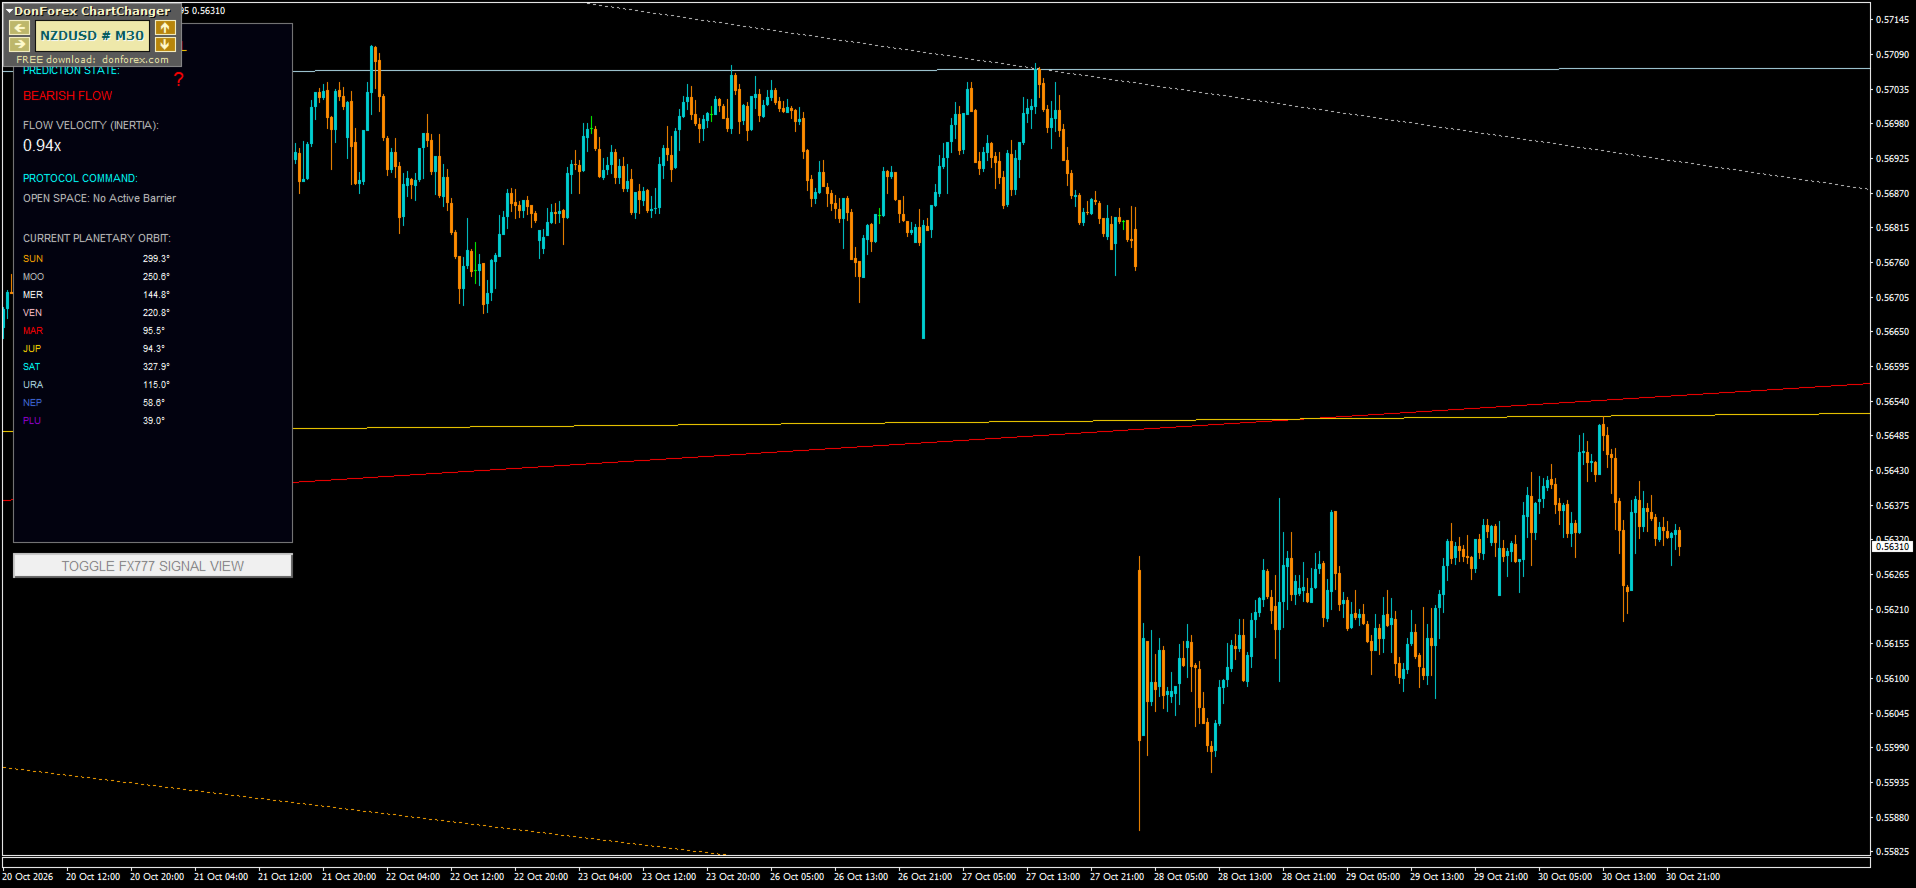
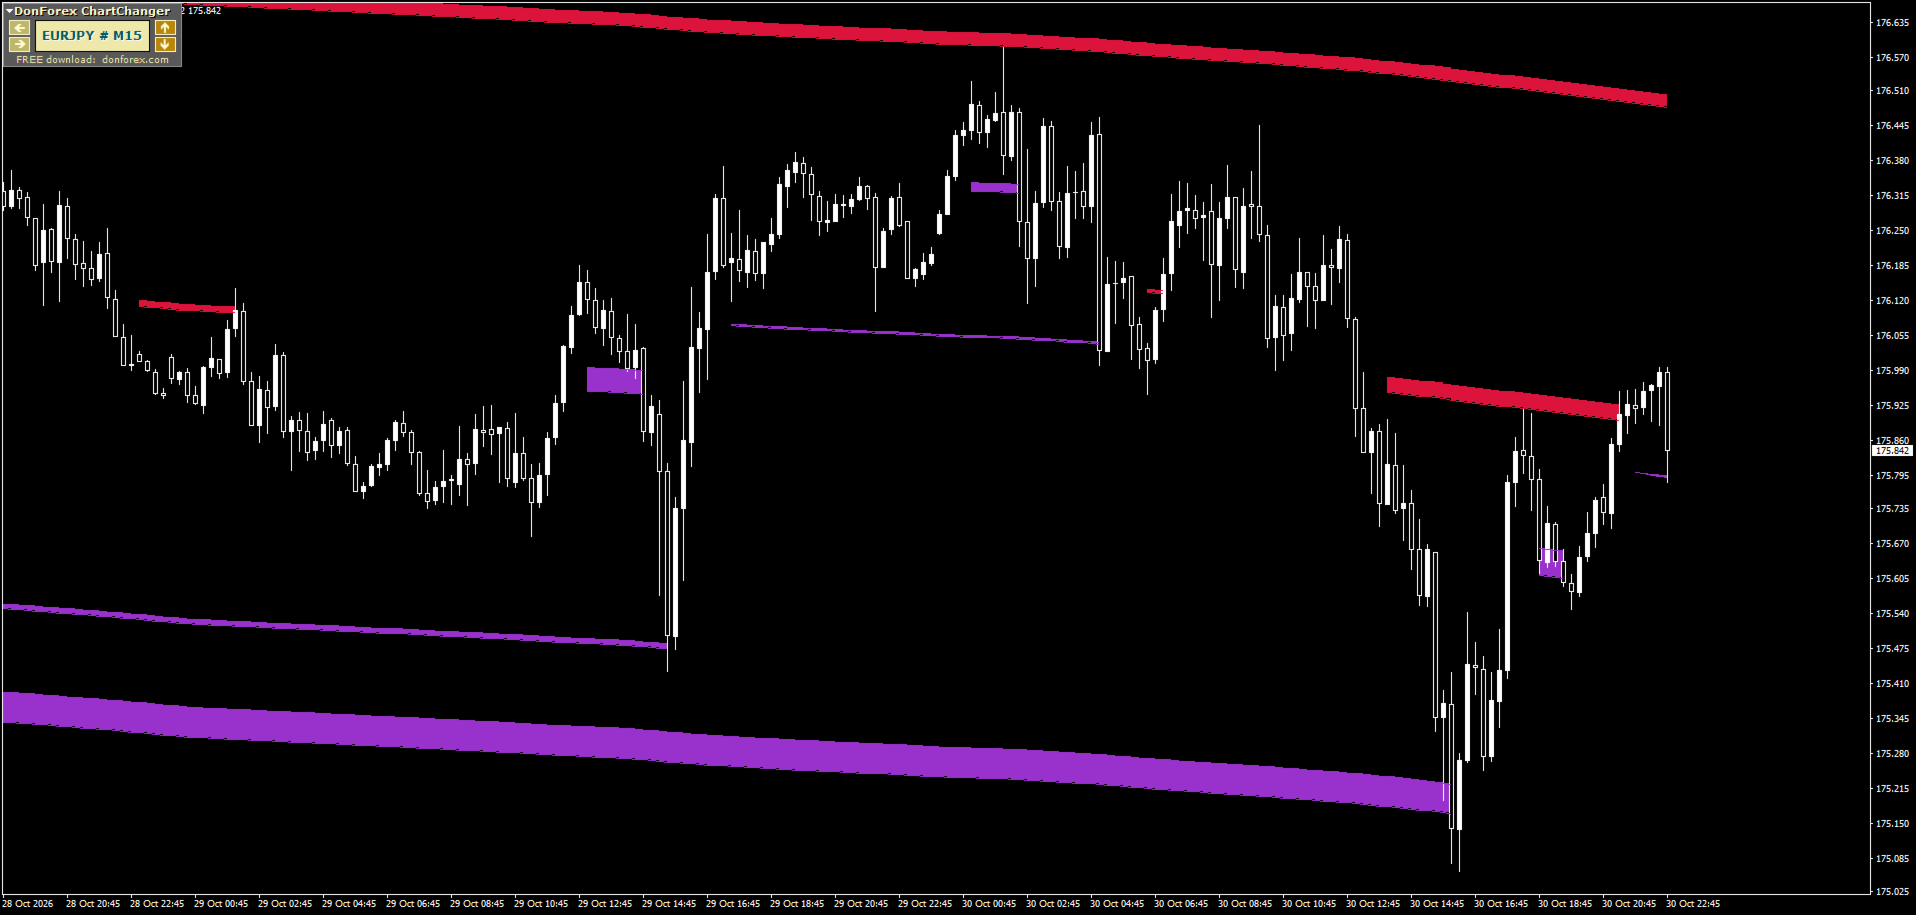
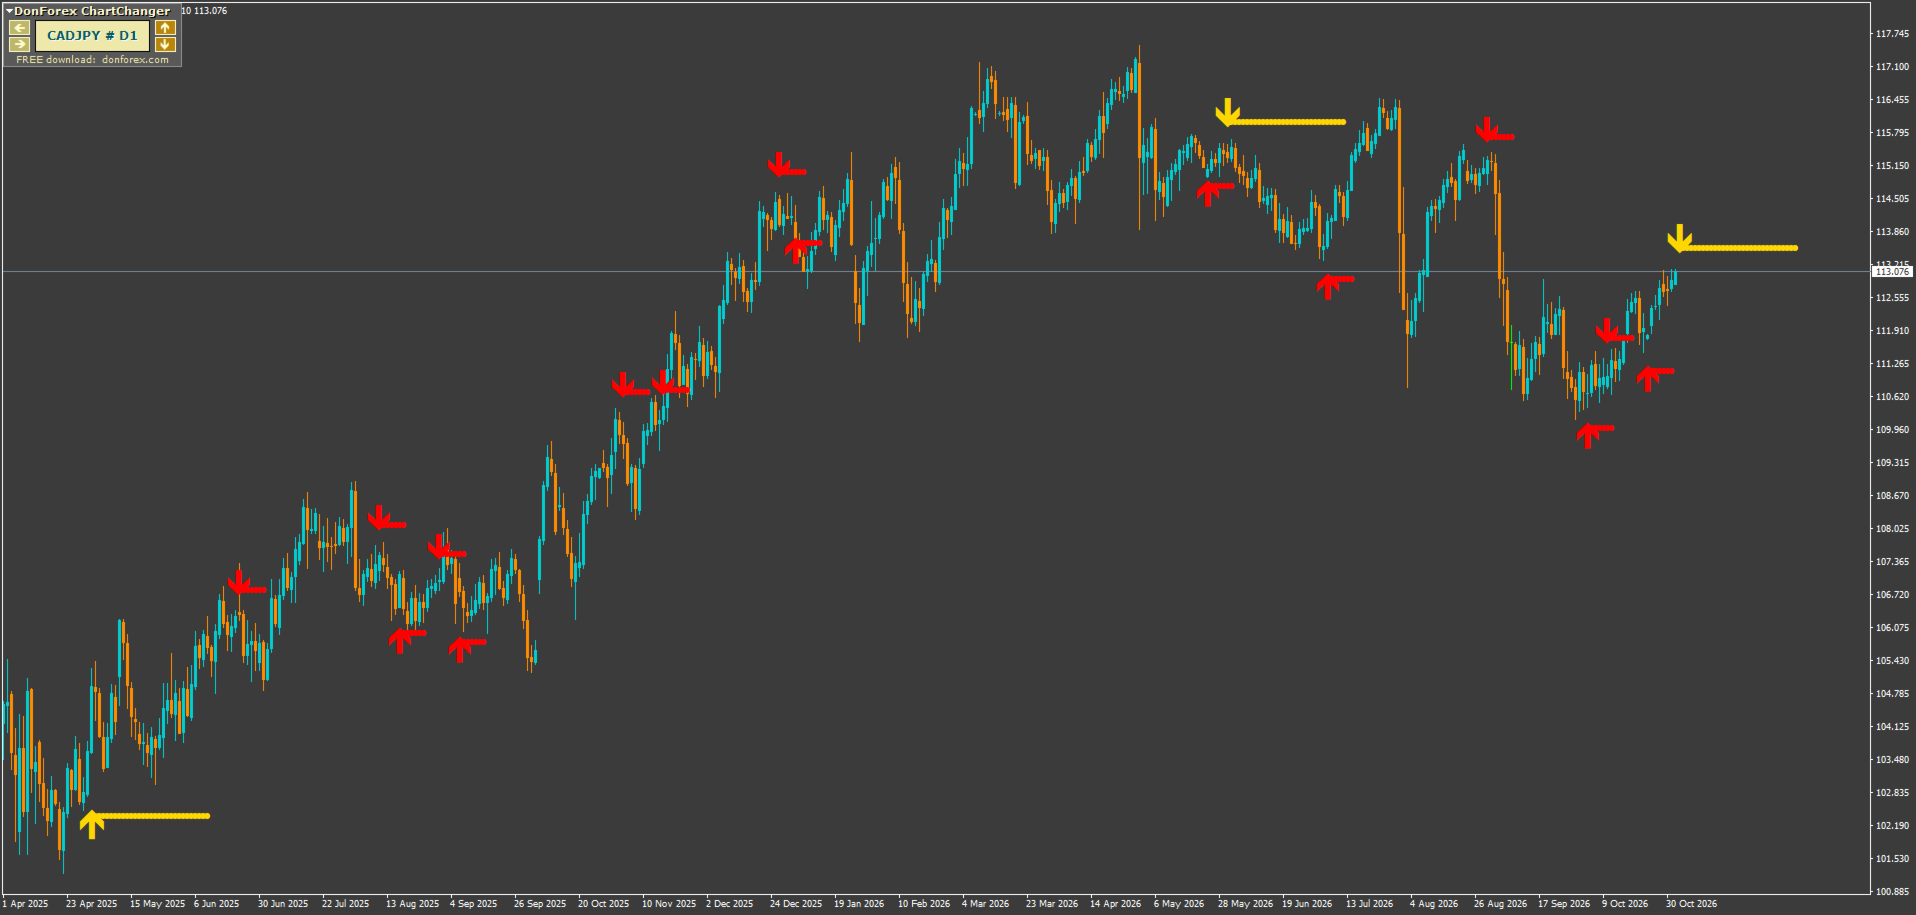
Smart Volatility Matrix

Welcome

Please note that I am currently uploading all my precious indicators. (It takes time with all the files, names, pics etc.) 

Feel free to ask questions.


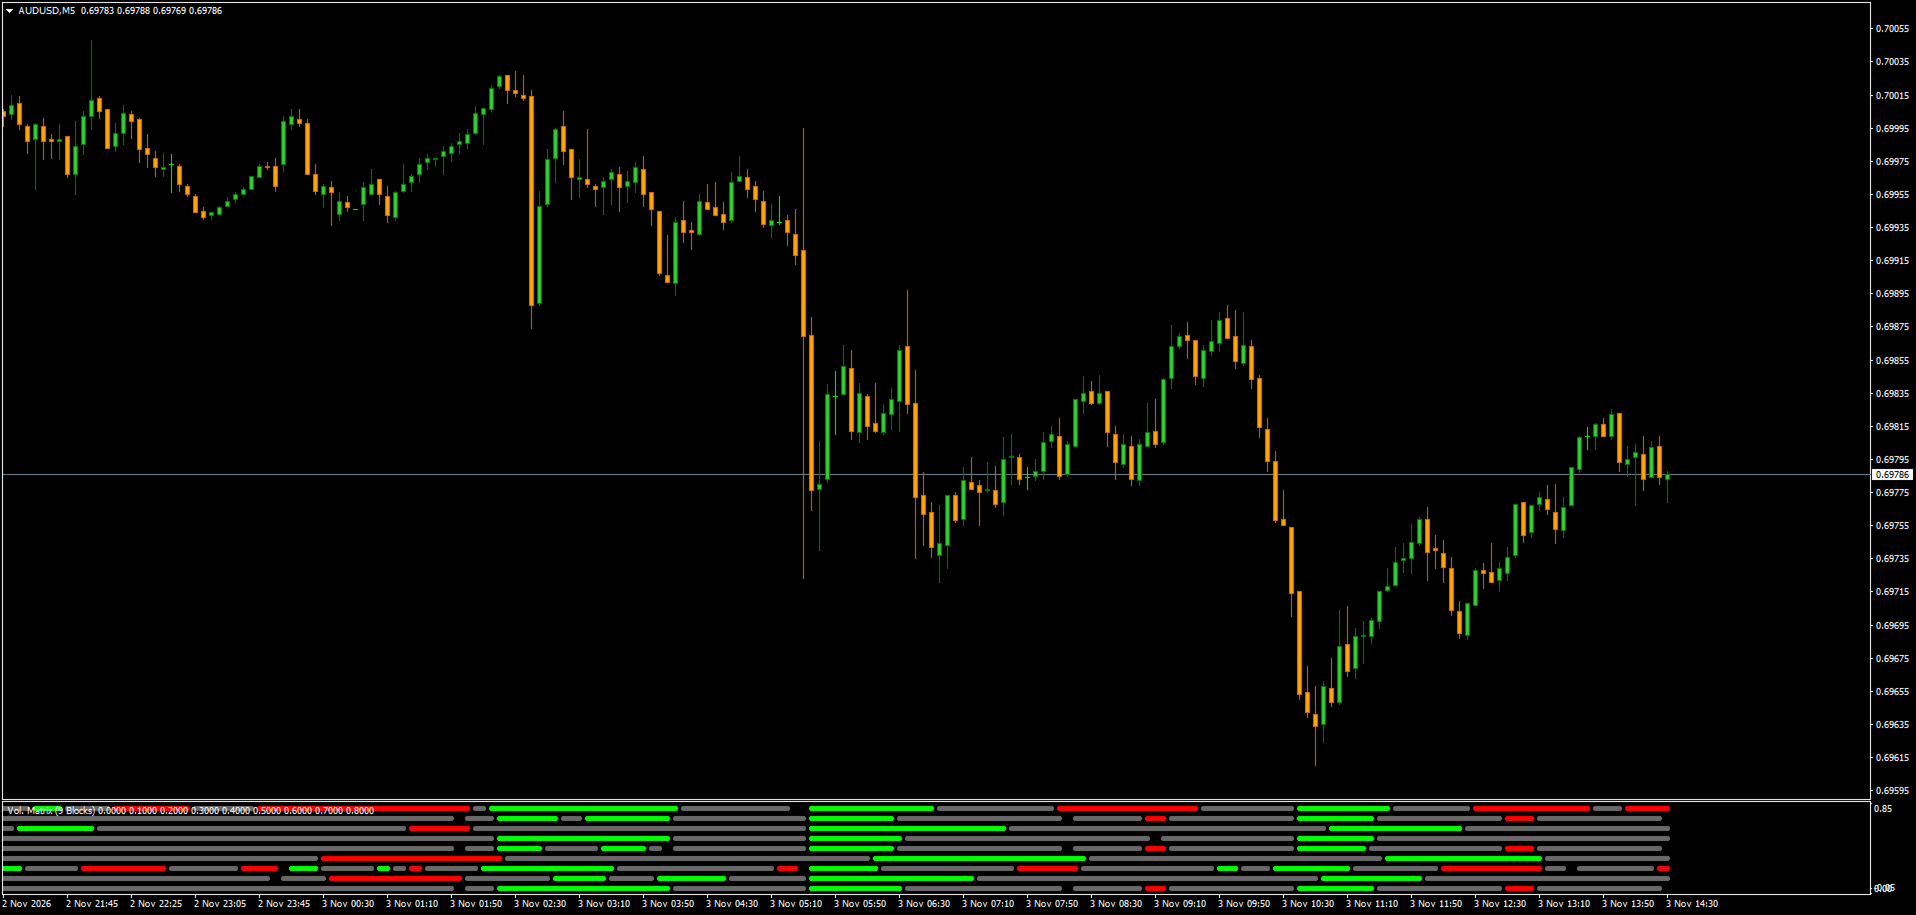
Smart Volatility Matrix is an advanced multi-preset technical indicator designed for MetaTrader 4, engineered to map out market volatility dynamics across 9 distinct parameter blocks simultaneously in a clean separate window.


Overview
Navigating changing market conditions requires more than a single moving average or standard band. The Smart Volatility Matrix processes multiple lookback configurations and standard deviation formulas in real-time, instantly transforming raw market compression and expansion into clear visual signals.

Key Features
- 9 Simultaneous Presets: Monitors multiple volatility lengths and deviation parameters under one roof.
- Visual Matrix Blocks: Displays conditions via intuitive color-coded rows (Buy, Sell, and Neutral states).
- Optimized Performance: Built-in safety limits (InpHistoryLimitBars) prevent terminal freezing during heavy historical chart loads.
- Fully Customizable: Easily adjust Bollinger Band periods, price types, lookback spans, and color themes directly from the input panel.

Inputs & Parameters
- InpBBShift: Bollinger Bands shift configuration.
- InpBBMode: Moving Average method (SMA, EMA, etc.).
- InpBBPrice: Applied price type (Close, Open, High, Low, etc.).
- InpHistoryLimitBars: Limits initial calculation load to ensure seamless platform startup.

Equip your charts with a multi-layered analytical edge and gauge market volatility with professional precision.
おすすめのプロダクト
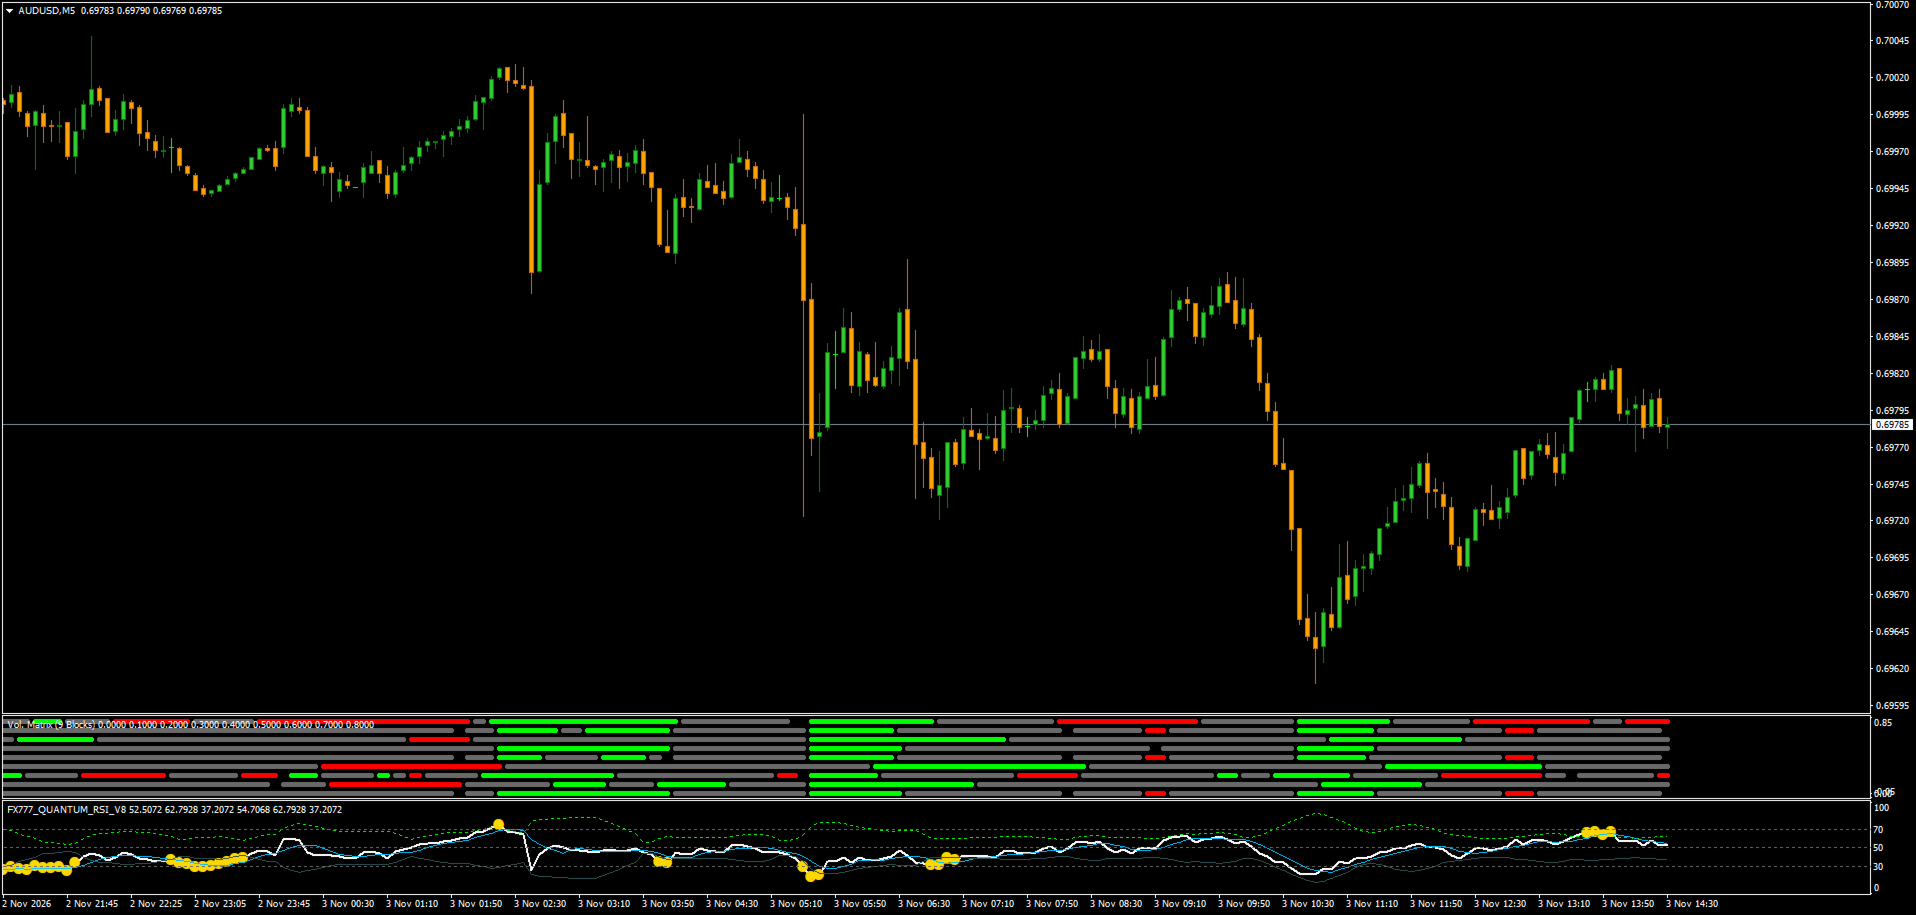
Welcome Please note that I am currently uploading all my precious indicators. (It takes time with all the files, names, pics etc.)  Feel free to ask questions. FX777 QUANTUM RSI: Sovereign Quantum Stability v8.0 Overview Step into the next tier of institutional-grade technical analysis with FX777 Quantum RSI (v8.0) . Moving far beyond traditional, lagging indicator models, this subwindow masterpiece integrates dynamic volatility-based gates with an advanced Persistence Engine , filtering out f
FREE
ローソク足チャートと取引開始時刻を表示するカウントダウンタイマーです。チャート上の小さなブロックで、現在の状況に関するあらゆる情報を確認できます。現在のローソク足が確定するまでの残り時間、他の時間足の状況、開いている取引セッション、そして現在のバーの状態などが表示されます。 パネルの表示内容 パネルの中央には、現在のローソク足の確定までのカウントダウンが表示されます。カウントダウンの下には、ローソク足の進行状況を示すインジケーターがあり、ローソク足が確定に近づくにつれて色が変わります。最初は静かに始まり、残り数分で警告バー、残り数秒でクリティカルバーが表示されます。また、様々な種類の通知を設定することもできます。 その下には、設定した他の時間足(デフォルトではM1、M5、M15、H1、H4、D1)のカウントダウンが表示されます。現在有効な期間がハイライト表示され、バーをクリックするとチャートの期間が切り替わります。以下に、シドニー、東京、ロンドン、ニューヨークの始値インジケーターと次のイベントまでのカウントダウンを表示するセッションタイマー、およびコンテキストローソク足パネルが表
FREE
The   Pivot Point indicator   automatically calculates and displays the pivot point line and support and resistance levels. Pivot can be calculated according to the Classic, Floor, Fibonacci, Woodie, Camarilla or DeMark formula. It is also possible to select the period for calculating the indicator. A trader can choose from daily, weekly, monthly, or user-defined periods. Types of pivots Classic Floor Fibonacci Woodie Camarilla DeMark Main features The indicator shows the current and historic
FREE
予想される日中レンジからストップロスとテイクプロフィットの水準を決め、選んだ残高%ちょうどのリスクになるロットを表示します。 このロットと自動ストップでワンクリックで取引するには Ballast Risk Panel を、プロップファームの口座では Ballast Prop Guard がすべてのストップを日次損失上限内に保ちます。 狭すぎるストップは通常のノイズで刈られ、広すぎるストップはロットを極小にします。Ballast Stop Sizer は今日の相場がどれだけ動くと予想されるかからストップを決めます。 予想日中レンジ — 直近 5 日と直近 20 取引日の平均レンジから(週末の足は無視)。今日すでにどれだけ使ったかも表示。 買いと売りのストップロス・目標ライン を予想レンジの選んだ割合(初期設定ストップ 0.35 倍、目標 0.50 倍)で現在価格の横に描画。 リスク%に対する ロットサイズ と、ストップで失う金額。 正直なチェック: 過去の日が予想内に収まった頻度を直近 250 日で測定。 今日のレンジが予想レンジに達したときの任意のアラート。 EA 開発者向けの3つのバ
FREE
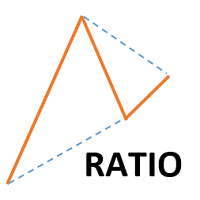
This indicator shows ratios between extremes on the chart. You can specify your own ratios (e.g. Fibonacci). Parameters Most important Density - how much in details to search ratios in extremes. Bigger number means less details, smaller number means more details. Base unit is 1 bar on the chart. History - how far to go in history while searching. When you set -1, the indicator processes all bars from history. Base unit is 1 bar on the chart. Range - how far search ratios from given extreme. Bas
FREE
Pin Bars
Yury Emeliyanov
4.83 (6)
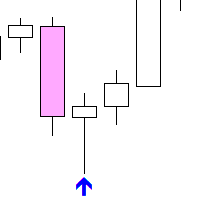
主な目的:"ピンバー"は、自動的に金融市場チャート上のピンバーを検出するように設計されています。 ピンバーは、特徴的なボディと長いテールを持つキャンドルであり、トレンドの反転または修正を知らせることができます。 それがどのように機能するか:インジケーターはチャート上の各キャンドルを分析し、キャンドルの体、尾、鼻のサイズを決定します。 事前定義されたパラメータに対応するピンバーが検出されると、インジケータはピンバーの方向(強気または弱気)に応じて、上矢印または下矢印でチャート上に パラメータ: TailToBodyRatio-テールの長さとピンバーのボディサイズの最小比率を定義します。 NoseToTailRatio-ピンバーの「ノーズ」とテールの間の最大許容比を設定します。 ArrowSize-マークされたピンバーとチャート上のピンバーを指す矢印との間の距離を定義します。 適用:"ピン棒"の表示器が潜在的な傾向の逆転ポイントを識別し、市場か近い位置を書き入れる信号を発生させるのに使用することができます。 正しく使用され、他のテクニカル指標や分析方法と組み合わせると、指標は取引結果
FREE
New Release! Hello Everyone! I've just released Acronix, a new bot with live 2025 AND 2026 results. Find more about it here:  https://www.mql5.com/en/market/product/201513 . Introduction and Description The indicator displays an arrow whenever a " Bearish Engulfing " is detected. The latter usually indicates the beginning of a downward trend. A bearish engulfing pattern is a technical chart pattern that signals lower prices to come. The pattern consists of an up candlestick followed by a large d
FREE
The Stock Exchange One Sessions Hours version 2.00 This indicator facilitates observing the currency pair's quotations during subsequent parts of the stock exchange session live. Before the session starts, a rectangle is drawn on the chart but not filled in with color. It means the extent of the session duration. Before the first bar enters the rectangle of the session, a sound signal or pop-up window will notify us that the session will just start. When the price graph crosses the edge of the
FREE
Gina Dual TPO — Brief MQL4 indicator TPO + Volume profile overlaid on chart — fast, scalable, and beginner-friendly. Built for traders who read market structure by POC and Value Area. What it is An MQL4 indicator that overlays dual market profiles—Time-at-Price (TPO) and Volume-at-Price (VPO)—directly on your chart. It’s fast (pixel-based drawing), scalable, and beginner-friendly. Who it’s for Intraday and swing traders who read market structure via POC (Point of Control) and Value Area to spot
FREE
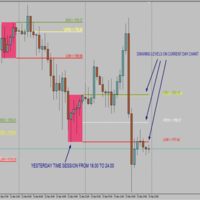
Time Session OPEN-HIGH-LOW-CLOSE This Indicator Will Draw Lines Of OHLC Levels Of Time Session Defined By User. It Will Plot Floating Lines On Current Day Chart. Time Session Can Of Current Day Or Previous Day. You Can Plot Multiple Session Lines By Giving Unique ID To Each Session. It Can Even Show Historical Levels Of Time Session Selected By User On Chart To Do Backdating Test. You Can Write Text To Describe The Lines.
FREE
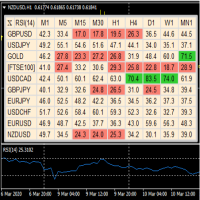
A useful dashboard that shows the RSI values for multiple symbols and Time-frames. It can be easily hidden/displayed with a simple click on the X top left of the dashboard. You can input upper and lower RSI values and the colours can be set to show when above/below these values. The default values are 70 and 30. Symbols and time-frames are input separated by commas.  Symbols can also be loaded from the Market Watch window. If there are more than 30 symbols, only the first 30 will be loaded. You
FREE
RSI indicator with signal lines, at the intersection of which a corresponding notification will be issued, which can be in the form of a normal alert, or in the form of a user sound file. The indicator also has the function of sending push-notifications and email notifications at the intersection of these levels. The values ​​of the levels can be set independently in the indicator settings, and, if desired, they can be changed and configured directly in the indicator window. This product is a
FREE
SRFactor
Aleksandr Teleguz
5 (2)
This indicator identifies short-term, medium-term and long-term highs and lows of the market according to the method described by Larry Williams in the book "Long-term secrets to short-term trading". Brief description of the principle of identifying the market highs and lows A short-term high is a high of a bar with lower highs on either side of it, and, conversely, a short-term low of a bar is a low with higher lows on either side of it. Medium-term highs and lows are determined similarly: a
FREE
Prior Day Week Month Levels with Touch Alerts MT4 は、前日・前週・前月の高値と安値を MetaTrader 4 のチャートに表示します。描き方は TradingView でおなじみの形です。細い水平線と、右端に短いラベルと価格。追加で、前日の終値と今日の始値、価格が線に触れたときのアラートも使えます。 表示されるもの 線 | 意味 | 初期の見た目 PDH | 前日の高値 | 青 #2962FF、実線 PDL | 前日の安値 | 青 #2962FF、実線 PWH | 前週の高値 | オレンジ #FF9800、破線 PWL | 前週の安値 | オレンジ #FF9800、破線 PMH | 前月の高値 | 紫 #9C27B0、一点鎖線 PML | 前月の安値 | 紫 #9C27B0、一点鎖線 PDC | 前日の終値 | グレー、点線(オフ) DO | 今日の始値 | シアン、点線(オフ) 今の期間の線は、その期間の始まりから最新の足+15本まで引きます(Extend、0〜500)。「Periods to draw」を 2 以上(最大 5
FREE
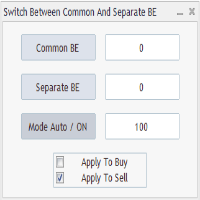
Advanced Auto BE. Program for switching between common and separate breakeven stop loss. Levels can be modified with user-defined point values The program also offers auto mode, where common/separate BE levels are switching depending on whether all positions are profitable.  Calculation includes open prices . It can be used for BUY/SELL positions separately or together. HOWEVER I HAVE NEVER TESTED SITUATION, WHERE I HAD BOTH SELL AND BUY POSITIONS PROFITABLE ( I Mean AUTOMODE pyramyds) . Rememb
FREE
異なる通貨ペアの動きは相互に関連しています。ビジュアル相関インジケーターを使用すると、同じスケールを維持しながら、複数の通貨ペアを1つのチャート上に表示できます。 相関関係が正、負、または無相関であるかを判断できます。 一部の通貨ペアは他の通貨ペアよりも早く動き始めます。これらのタイミングは、チャートを重ね合わせることで特定できます。 このインジケーターは、1つのチャート上に最大5つのシンボルを表示できます。各シンボルは、それぞれ異なる時間枠で表示できます。 また、このインジケーターは、2つの個別シンボルの価格を組み合わせた合成シンボルの表示にも対応しています。 このようなチャートを作成するために、以下の演算が利用可能です。 除算「/」 乗算「*」 加算「+」 減算「-」 例えば、最初のシンボルとして金XAUUSD、2番目のシンボルとしてブレント原油を選択すると、チャートにはブレント原油バレル建ての金1オンスの価格が表示されます。 この方法は、従来とは異なる通貨ペアの評価に役立ちます。 シンボルを追加するには、「+ シンボルを追加」をクリックしてください。表示されたウィ
FREE
Are you tired of drawing trendlines every time you're analyzing charts? Or perhaps you would like more consistency in your technical analysis. Then this is for you. This indicator will draw trend lines automatically when dropped on a chart. How it works Works similar to standard deviation channel found on mt4 and mt5. It has 2 parameters: 1. Starting Bar 2. Number of bars for calculation The   starting bar   is the bar which drawing of the trend lines will begin, while the   number of bars for c
FREE
The Scaled Awesome Oscillator (SAO) represents a refined adaptation of the Awesome Oscillator, aimed at establishing consistent benchmarks for identifying market edges. Unlike the standard Awesome Oscillator, which records the variation in pips across different commodities, the only unchanging reference point is the zero line. This limitation hampers investors and traders from pinpointing specific levels for trend reversals or continuations using the traditional Awesome Indicator, a creation of
FREE
The indicator displays signals according to the strategy of Bill Williams on the chart. Demo version of the indicator has the same features as the paid, except that it can work only on a demo account . Signal "First Wise Man" is formed when there is a divergent bar with angulation.  Bullish divergent bar - with lower minimum and closing price in the upper half. Bearish divergent bar - higher maximum and the closing price at the bottom half. Angulation is formed when all three lines of Alligator
FREE
キーと通知を使用した描画 この商品は、取引の専門家であるトレーダーにとって興味深いものです。より正確には、取引アルゴリズムでクリーンなチャートを使用します(インディケーターのない、またはインディケーターの数が最小のチャート)。 ホットキーを使用すると、アクティブなグラフ上にさまざまな描画スタイルとさまざまな色のグラフィックオブジェクトを作成できます。グラフィックの書式スタイルを変更できます。 デフォルトの描画スタイルを選択するか、アドバイザプロパティ選択ウィンドウで設定できます。グラフに移動すると、グラフィックオブジェクトを作成するときに、色、線種、線の太さが自動的に選択されます。グラフィカルオブジェクトの描画スタイルは、描画が実行される現在の時間枠によって異なります。 基本的な機能を紹介するビデオをご覧ください。 キーボードショートカット キー0-すべてのオブジェクトからフォーカスを削除します キー1-「水平線」オブジェクトを作成します キー2-「Rectangle」オブジェクトを作成します キー3-「トレンドライン」オブジェクトを作成します キー\-グラフからすべての種類のオブジ
FREE
This application is now replaced by Ofir Notify Light Edition (Free) or Ofir Notify (paid). Thank all for your positive feedbacks. Ofir Notify is a tool which send alerts on trades to Telegram Alert on any event concerning a position : Opening, Closing, modification (SL, TP) Send alerts to Chats, Groups and Channel Alert on Equity change Display Risk, Reward and progress of profit/lost for each position Customization of alerts ( only in full edition ) Sending charts screenshots with alerts   
FREE
Shadow Height mt4   シャドウインジケーター。 ローソク足の影のサイズをヒストグラムとしてポイント単位で表示します。ユーザーが選択可能な3つのモードで動作します。 インジケーター設定の説明 モード-インジケーター操作モード、3つのモード:最初の高さ-上下のローソク足シャドウの表示モード。 2番目の違い-ローソク足の影の違い、上下のローソク足の影の違いを表示するモード。 3番目の優位性は、1取引日のローソク足シャドウの累積差であり、モードは4時間より長い期間は機能しません。 Shadow Height mt4   シャドウインジケーター。 ローソク足の影のサイズをヒストグラムとしてポイント単位で表示します。ユーザーが選択可能な3つのモードで動作します。 インジケーター設定の説明 モード-インジケーター操作モード、3つのモード:最初の高さ-上下のローソク足シャドウの表示モード。 2番目の違い-ローソク足の影の違い、上下のローソク足の影の違いを表示するモード。 3番目の優位性は、1取引日のローソク足シャドウの累積差であり、モードは4時間より長い期間は機能しません。
FREE
LT Clock MT4
Thiago Duarte
4.9 (10)
Simple indicator that draws the market hours on chart (broker, local and GMT). Functions: Horizontal distance -  from border. Vertical distance -  from border. Color -  text color. Font -  text font. Size -  text size. Corner -  which chart corner will be drawn. Show seconds -  show or hide seconds. Draw as background -  candles front or back. Label local -  text before local time. Label broker -  text before broker time. Label GMT -  text before GMT time. Object ID -  identification from object
FREE
Automated Timeframe cycling with Symbols centered.  Force every timeframe onto one clock window, so the story you see on Daily is the same story you are slicing on H4, H1, and M1.  Traders usually flip timeframes and lose the span. A Daily chart shows a few weeks, then M15 shows a few hours, and the eye treats them as different markets. This indicator locks the window to N bars of the highest enabled timeframe — default 10 Daily — and maps every lower timeframe to that same stretch. You stay ins
FREE
WAD Stoch
Yonny Pascal Ekwa Mezui
WAD Divergence + Stochastic Overview WAD Divergence + Stochastic is a technical indicator designed to assist traders in identifying potential market turning points. It combines price behavior with momentum confirmation to highlight areas where buying or selling pressure may be shifting. The indicator works directly on the chart and provides clear visual signals to support decision-making in fast-moving markets. How It Works The indicator analyzes the relationship between price movement and inte
FREE
A very fast way to save your chart template. Set the keyboard shortcut to further speed up the operation. The script allows you to save a template with a specific prefix, with the current date or with the chart timeframe. The symbol is saved automatically. Script parameters: Prefix - prefix for the template name. Can be empty. With date - true = template name will containt current date With timeframe - true = template name will containt timeframe of the current chart
FREE
The indicator represents the session boxes for the Asian, European and American sessions. It is possible to change the time of each session, such as color. It is also possible to disable the display of each session. You will find in input parameters variables to modify time sessions  in format hh:mm and  the color of boxes of each sessions. If you need some implementations please contact me.
FREE
Market Ticker Free
John Louis Fernando Diamante
5 (1)
A scrolling Market Ticker that displays price changes from all symbols in the Market Watch list. Provides an easy snapshot of symbol prices, and keeps scrolling automatically while you trade and analyse the chart. Options include: - MTF, eg choose to show price changes of the daily chart, or the hourly - use the live candle or the recently completed - font and background coloring
FREE
The London Stock Exchange Session's Hours This indicator facilitates observing the currency pair's quotations during subsequent parts of the stock exchange session live. Before the session starts, a rectangle is drawn on the chart but not filled in with color. It means the extent of the session duration. Before the first bar enters the rectangle of the session, a sound signal or pop-up window will notify us that the session will just start. When the price graph crosses the edge of the session
FREE
The ZUP is based on two ideas. Idea 1 - combine a variety of methods for identifying extremums (minimums and maximums) on the market price charts in a single indicator. Idea 2 - make it possible to easily bind various graphical tools, which allow to analyze the market behavior, to the identified extremums. To implement the first idea , the following has been made in the indicator. Included multiple ZigZag algorithms. Standard ZIGZAG algorithm. The basis of this algorithm is taken from the ZigZag
FREE
このプロダクトを購入した人は以下も購入しています
通貨強さウィザードは、取引を成功させるためのオールインワン ソリューションを提供する非常に強力な指標です。このインジケーターは、複数の時間枠のすべての通貨のデータを使用して、このまたはその外国為替ペアのパワーを計算します。このデータは、使いやすい通貨インデックスと通貨パワーラインの形式で表され、特定の通貨のパワーを確認するために使用できます。 必要なのは、取引したいチャートにインジケーターを接続することだけです。インジケーターは、取引する通貨の実際の強さを示します。このインジケーターは、トレンドに合わせて取引するときに有利に利用できる売買高の圧力の極値も示します。このインジケーターには、フィボナッチに基づく可能なターゲットも表示されます。 このインジケーターは、PUSH 通知を含むあらゆるタイプのアラートを提供します。 購入後ご連絡下さい。私の取引のヒントをあなたと共有し、素晴らしいボーナスインジケーターを無料で提供します! 幸せで有益な取引をお祈りします。
Trend SniperX MT4
Sarvarbek Abduvoxobov
5 (6)
Trend Sniper X は、トレーダーがトレンドの方向性と潜在的な反転ポイントを明確かつ正確に特定できるように設計された、MetaTrader 5 用のマルチタイムフレーム・トレンドフォロー指標です。 MT5版はこちら: https://www.mql5.com/en/market/product/181101 価格情報: 現在の価格はプロモーション価格であり、今後のアップデートや新機能の追加に伴い変更される場合があります。 Code2Profit チャンネル マルチタイムフレーム分析で市場をマスターしよう! Trend Sniper Xで勝率を最大化する方法:ルールとセッションのコツ 技術仕様 プラットフォーム MetaTrader 5 インジケータータイプ マルチタイムフレーム・トレンドインジケーター 動作タイムフレーム すべてのチャート時間足(上位足M1~MN1を独立して選択可能) 主要対象銘柄 為替(Forex)、ゴールド(XAUUSD)、その他のCFD 推奨口座 すべての口座タイプ ビジュアル表示 トレンドカラーローソク足(買い/売り/弱い/変化)+ 買い/売りシグナル
M1 Sniper
Oleg Rodin
4.97 (30)
M1 SNIPER は使いやすいトレーディングインジケーターシステムです。M1時間足向けに設計された矢印インジケーターです。M1時間足でのスキャルピングのためのスタンドアロンシステムとして、また既存のトレーディングシステムの一部としても使用できます。このトレーディングシステムはM1時間足での取引に特化して設計されていますが、他の時間足でも使用できます。元々、この手法はXAUUSDとBTCUSDの取引用に設計しましたが、他の市場においても役立つと考えています。 インジケーターのシグナルは、トレンドの方向と逆方向に取引できます。インジケーターのシグナルを利用して両方向に取引するのに役立つ特別な取引テクニックをご紹介します。この手法は、特別な動的なサポートとレジスタンスの価格帯を利用することに基づいています。 ご購入後、M1 SNIPER矢印インジケーターをすぐにダウンロードできます。さらに、M1 SNIPERツールのすべてのユーザーに、以下のスクリーンショットに表示されているApollo Dynamic SRインジケーターを無料で提供しています。この2つのインジケーターを組み合わせることで
Smart Trend Trading System は、トレンド情報、エントリー・決済シグナル、価格水準をひとつのチャートにまとめて表示する MetaTrader 4 用インジケーターです。 このシステムは、トレンド検出、反転ゾーン、Smart Cloud、トレーリングストップロジック、サポートとレジスタンス、ローソク足の色分け、アラート、マルチタイムフレーム分析など、 10 種類以上のトレーディングツール を 1 つに統合しています。 このシステムは、さまざまな市場環境での取引をサポートするように設計されています。 トレンド相場: 主要トレンドを特定し、押し目を検出し、モメンタムに従い、ストップロスガイドとトレーリングストップオプションを使って、より明確なエントリーを見つけます。 レンジ相場: レンジ状態を検出し、反応ゾーンを特定し、価格が重要なレベルから反応したときに、より明確なシグナルを受け取ります。 スキャルピングとデイトレード: 短期売買の判断をサポートするために、高速シグナル、ローソク足の色、アラート、マルチタイムフレーム確認を使用します。 主な機能: • 10 種
SIO Oscillator:自己最適化型セミバリアンス・インバランス・オシレーター インジケーターをご購入いただくと、それをベースにしたエキスパートアドバイザー(EA)を無料でお受け取りいただけます。 多くのオシレーターは、すべての価格変動を同じように扱います。SIOは上昇圧力と下降圧力を分けて捉え、その間のインバランス(不均衡)を測定することで、買い手と売り手のどちらが本当に相場を支配しているかを示します。インバランスが極値に達すると、SIOはエントリー、ストップロス(Stop Loss)、テイクプロフィット(Take Profit)の水準を伴う明確なシグナルを表示します。 SIOの大きな特長は、固定パラメーターに頼らないことです。内蔵の自己最適化機能が、現在の銘柄と時間足に適したパラメーターを継続的に探索し、使用する前に検証します。 2つのシグナルモード 平均回帰(Mean Reversion):インバランスの極値で取引し、均衡への回帰を狙います。 トレンドフォロー(Trend Following):持続的で優勢なインバランスの方向に取引します。 自動モード:最適化機能が直近のデ
Liquidity Scalper System: インジケーター形式の流動性ベースのトレーディングシステムです。 多くのインジケーターは矢印を表示するだけで、ストップをどこに置くか、目標はどこか、そのシグナルを信頼してよいかはトレーダー自身が判断しなければなりません。Liquidity Scalper System はトレードの全サイクルをカバーします。流動性プールを見つけ、そのブレイク時にシグナルを出し、Entry、Stop Loss、3つのターゲットを即座に計算し、パネルに統計と新しいデータでの検証結果を表示します。設定はシステムが自動で選び、毎日更新します。 仕組み 1. システムが流動性プールを見つけます。市場参加者のストップ注文が集まっている価格水準です。 2. 価格がプールをブレイクし、そのブレイクが値動きの強さ(必要に応じて出来高)で確認されると、チャートに BUY または SELL の矢印が表示されます。 3. Entry、Stop Loss、TP1、TP2、TP3 の水準がゾーンの塗りつぶしとともに即座に描画されます。 4. 右側に流動性プロファイルが表示され、価
Gann Made Easy は、ミスター・ギャンの理論を使用した取引の最良の原則に基づいた、プロフェッショナルで使いやすい外国為替取引システムです。 W・D・ガン。このインジケーターは、ストップロスとテイクプロフィットレベルを含む正確な買いと売りのシグナルを提供します。 PUSH通知を利用して外出先でも取引可能です。 ご購入後、取引方法の説明と優れた追加インジケーターを無料で入手するには、私にご連絡ください! おそらく、ギャンの取引手法についてはすでに何度も聞いたことがあるでしょう。通常、ギャンの理論は初心者のトレーダーだけでなく、すでにある程度の取引経験がある人にとっても非常に複雑なものです。なぜなら、ギャンの取引手法は理論的にはそれほど簡単に適用できるものではないからです。私はその知識を磨き、最良の原則を私の外国為替インジケーターに組み込むために数年を費やしました。 このインジケーターは非常に簡単に適用できます。必要なのは、それをチャートに添付し、簡単な取引推奨事項に従うだけです。このインジケーターは常に市場分析の仕事を行い、取引の機会を探します。適切なエントリーポイントを検出す
Advanced Supply Demand
Bernhard Schweigert
4.91 (302)
現在30%オフ 初心者にもエキスパートトレーダーにも最適なソリューション このインジケーターは独自の機能と新しい公式を多数内蔵しており、ユニークで高品質かつ手頃な取引ツールです。このアップデートでは、2つの時間枠ゾーンを表示できるようになります。より長いTFだけでなく、チャートTFとより長いTF(ネストゾーンを表示)の両方を表示できます。すべてのSupply Demandトレーダーの皆さんのお気に召すはずです。:) 重要情報の公開 Advanced Supply Demandの可能性を最大化するには、 https://www.mql5.com/ja/blogs/post/720245 にアクセスしてください。   エントリーまたはターゲットの正確なトリガーポイントを正確に特定できれば取引がどのように改善されるか想像してみてください。新しい基盤となるアルゴリズムに基づいて構築されているため、買い手と売り手の間の潜在的な不均衡をさらに簡単に特定できます。これは、最も強い需要と供給のゾーンと、過去のパフォーマンス(古いゾーンを表示)がグラフィカルに表現されるためです。これらの機能は、最適な
このインジケーターは実践的なトレードに最適な自動波動分析のインジケーターです! 場合... 注:   Tang Lun (Tang Zhong Shuo Zen) の命名規則の影響で、私は波のグレーディングに西洋の名前を使用することに慣れていません。基本的な波を ペン 、二次波のバンドを セグメント と名付けました。同時に、 セグメント にはトレンドの方向が指定されます (この命名方法は将来のノートで使用されます。最初に言っておきます)。ただし、アルゴリズムは曲がりくねった理論とはほとんど関係がないため、付けるべきではありません。これは、私の市場分析 によって要約された、絶えず変化する複雑な運用ルール を反映しています。 バンドは標準化され、人によって異なることがないよう定義されており、市場参入を厳密に分析する上で重要な役割を果たす人為的な干渉の描画方法が排除されています。 このインジケーターを使用することは、取引インターフェイスの美しさを改善することと同等であり、元の K ライン取引を放棄し、取引の新しいレベルに連れて行きます。また、宣伝の観点から顧客の認識も向上します。 イ
現在30%OFF! 初心者やエキスパートトレーダーのためのベストソリューション! このダッシュボードソフトウェアは、28の通貨ペアで動作しています。それは私達の主要な指標(高度な通貨の強さ28と高度な通貨インパルス)の2に基づいています。それは全体の外国為替市場の大きい概観を与えます。それは、すべての(9)時間枠で28の外国為替ペアのための高度な通貨の強さの値、通貨の動きの速度と信号を示しています。チャート上で1つのインディケータを使用して市場全体を観察し、トレンドやスキャルピングの機会をピンポイントで見つけることができたら、あなたのトレードがどのように改善されるか想像してみてください。 このインディケータには、強い通貨と弱い通貨の識別、潜在的な取引の識別と確認がより簡単になるような機能が搭載されています。このインディケータは、通貨の強さや弱さが増加しているか減少しているか、また、すべての時間枠でどのように機能しているかをグラフィカルに表示します。 新機能として、現在の市場環境の変化に適応するダイナミックなマーケットフィボナッチレベルが追加され、すでに当社のAdvanced
This is a professional chart indicator designed for traders focused on stability and clear price action. It helps filter market noise and provides clear visual entry and exit zones for your trading decisions. Price Information: The current price is promotional and is subject to change as upcoming updates and new features are released. MQL5 public channel:  CLICK HERE for MT5:  Non-repainting MT5 version Core Features: Strictly Non-Repainting: The system is built with strict non-repaint logic. W
「Scalper Vault」は、デイトレードで安定した成果を目指すトレーダーのために設計された、強力かつ充実した機能を備えたトレーディングシステムです。 この高精度なインジケーターは、それ単体で完結するトレーディングシステムとして機能し、FXやバイナリーオプションのトレーダーに、機関投資家レベルの分析を提供します。 ご購入後、ぜひご連絡ください。 トレードのヒントに加え、豪華なボーナスをプレゼントいたします! 「Scalper Vault」を活用すれば、勘に頼った判断や複雑な手動分析は不要です。使いやすいトレード手法に集中し、純粋に「エントリー・決済」という実行フェーズに専念できます。 高精度なトレンドフォロー・シグナル:中核となるアルゴリズムが市場構造を分析し、主要なトレンド方向に沿った高確率なシグナルを提示します。これにより、誤ったエントリーを大幅に削減できます。 精度の高い天井・底の検知:市場の勢いが尽きたポイントをスキャンし、反転の可能性が高いゾーンを特定します。 ギャン(Gann)理論に基づく売買ゾーン:数学的な「ギャン・レベル」を自動的にチャート上に描画します。機関投資家
ON Trade Waves Patterns Harmonic Elliot Wolfeをご紹介します。これは手動および自動の方法を使用して市場のさまざまなパターンを検出するために設計された高度なインジケーターです。以下はその動作方法です: ハーモニックパターン: このインジケーターは、チャートに表示されるハーモニックパターンを識別できます。これらのパターンは、Scott Carneyの「Harmonic Trading vol 1および2」で説明されているように、ハーモニックトレーディング理論を実践するトレーダーにとって重要です。手動で描画するか、自動検出に頼るかにかかわらず、ON Trade Waves Patternsがお手伝いします。 コントロールパネル: このインジケーターはユーザーフレンドリーなコントロールパネルを備えています。チャートと時間枠の設定を保存し、異なる構成間をスムーズに切り替えることができます。チャートスペースを最大限に活用するために最小化することもできます。他の分析ツールで作業することを好む場合、閉じるボタンをクリックするだけで、すべてのインジケーターデ
このインジケーターは、反転ポイントと価格戻りゾーンを正確に表示します。     主要プレーヤー 。新たなトレンドが形成される場所を把握し、最大限の精度で意思決定を行い、すべての取引をコントロールします。 TREND LINES PRO インジケーターと組み合わせることで、その潜在能力を最大限に発揮します。 VERSION MT5 インジケーターが示す内容: 新しいトレンドの始まりに活性化する反転構造と反転レベル。 リスクと報酬の比率を最小限に抑えた利益 確定 と 損失停止の レベルの表示     RR 1:2   。 インテリジェントな削減ロジックによるストップロス。 指定されたインジケーターから 2 つのトレンド タイプの反転パターンを表示します。 指標: トレンドを追う   TREND LINES PRO   (世界的なトレンドの変化) TREND PRO   (クイックトレンド変更) シンプルで効果的   スキャナー   リアルタイムトレンド(新機能)。 マルチタイムフレームのインストゥルメント フィルタリング。 画面   利益     LOGIC AI信号の後。 当日プラス方
割引は 24 時間後に終了します — 次の価格は$ 69 ZORYK — MetaTrader 4専用 XAUUSDシグナル・トレードプランニングシステム このような経験はありませんか。 ゴールドを分析し、エントリーを待ち、ようやくポジションを持った直後に価格が逆方向へ動く。 早すぎる決済をしてしまったり、Stop Lossを動かしたり、数秒迷っている間にチャンスを逃したりする。 その後、相場は自分が最初に予想していた方向へ進み、目標へ到達する。 問題は常に方向判断ではありません。 本当の問題は、明確な計画がなかったことです。 どこでエントリーすべきか。 どこでトレードの前提が無効になるのか。 近い利益を確保すべきか、より大きな値動きを待つべきか。 現在のsetupが本当に強いのか、それとも無理にトレードを探しているだけなのか。 ゴールドは非常に速く動きます。 正しい分析でも、明確なプランがなければ数秒で悪い判断に変わることがあります。 ZORYKは、その問題を解決するために開発されました。 ZORYKとは ZORYKは、MetaTrader 4とXAU
ShapeRadar - 定番チャートパターン検出インジケーター ShapeRadar は、テクニカル分析の定番パターンをチャート上で自動的に検出します。ダブルトップ/ボトム、トリプルトップ/ボトム、ヘッドアンドショルダーと逆ヘッドアンドショルダー、上昇ウェッジと下降ウェッジ、レクタングル、三角形、フラッグ、ペナントに対応しています。価格がパターンの境界を越えて確定すると、パターン本体、エントリーポイント、ストップロス、ターゲットを描画し、情報パネルが検出済みパターンをまとめて表示します。 MetaTrader 5 版: https://www.mql5.com/en/market/product/208462 どの銘柄・時間足でも動作します。シグナルはローソク足の確定時にのみ成立するため、すでに描画されたマークが消えたり、現在の足で再描画されたりすることはありません。チャート上でパターンの位置、ブレイクの位置、エントリー・ストップ・ターゲットを確認でき、パネルがすべてを一か所にまとめます。 私のチャンネルへの登録をお願いします: https://www.mql5.com/en/cha
PRO Renko Systemは、特別にRENKOチャートを取引するために設計された高精度の取引システムです。 これは、様々な取引商品に適用することができる普遍的なシステムです。 システムは効果的に正確な逆転信号へのアクセスを与えるいわゆる市場の騒音を中和する。 表示器は非常に使いやすく、信号の生成に責任がある1つの変数だけがあります。 あなたは簡単にお好みの任意の取引ツールとレンコバーのサイズにツールを適応させることができます。 私はいつもあなたが私のソフトウェアで収益性の高い取引を支援するために余分なサポートを提供する準備ができています! 私はあなたに幸せで収益性の高い取引をしたいです! ご購入後にご連絡ください! 私はあなたに私のレンコチャートジェネレータを送信します。 私はまた、私の個人的な推奨事項やシステムの他のモジュールを無料で共有します!
SR Liquidity は、市場の流動性が集中し、価格が最も強く反応する「隠れたゾーン」を可視化するために設計されたトレーディング指標です。こうした流動性の高いエリアは強力なサポート(支持)およびレジスタンス(抵抗)レベルとして機能し、市場が反転する可能性が最も高いポイントを明確に示してくれます。 単なる一般的なサポートラインやレジスタンスラインを描画するのではなく、「SR Liquidity」は実際の価格変動を分析し、売りと買いの圧力が集中するゾーンを特定します。これらは、市場の真の動きを牽引する「流動性のプール(溜まり場)」そのものです。それらをチャート上に直接可視化することで、価格が実際に反応する前に、その動きを予測することが可能になります。つまり、このインジケーターは価格の方向性が変わる可能性を予測するのです。生のプライスアクションを、市場の重要な水準(転換点となり得るポイント)を示す、明確で実用的なロードマップへと変換してくれます。 このインジケーターは、FX、株価指数、貴金属、仮想通貨など、あらゆる銘柄や時間足で使用可能です。 ご購入後、取引手順や無料の優れた追加インジケ
Auto Optimized SpeedAngle は、継続的なウォークフォワード最適化(WFO:Walk-Forward Optimization)によりカーブフィッティング(過剰最適化)を排除した、機関投資家レベルのモメンタムベクトルシステムです。市場レジームの変化時に効果が低下する静的な入力に依存せず、アウトオブサンプル(OOS)検証を用いてパラメーターを動的に再キャリブレーションすることで、表示されるシグナルが単なる過去の偶然ではなく、確実な統計的優位性に基づいていることを保証します。 主な機関投資家向けフレームワーク ウォークフォワード最適化エンジン: ルックバック期間やしきい値の数千に及ぶ組み合わせを継続的にスキャンし、データをインサンプルとアウトオブサンプルに厳格に分離します。未検証のデータ環境において数学的優位性が証明された場合にのみ、新しいパラメーター設定を採用します。 定量的目的関数: 単なる純利益の追求ではなく、機関投資家レベルの安定性指標をターゲットとします。システム品質ナンバー(SQN)、期待値(1トレードあたりの平均Rマルチプル)、またはネットRの最適化を選
Professional Volume Profile An indicator for MetaTrader 4 that builds a horizontal Volume Profile directly on the price chart. It shows the levels where traders executed the most trades, helping to identify support/resistance zones and assess the balance of power in the market. What the Indicator Displays POC (Point of Control) — the level with the maximum trading volume (red line). VAH / VAL (Value Area High / Low) — the upper and lower boundaries of the value area, where 70% of the volume was
Italo Volume Indicator
Italo Santana Gomes
4.92 (79)
BUY INDICATOR AND GET EA FOR FREE AS A BONUS + SOME OTHER GIFTS! ITALO VOLUME INDICATOR  is the best volume indicator ever created, and why is that? The Indicator works on all time-frames and assets, indicator built after 7 years of experience on forex and many other markets. You know many volume indicators around the internet are not complete, does not help, and it's difficult to trade, but the Italo Volume Indicator is different , the Italo Volume Indicator shows the wave volume, when market
高度な数学的計算に基づいて、最も可能性の高い短期的な価格の動きを推定します。 特長 チャートの時間足とそれより上のすべての時間足で、直近の価格の動きを推定; 市場の実際のトレンドを計算; 最も重要なサポートとレジスタンスのレベルを計算; レベルが密集するゾーン、レベルのクロス、トレンドの変化をアラートで通知; システムリソースへの負担が軽い:ラインとパネルは値が変わったときだけ更新; 自動調整:あらゆる銘柄・あらゆる時間足で動作し、調整するパラメータは不要; 同じチャート上の他のインジケーター、EA、スクリプトと一緒に動作。 はじめに 一般的なトレード戦略を構成する古典的なインジケーターの多くは、単純な数学に基づいています。それは、それらが作られた当時に優れた数学者がいなかったからではなく、コンピューターが存在しなかったか、複雑な数学的演算を継続的に行うだけの処理能力がなかったからです。今では、どんなスマートフォンでも数十年前の最も強力なコンピューターをはるかに上回っています。 Advanced Price Movement Predictor(APMP)インジケーターは、現在の処
Atomic Analyst — MetaTrader 4 製品に関するご質問、設定方法、技術サポートについては、MQL5で直接メッセージをお送りください。 このインジケーターは、複雑な市場計算をシンプルな視覚シグナル、色分けされたローソク足、トレンド表示、ストップロスレベル、複数のテイクプロフィットゾーンに変換し、トレーダーが素早く理解して実際の市場環境で使用できるようにします。 主な取引用途: スキャルピングとイントラデイトレード: 素早い判断、明確な矢印、アラート、ローソク足カラー、構造化されたエントリー/エグジットゾーンのために設計されています。 デイトレードとスイングトレード: トレンド方向、強さ、モメンタム、マルチタイムフレーム分析を使って、より大きな市場の動きを追うのに役立ちます。 主な機能: • Price Action、強さ、モメンタム分析 • マルチタイムフレームトレンドスキャナー • 全体トレンド率の計算 • 買いと売りの矢印 • ストップロスと複数のテイクプロフィットレベル • 最大5つのフィボナッチベースのテイクプロフィットレベル • トレーリングストップ
Scalping Entry Points - is a manual trading system that can adjust to price movements and give signals to open trades without redrawing. The indicator determines the direction of the trend by the central level of support and resistance. The dot indicator provides signals for entries and exits.  Suitable for manual intraday trading, scalping and binary options. Works on all time frames and trading instruments. The indicator gives several types of alerts. How to use the product The blue line det
All in One package includes the  Oscillator Predictor ,  MACD Predictor ,  Thrust Scanner  and  Advanced Fibonacci  indicators which are mandatory for applying  Dinapoli  trade plans.  Please visit below links for detailed explanations of indicators. Advanced Fibonacci Indicator =>  https://www.mql5.com/en/market/product/52834 Thrust Scanner Indicator => https://www.mql5.com/en/market/product/52830 Overbought /Oversold Predictor indicator => https://www.mql5.com/en/market/product/52621 Macd P
または(TDO)は、「純粋な勢い 」の原則を使用して価格変動率を測定する指標です。 証券価格が10から15に上がると、価格の変化率は150%になりますが、15から10に戻ると、価格の変化率は33.3%になります。そのため、「価格変化率」(ROC)や「モメンタム」などのテクニカル分析指標は、下降するものよりも上昇する価格の動きの方が高い値を示します。 TDOはこの問題を修正して、トレーダーが勢いを正しく読み取るのを支援します。 重要な情報 TDOユーザーズマニュアル: https://www.mql5.com/en/blogs/post/717970 TDO FAQ: https://www.mql5.com/en/blogs/post/722015 TDOビデオライブラリ: https://www.mql5.com/en/blogs/post/722018 TDOエキスパートアドバイザーの例: https://www.mql5.com/en/blogs/post/731141 TDOの機能 TDOは純粋な勢いをパーセントとして計算するため、さまざまな市場のさまざまな証券を比較す
Quantum Imbalance Profiles   は、バランスとインバランスの局面を示すインジケーターです。市場がどの価格で出来高を取引したか、そのゾーン内でどちらの側が優勢だったか、そしてその後価格がどのレベルを通ってインパルス的に拡大したかを表示します。 従来のボリュームプロファイルが答えるのは「どこで取引が行われたか」という一つの問いだけです。各価格でどちらが優勢だったか、レンジがどう終わったか、市場がどちらの方向へ抜けたかは示しません。Quantum Imbalance Profiles はプロファイルを Volume Bid/Ask モードで構築し(各レベルの出来高を売りと買いに分割)、さらに独自のインバランスプロファイル(インパルス拡大の価格別分布)で補完します。ボリュームプロファイルとデルタはバランス局面を、インバランスプロファイルはそこからの離脱を、ローソク足上のデルタバブルは銘柄の平常値に対するアグレッションの急増を示します。 バランスとインバランス 市場は二つの状態を交互に繰り返します。バランスでは価格が狭いレンジに留まり、出来高が限られたレベルに集中し、出
Indicator for manual trading and technical analysis for Forex. It consists of a trend indicator with the opening level of the trading day and a arrow indicator for determining entry points. The indicator does not recolor; it works when the candle closes. Contains several types of alerts for signal arrows. Can be configured to work on any chart, trading instrument or time frame. The work strategy is based on searching for price movements along the trend.  To make " Buy " transactions: The tre
THE ONLY CURRENCY STRENGTH INDICATOR BUILT ON PRICE ACTION Most currency strength meters average an oscillator, or measure how far price has travelled. But these are not accurate measures of trend, Currency Strength Matrix measures trend strength, not just if a currency price has gone up or down. Currency Strength Matrix reads market structure . For each of the 28 major pairs it finds the confirmed cycle highs and lows, and decides whether that pair is in an uptrend, a downtrend, or neither. A
Dark Support Resistance  is an Indicator for intraday trading. This Indicator is programmed to identify  Support and Resistance Lines , providing a high level of accuracy and reliability. Key benefits Easily visible lines Only the most important levels will be displayed Automated adjustment for each timeframe and instrument Easy to use even for beginners Never repaints, never backpaints, Not Lag 100% compatible with Expert Advisor development All types of alerts available: Pop-up, Email, Push
作者のその他のプロダクト
FX777 Pillar 06: The Pot of Gold Volume Profile Protocol Step beyond conventional chart analysis and anchor your trading in the ultimate institutional footprint. FX777 Pillar 06 is not just an indicator; it is a sovereign multi-asset volume intelligence engine engineered to uncover the hidden financial gravity of the market . Infused with an energetic frequency of abundance, high-vibrational discipline, and good-luck karma , this system transforms your trading terminal into a sanctuary of weal
FREE
FX777 Volume MT4
Johan George Abraham Viviers
Welcome Please note that I am currently uploading all my precious indicators. (It takes time with all the files, names, pics etc.)  Feel free to ask questions. FX777 Markov Heatmap V35 is an institutional-grade analytical indicator designed for MetaTrader 4, built around advanced multi-factor quantitative modeling and Markov state transition matrices to map out market regime shifts in real time[cite: 12]. Core Logic & Strategy: How to Use It Professional price action and Smart Money traders k
FREE
Welcome Please note that I am currently uploading all my precious indicators. (It takes time with all the files, names, pics etc.)  Feel free to ask questions. FX777 QUANTUM RSI: Sovereign Quantum Stability v8.0 Overview Step into the next tier of institutional-grade technical analysis with FX777 Quantum RSI (v8.0) . Moving far beyond traditional, lagging indicator models, this subwindow masterpiece integrates dynamic volatility-based gates with an advanced Persistence Engine , filtering out f
FREE
Welcome Please note that I am currently uploading all my precious indicators. (It takes time with all the files, names, pics etc.)  Feel free to ask questions. FX777 Iceberg Reversal V3 – Sales Description Overview The FX777 Iceberg Reversal V3 is an advanced MetaTrader 4 indicator built upon the FX777 Master Trading Protocol . Designed for elite precision, it identifies institutional order flow absorption, liquidity traps, and dynamic mean reversion extremes to deliver high-probability revers
FREE
Welcome Please note that I am currently uploading all my precious indicators. (It takes time with all the files, names, pics etc.)  Feel free to ask questions. This indicator works on all TFs and instruments, from AUDCAD to Gold (Any vehicle). When price runs into one of these lines, then we would assume a reversal might happen. For Binary Options: Imagine there is 2min 23 sec remaining of the chart candle, price hit the S/R line, then trade the remainder time.this chart is an M5 chart when pr
Welcome Please ENJOY the indicator with me for now. I will add a full Description soon. For now, the indicator is easy to just load with no adjustments needed. I have a couple of these indicators, and will, over time, we will see which ones you want or which functions they should have. The Price is very Low. Hurry!! Meanwhile have a look at the other products available as well. Happy trading. Feel free to ask if you have any questions.
Turbo Turn MTF MT4
Johan George Abraham Viviers
FX777 Turbo Turn: The Quantum Threshold of Market Momentum Step beyond the ordinary boundaries of technical analysis and enter a realm where precision engineering meets the unseen flow of financial destiny. FX777 Turbo Turn is not merely a trading tool; it is a finely tuned instrument designed to capture the hidden rhythms of the market across multiple dimensions. Crafted with an uncompromising dedication to excellence and inspired by forces that transcend standard charting, this system honors a
Iron Drone MTF MT4
Johan George Abraham Viviers
Iron Drone: The Autonomous Vanguard of Financial Multi-Dimensionality Step beyond the conventional frontiers of price tracking and immerse yourself in an elite ecosystem where mathematical divergence converges with tactical execution. Iron Drone is not just an indicator; it is a multi-layered, autonomous intelligence engine engineered to track market imbalances across every higher dimension simultaneously . Rooted in a profound legacy of precision programming and dedicated to the enduring memo
Correlation MAX MT4
Johan George Abraham Viviers
FX777 Correlation V3.1 MTF: The Sovereign Multi-Dimensional Protocol Step beyond ordinary correlation and immerse yourself in an elite ecosystem where multi-timeframe synchronization meets institutional-grade precision. FX777 Correlation V3.1 MTF is not just an indicator; it is a master protocol engineered to decode market alignment across multiple dimensions simultaneously. Infused with an energetic frequency of abundance, high-vibrational discipline, and good-luck karma , this system transfo

Correlation MTF MT4
Johan George Abraham Viviers
FX777 Correlation V2.1 MTF: The Ultimate Multi-Timeframe Binary Options Reversal Engine Step beyond conventional trading boundaries and elevate your strategy with an elite multi-timeframe intelligence system designed specifically for the precision demands of the binary options trader . FX777 Correlation V2.1 MTF is a powerhouse instrument engineered to capture institutional market correlations and translate them into crystal-clear reversal signals across every time horizon . Infused with an en
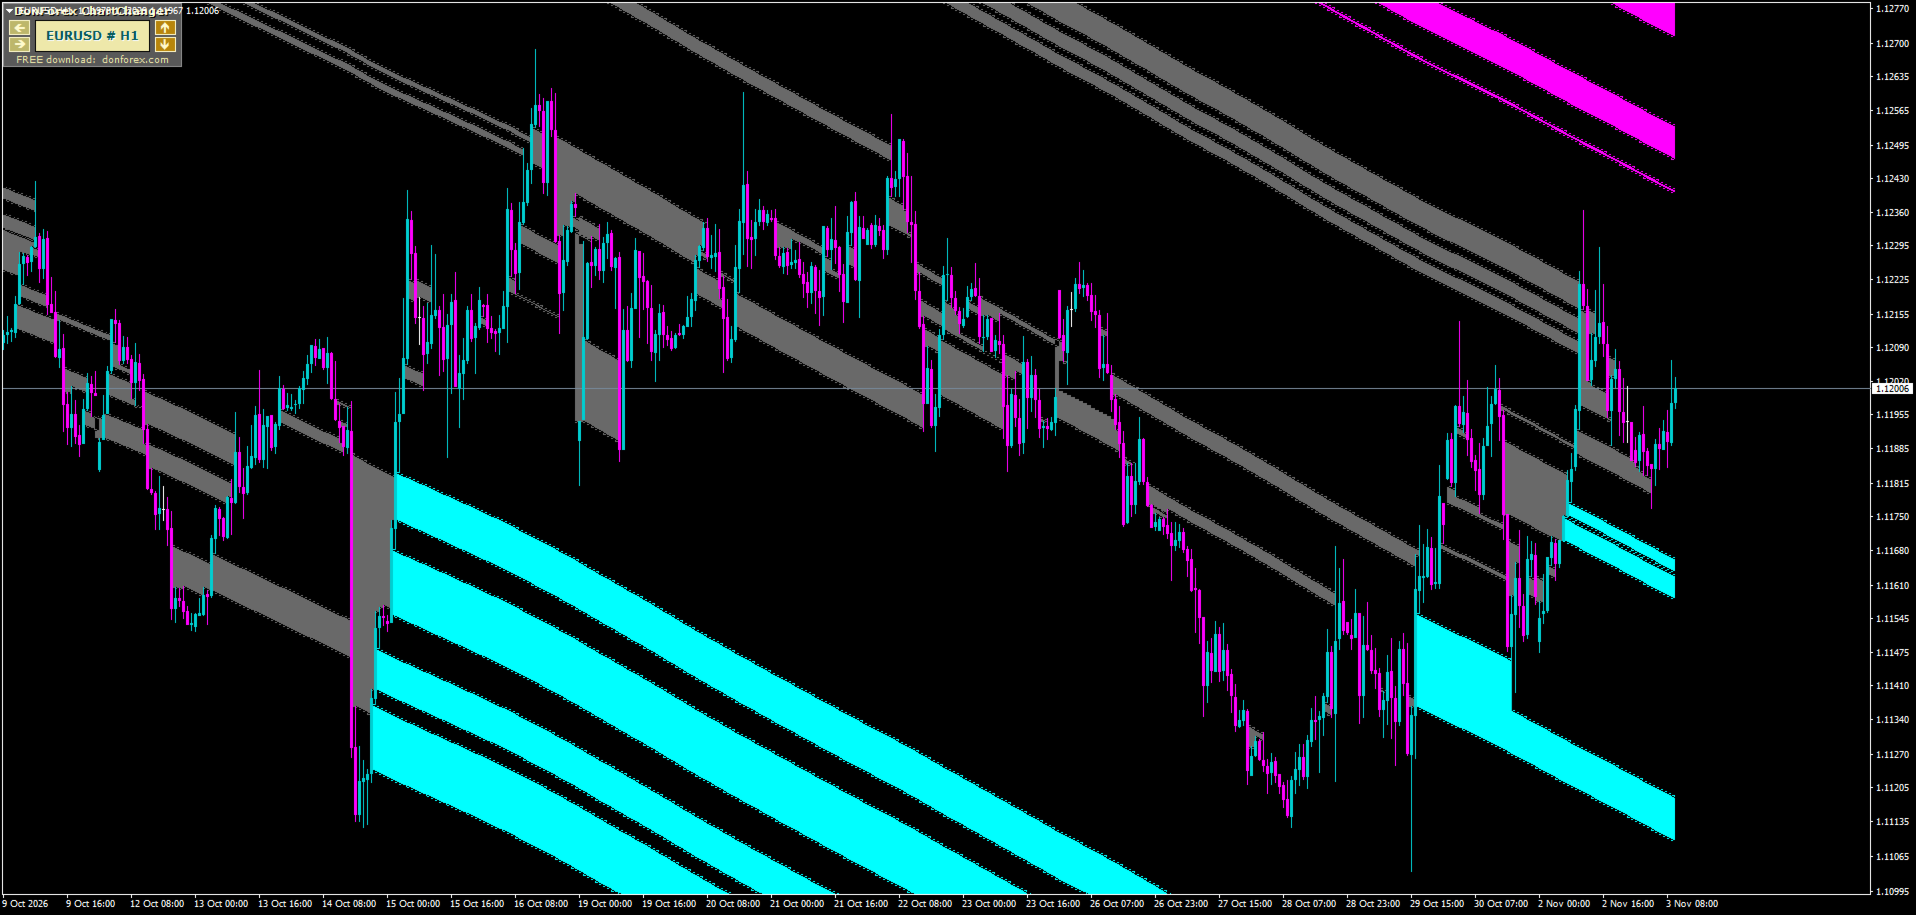
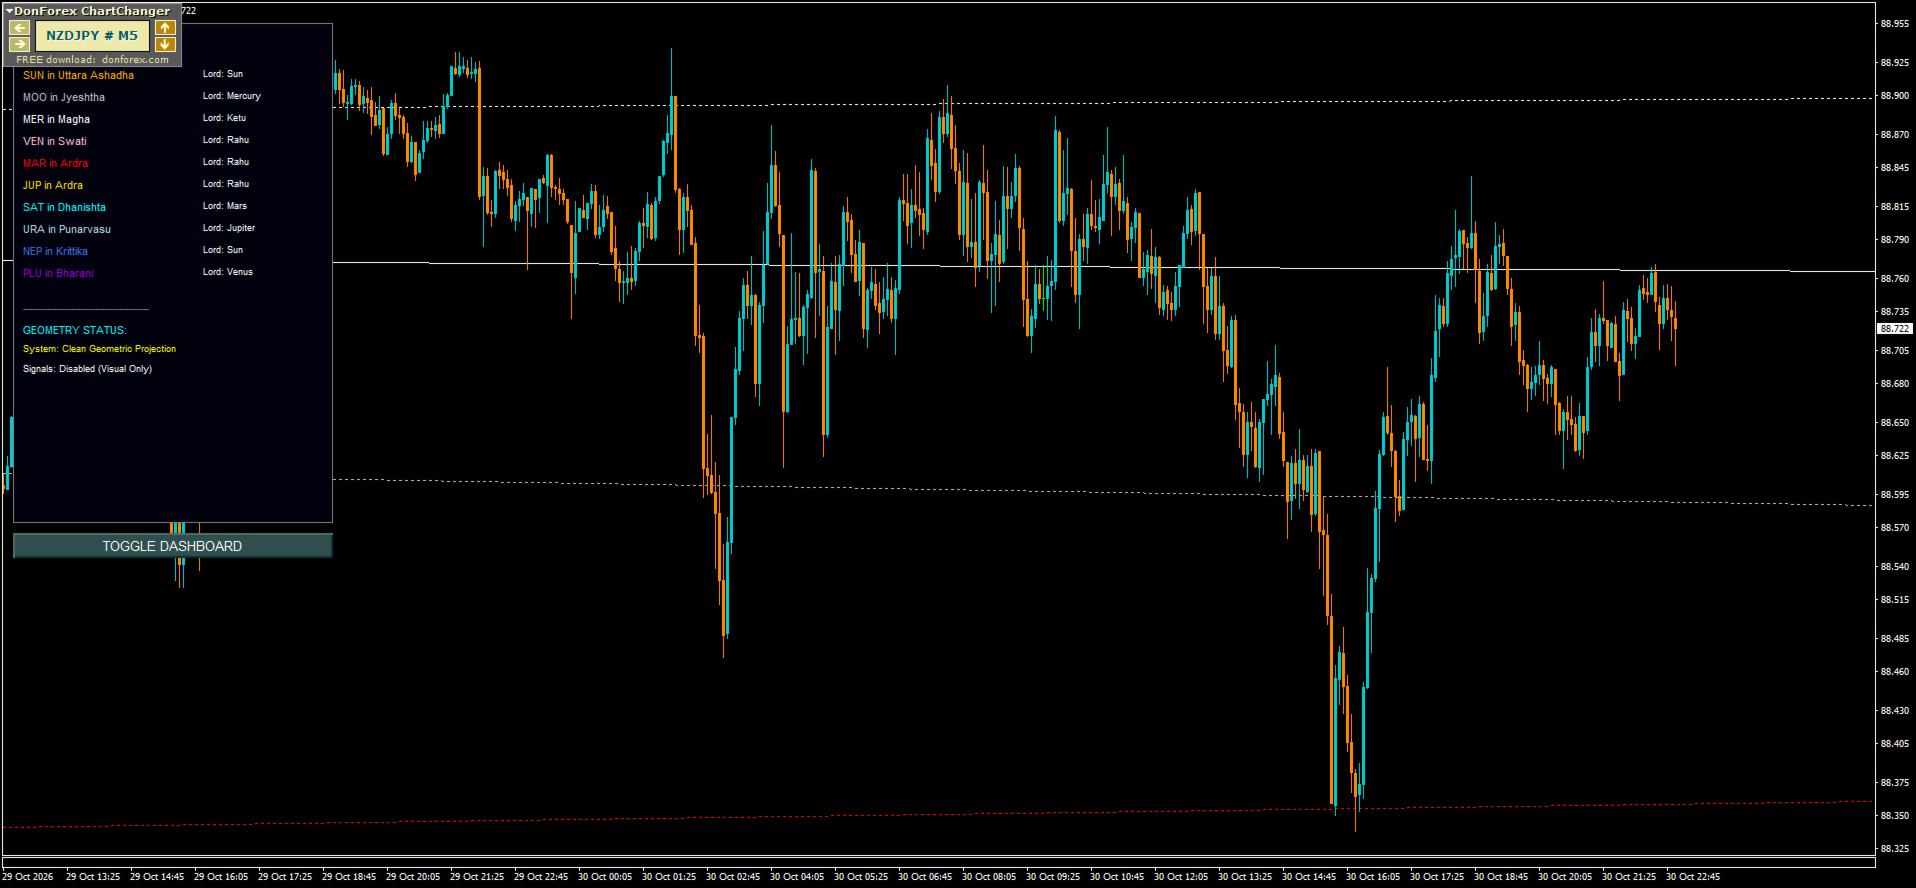
FX777 Gann Celestial V680 Vedic: The Cosmic Geometry & Nakshatra Protocol Step beyond conventional chart analysis and anchor your trading in the ancient, cyclical geometry of the cosmos . FX777 Gann Celestial V680 Vedic is not just an indicator; it is a master astronomical and geometric intelligence engine engineered to track planetary cycles, Vedic sidereal mechanics, and dynamic price-time squaring . Infused with an energetic frequency of abundance, high-vibrational discipline, and good-luck k
FX777 Gann Celestial V710 Flow: The Cosmic Inertia & Signal Protocol Step beyond traditional boundaries and immerse your strategy in the ultimate synchronization of astronomical mechanics and live market momentum. FX777 Gann Celestial V710 Flow is an advanced intelligence engine engineered to track planetary cycles, mass-inertia velocity, and dynamic Gann octave projections in real time . Infused with an energetic frequency of abundance, high-vibrational discipline, and good-luck karma , this
FX777 Liquidity 1000: The Sovereign Curved Liquidity Zone Protocol Step beyond basic support and resistance and trade right where institutional liquidity pools. FX777 Liquidity 1000 is an advanced indicator engineered to anchor dynamic, curved liquidity channels onto a heavy 1000-period Simple Moving Average (SMA) baseline, tracking the exact structural zones where price loves to reverse. Infused with an energetic frequency of abundance, high-vibrational discipline, and good-luck karma, this s
フィルタ:
レビューなし
レビューに返信