Pro RVI Signal Multi Filter Trend Reversal MT5

════════════════════════════════════════════════════════════════

⭐ RVI MULTI FILTER PRO - ADVANCED TREND & REVERSAL INDICATOR ⭐

════════════════════════════════════════════════════════════════


════════════════

PRODUCT TYPE & INFO

════════════════

• Product Name     : RVI Multi Filter Pro

• Product Type     : MQL5 Technical Indicator

• Platform         : MetaTrader 5 (MT5)

• Indicator Type   : Separate Window Oscillator & Chart Signal Arrows

• Trading Style    : Scalping, Day Trading, Swing Trading

• Supported Assets : Forex, Gold (XAUUSD), Indices, Crypto, Commodities

• Timeframes       : All Timeframes (M1, M5, M15, M30, H1, H4, D1)


════════════════

OVERVIEW & VALUE PROPOSITION

════════════════

Are you tired of false breakout signals and lagging crossovers ruining your trading consistency?


RVI Multi Filter Pro is a high-precision, institutional-grade technical indicator designed specifically for MetaTrader 5. Built upon the foundation of the Relative Vigor Index (RVI), this tool completely eliminates the guesswork from technical analysis by combining dynamic crossover detection with 15+ built-in multi-timeframe and trend filters.


Unlike standard indicators that paint lagging signals in isolation, RVI Multi Filter Pro verifies every single RVI crossover against multiple technical layers—including Trend Moving Averages, Momentum Oscillators, Dynamic Support/Resistance, Fibonacci Retracements, and Volatility measures—BEFORE displaying a signal on your chart.


💎 WHAT MAKES THIS INDICATOR YOUR ULTIMATE TRADING ADVANTAGE?


✔ Zero Repaint Signal Logic: Once a candle closes, the arrows and alerts remain fixed forever.

✔ All-In-One Filtering Ecosystem: Say goodbye to cluttered charts with 10 different indicator windows. Combine up to 15 filters directly inside a single indicator.

✔ Fully Customizable Architecture: Toggle filters ON or OFF with a single click to tailor the system perfectly to your personal strategy.

✔ Smart On-Screen Visuals: Features custom chart arrows and clean indicator plot lines for instant visual clarity.

✔ Multi-Channel Alerts: Receive instant Pop-up, Audio, and Mobile Push Notifications right to your smartphone the exact second a valid setup forms.

✔ Highly Optimized MQL5 Code: Engineered with lightning-fast array algorithms to ensure zero lag, minimal CPU usage, and maximum execution speed.


════════════════

KEY FEATURES

════════════════

1. Core RVI Signal Engine:

   Tracks the velocity of price movement using high-precision RVI Main and Signal line crossovers to capture explosive market entries early.


2. 15+ Advanced Filter Layers:

   Filter out bad trades during low-volume sessions, chop, or counter-trend movements using built-in technical engines.


3. On-Chart Visual Signal Arrows:

   Plots non-repainting buy and sell arrows directly on price candles with full color and size customization.


4. Comprehensive Alert System:

   Never miss a setup with integrated desktop pop-ups, custom audio wave sounds, and instant MetaTrader mobile push notifications.


5. Closed-Bar Signal Confirmation:

   Built-in logic enforces closed-bar signal evaluation to eliminate repainting and fakeouts during live candle formation.


════════════════

DETAILED FEATURE & FILTER BREAKDOWN

════════════════

Discover how each integrated filter engine enhances your trading performance:


🔹 1. RSI CROSS FILTER

   • Function: Filters trades based on Relative Strength Index momentum boundary breakouts.

   • Advantage: Ensures buy trades occur only as price bounces out of oversold territory, and sell trades occur when exiting overbought zones.


🔹 2. ADX TREND STRENGTH FILTER

   • Function: Evaluates market trend intensity via Average Directional Index.

   • Advantage: Blocks trades when the market is in a weak, flat, or choppy range (e.g., ADX below 20).


🔹 3. SINGLE MOVING AVERAGE FILTER

   • Function: Filters trades relative to a primary trend-defining Moving Average.

   • Advantage: Only permits BUY signals when price is above the MA, and SELL signals when price is below it.


🔹 4. ICHIMOKU SENKOU SPAN B FILTER

   • Function: Utilizes Ichimoku's key equilibrium cloud boundary.

   • Advantage: Protects you from trading into heavy structural resistance or support.


🔹 5. RSI 75 TREND FILTER

   • Function: Uses a higher-period RSI (default 75) as an overarching trend direction gauge.

   • Advantage: Confirms long-term momentum alignment (RSI > 50 for Buys, RSI < 50 for Sells).


🔹 6. DOUBLE MOVING AVERAGE CROSSOVER FILTER

   • Function: Compares Fast MA vs. Slow MA (e.g., EMA 30 vs EMA 140).

   • Advantage: Ensures trades are taken strictly in alignment with macro trend direction.


🔹 7. AWESOME OSCILLATOR (AO) MULTI-MODE FILTER

   • Function: Offers Volume Level, Color Histogram, and Zero-Line alignment checks.

   • Advantage: Guarantees trade signals carry strong market momentum before entry.


🔹 8. PARABOLIC SAR FILTER

   • Function: Evaluates price location relative to Parabolic Stop and Reverse dots.

   • Advantage: Provides trailing trend confirmation for rapid momentum acceleration entries.


🔹 9. HEIKEN ASHI BAR FILTER

   • Function: Smooths out price noise using Heiken Ashi candle math.

   • Advantage: Keeps you aligned with true directional sentiment during noisy price spikes.


🔹 10. CCI TREND & OB/OS FILTERS

    • Function: Dual Commodity Channel Index modes for trend determination and level exhaustion.

    • Advantage: Captures ideal cyclical entries while avoiding late over-extended entries.


🔹 11. RVI MACRO TREND & SIGNAL FILTERS

    • Function: Secondary higher-period RVI trend confirmation.

    • Advantage: Double-checks indicator alignment across multiple timeframe periods.


🔹 12. MACD HISTOGRAM & ZERO-LINE FILTERS

    • Function: Validates momentum direction via MACD line interaction and zero level.

    • Advantage: Filters out entries that lack underlying institutional convergence.


🔹 13. DYNAMIC SUPPORT & RESISTANCE FILTER

    • Function: Measures price proximity to recent high/low structural zones.

    • Advantage: Prevents buying directly into supply blocks or selling straight into demand floors.


🔹 14. ZIGZAG FIBONACCI RETRACEMENT FILTER

    • Function: Dynamic swing detection combined with Golden Ratio Fib levels (38.2% / 61.8%).

    • Advantage: Validates pullback trades occurring specifically within high-probability reversal zones.


════════════════

COMPLETE INPUT PARAMETERS GUIDE

════════════════


⚙️ === RVI SETTINGS ===

• InpPeriod (Default: 14)

  → Calculation period for the core RVI indicator engine.

• InpMainColor (Default: clrBlue)

  → Color of the RVI Main line plot in the separate window.

• InpSignalColor (Default: clrRed)

  → Color of the RVI Signal line plot in the separate window.

• InpShowArrows (Default: true)

  → Enables or disables drawing Buy/Sell arrows on the price chart.

• InpBuyColor (Default: clrAqua)

  → Visual color of the BUY signal arrows on your chart.

• InpSellColor (Default: clrRed)

  → Visual color of the SELL signal arrows on your chart.

• InpArrowSize (Default: 2)

  → Thickness/size setting for chart arrows (1 = smallest, 5 = largest).


⚙️ === ALERT & NOTIFICATION ===

• InpEnableAlert (Default: true)

  → Master toggle for MetaTrader pop-up dialog notifications.

• InpEnableSound (Default: true)

  → Master toggle for playing audio alert sounds upon signal trigger.

• InpSoundBuy (Default: "alert.wav")

  → Audio file name for BUY signals (must exist in MT5/Sounds folder).

• InpSoundSell (Default: "alert.wav")

  → Audio file name for SELL signals (must exist in MT5/Sounds folder).

• InpEnablePush (Default: true)

  → Sends real-time Push Notifications to MetaTrader Mobile app on iOS/Android.

• InpAlertClosedBar (Default: true)

  → Ensures alerts trigger strictly on bar completion to prevent repainting.


⚙️ === RSI CROSS FILTER ===

• Use_RSI_Cross_Filter (Default: false)

  → Enables RSI oversold/overbought breakout verification.

• RSI_Length (Default: 14)

  → Period setting for RSI calculation.

• RSI_Price_Source (Default: PRICE_CLOSE)

  → Applied price type for RSI calculation.

• Oversold (Default: 30.0)

  → Threshold level below which price is considered oversold.

• Overbought (Default: 70.0)

  → Threshold level above which price is considered overbought.


⚙️ === ADX FILTER ===

• Use_ADX_Filter (Default: false)

  → Enables ADX trend strength filtering.

• ADX_Period (Default: 10)

  → Calculation period for ADX line.

• ADX_Min_Level (Default: 20.0)

  → Minimum required ADX reading; lower values block signal generation.


⚙️ === SINGLE MA FILTER ===

• Use_MA_Filter (Default: false)

  → Enables single Moving Average trend filtering.

• MA_Period (Default: 50)

  → Period length for the Moving Average.

• MA_Method (Default: MODE_SMA)

  → Calculation method (SMA, EMA, SMMA, LWMA).

• MA_Shift (Default: 0)

  → Horizontal indicator shift along the time axis.


⚙️ === ICHIMOKU SENKOU SPAN B FILTER ===

• Use_Ichimoku_Filter (Default: false)

  → Enables Ichimoku Cloud level filter.

• Ichimoku_SenkouB (Default: 52)

  → Calculation period for Senkou Span B line.

• Ichimoku_Kijun (Default: 26)

  → Calculation period for Kijun-sen line.


⚙️ === RSI 75 FILTER ===

• Use_RSI75_Filter (Default: false)

  → Enables high-period RSI momentum directional filter.

• RSI_Filter_Period (Default: 75)

  → Calculation period for long-term RSI filter.


⚙️ === DOUBLE MA FILTER ===

• Use_DoubleMA_Filter (Default: false)

  → Enables dual Moving Average trend alignment filter.

• MA_A_Period (Default: 30)

  → Period length for Fast MA (MA_A).

• MA_A_Method (Default: MODE_EMA)

  → Averaging method for Fast MA.

• MA_A_Applied (Default: PRICE_CLOSE)

  → Applied price source for Fast MA.

• MA_A_Shift (Default: 0)

  → Horizontal shift for Fast MA.

• MA_B_Period (Default: 140)

  → Period length for Slow MA (MA_B).

• MA_B_Method (Default: MODE_EMA)

  → Averaging method for Slow MA.

• MA_B_Applied (Default: PRICE_CLOSE)

  → Applied price source for Slow MA.

• MA_B_Shift (Default: 0)

  → Horizontal shift for Slow MA.


⚙️ === AWESOME OSCILLATOR FILTER ===

• Use_AO_Filter (Default: false)

  → Master switch for Awesome Oscillator filter engine.

• Use_AO_Volume_Filter (Default: false)

  → Requires AO value to exceed absolute min/max levels.

• AO_Buy_Min (Default: 4.0)

  → Minimum positive AO threshold for BUY signals.

• AO_Sell_Max (Default: -4.0)

  → Maximum negative AO threshold for SELL signals.

• Use_AO_Color_Filter (Default: false)

  → Requires current AO bar color to match trade direction.

• Use_AO_Zero_Filter (Default: false)

  → Requires AO to be above 0 for BUY and below 0 for SELL.


⚙️ === PARABOLIC SAR FILTER ===

• Use_SAR_Filter (Default: false)

  → Enables Parabolic SAR filter check.

• SAR_Step (Default: 0.02)

  → Acceleration factor step increment.

• SAR_Maximum (Default: 0.2)

  → Maximum acceleration factor limit.


⚙️ === HEIKEN ASHI FILTER ===

• Use_HeikenAshi_Filter (Default: false)

  → Enables smoothed Heiken Ashi candle sentiment check.


⚙️ === CCI TREND FILTER ===

• Use_CCI_Filter (Default: false)

  → Enables basic Commodity Channel Index zero-line filter.

• CCI_Period (Default: 50)

  → Period length for trend CCI calculation.

• CCI_Applied (Default: PRICE_CLOSE)

  → Applied price source for trend CCI.


⚙️ === CCI OB & OS FILTER ===

• Use_CCI_OBOS_Filter (Default: false)

  → Enables CCI extreme level filter checks.

• CCI_OBOS_Period (Default: 14)

  → Period length for dynamic OB/OS CCI.

• CCI_OBOS_Applied (Default: PRICE_CLOSE)

  → Applied price source for OB/OS CCI.

• CCI_Overbought (Default: 100.0)

  → Overbought threshold mark.

• CCI_Oversold (Default: -100.0)

  → Oversold threshold mark.


⚙️ === RVI TREND FILTER ===

• Use_RVI_Filter (Default: false)

  → Enables secondary macro RVI zero-line trend filter.

• RVI_Period (Default: 75)

  → Calculation period for macro RVI filter.


⚙️ === RVI SIGNAL FILTER ===

• Use_RVI_Signal_Filter (Default: false)

  → Enables multi-period RVI cross filter confirmation.

• RVI_Signal_Period (Default: 20)

  → Period setting for secondary RVI check.


⚙️ === MACD SIGNAL FILTER ===

• Use_MACD_Filter (Default: false)

  → Enables MACD Histogram momentum filter.

• MACD_FastEMA (Default: 12)

  → Fast EMA period for MACD.

• MACD_SlowEMA (Default: 26)

  → Slow EMA period for MACD.

• MACD_SignalSMA (Default: 9)

  → Signal line period for MACD.

• MACD_Applied (Default: PRICE_CLOSE)

  → Price source for MACD calculation.


⚙️ === MACD LEV 0 FILTER ===

• Use_MACD_Zero_Filter (Default: false)

  → Requires MACD Main line to be above/below zero level.


⚙️ === SUPPORT & RESISTANCE FILTER ===

• Use_SR_Filter (Default: false)

  → Enables structural high/low level proximity filter.

• SR_Period (Default: 50)

  → Lookback bar range for identifying S/R levels.

• SR_Zone_Points (Default: 80)

  → Proximity zone buffer distance measured in points.


⚙️ === FIBONACCI FILTER ===

• Use_Fib_Filter (Default: false)

  → Enables ZigZag swing dynamic Fibonacci level filter.

• Fib_Level_1 (Default: 0.382)

  → First Fibonacci retracement ratio level.

• Fib_Level_2 (Default: 0.618)

  → Second Fibonacci retracement ratio level.

• ZigZag_Depth (Default: 12)

  → Minimum bars without high/low deviation.

• ZigZag_Deviation (Default: 5)

  → Point threshold for swing point validation.

• ZigZag_Backstep (Default: 3)

  → Minimum bar gap between successive swing pivots.


════════════════

USER GUIDE & RECOMMENDED STRATEGIES

════════════════


📌 STEP-BY-STEP SETUP GUIDE:


1. Attach `RVI Multi Filter Pro` to any MT5 chart window.

2. Select your desired base RVI Period (Default 14 works excellent across H1/H4 timeframes).

3. Choose your preferred strategy mode by enabling specific filter groups:


🔥 STRATEGY PRESET 1: TREND-FOLLOWING POWERHOUSE

   • Ideal for: Day Trading Forex Majors & Gold (M15, H1 timeframes).

   • Active Filters:

     - Use_DoubleMA_Filter = true (MA_A: 30 EMA, MA_B: 140 EMA)

     - Use_ADX_Filter = true (ADX_Min_Level = 20)

     - Use_HeikenAshi_Filter = true

   • Trade Rules: Take BUY arrows when price trends above 140 EMA with strong ADX and green Heiken Ashi candles.


🔥 STRATEGY PRESET 2: REVERSAL & SWING ENTRY

   • Ideal for: Swing Trading Indices & Crypto (H4, D1 timeframes).

   • Active Filters:

     - Use_RSI_Cross_Filter = true

     - Use_Fib_Filter = true

     - Use_MACD_Filter = true

   • Trade Rules: Take signals occurring as price touches key 38.2%-61.8% Fibonacci zones with momentum convergence.


📌 RECOMMENDED RISK MANAGEMENT:

• Stop Loss (SL): Place SL slightly past the recent Swing High/Low or nearest Support/Resistance level.

• Take Profit (TP): Target a minimum Risk-to-Reward ratio of 1:2 or exit when an opposing RVI cross occurs.


════════════════

THANK YOU & SUPPORT

════════════════

Thank you for choosing RVI Multi Filter Pro to empower your trading journey!


We are dedicated to building high-quality, professional tools for MetaTrader 5 traders worldwide. If you have any questions, need assistance with settings, or want setup tips, please feel free to reach out via direct message on the MQL5 Community.


If you find this indicator helpful, please consider leaving a 5-star review! Your feedback helps us continue providing regular updates and improvements.


Happy Trading & May the Trend Be With You! 🚀📈

おすすめのプロダクト
Introduction This indicator detects volume spread patterns for buy and sell opportunity. The patterns include demand and supply patterns. You might use each pattern for trading. However, these patterns are best used to detect the demand zone (=accumulation area) and supply zone (=distribution area). Demand pattern indicates generally potential buying opportunity. Supply pattern indicates generally potential selling opportunity. These are the underlying patterns rather than direct price action. T
ZEUS-indi — Premium Multi-Timeframe Signal Indicator ( MQL5 LEGACY CHANNEL ) ZEUS-indi is a professional signal indicator for MetaTrader 5 that combines 9 internal indicators across 3 timeframes into a single, weighted decision system. Built for traders who value PRECISION over noise. KEY FEATURES Multi-Timeframe Scoring (Base + HiTF + HiTF2)    Real-time agreement percentage across three timefram
1. Why did I develop this series of indicators I found that most traders need to use multiple time frame indicators. They usually switch time frame to see indicators. However, once the timeframe is switched, you cannot see the  corresponding relationship  between  the price in the smaller timeframe  and  the indicator in the larger timeframe . For example: if your price chart is in H1 timeframe, you can see H4, D1 and W1 indicators in H1 timeframe Chart. This is more helpful for you to find th
移動平均線クロス、ボリンジャーと移動平均線のクロス、移動平均線の角度でサイン表示 MT5インジケータ こちらに サイト があります。 このインジケータは3つのパターンでサインを表示(切り替え可能)します。 ① 移動平均線のクロス ② ボリンジャーバンドと短期移動平均線とのクロス ③ ボリンジャーバンドと短期移動平均線とのクロスと、中期移動平均線と長期移動平均線の角度 ⓸ ボリンジャーバンドと短期移動平均線とのクロス(サインを交互に表示) 移動平均線のクロス 指定した短期移動平均線と長期移動平均線のゴールデンクロスでは買いサイン、デットクロスでは売りサインを表示します。 ディフォルトでは短期は5,長期は20となっています。 もちろん変更可能になります。 移動平均線の種類をEMA(指数平滑移動平均線)やSMMA(平滑化移動平均)などに変更可能で適する価格も変更可能になります。 ボリンジャーバンドと短期移動平均線のクロス ボリンジャーバンド(以降BB)と短期移動平均線のクロスでサインを表示します。 ディフォルトではBB+1σと5MAのゴールデンクロスで買いサイン、BB-1σと5MAのデット
The intelligent algorithm of the Godfather indicator accurately determines the trend, filters out market noise and generates entry and exit levels. The indicator will help in finding entry points when analyzing the price chart. The program first receives a "snapshot" of the graph, then analyzes it. The results are reported to the trader in the form of signals. The main purpose of this indicator is to determine the moments of entries and exits from transactions, so the indicator displays only th
1. Why did I develop this series of indicators I found that most traders need to use multiple time frame indicators. They usually switch time frame to see indicators. However, once the timeframe is switched, you cannot see the  corresponding relationship  between  the price in the smaller timeframe  and  the indicator in the larger timeframe . For example: if your price chart is in H1 timeframe, you can see H4, D1 and W1 indicators in H1 timeframe Chart. This is more helpful for you to find th
The Saturated Trend indicator simplifies your decision making process by recognizing reversals with a built-in algorithm and then confirming signals at support/resistance levels. Implements a type of technical analysis based on the idea that the market is cyclical. Thus, the indicator follows the market trend with great reliability, ignoring sharp market fluctuations and noise around the average price. The indicator can be used both for pipsing on short periods and for long-term trading.
**Zonar Smart Analysis** is a complete "Smart Money" trading system designed for MetaTrader 5. It automates the classic **Opening Range Breakout (ORB)** strategy while filtering false signals using advanced Price Action algorithms (Wick Rejection & Swing Analysis). Stop guessing where the session is going. Let Zonar draw the zones, identify the breakout, and highlight institutional Order Blocks for maximum confluence. ### Key Features * **Automated ORB Box:** Automatically detects the Market
DirectionBias4 Pro
Luigi Salvatores Buigues Morillo
DirectionBias4 Pro is an institutional-grade algorithmic trading system designed for serious traders and Prop Firm challengers. Unlike traditional indicators that rely on a single lagging moving average, DB4 Pro uses an advanced Weighted Scoring Engine to evaluate the market from three different dimensions simultaneously, filtering out fake breakouts and market noise. Developed by Luis Buigues (binaryoption.cloud), this system has been rigorously backtested and Out-Of-Sample validated. Core S
1. Why did I develop this series of indicators I found that most traders need to use multiple time frame indicators. They usually switch time frame to see indicators. However, once the timeframe is switched, you cannot see the  corresponding relationship  between  the price in the smaller timeframe  and  the indicator in the larger timeframe . For example: if your price chart is in H1 timeframe, you can see H4, D1 and W1 indicators in H1 timeframe Chart. This is more helpful for you to find th
RSI Monitoring and Alerts — Not Buy or Sell Signals IMPORTANT: The arrows, notifications, and alerts generated by Your RSI Alerts MT5 are NOT Buy or Sell signals and should not be interpreted as recommendations to open, close, or manage any trading position. The indicator simply monitors the relationship between the RSI and the configured levels. An upward or downward arrow represents the direction in which the RSI crossed a level , not a suggested trading direction. For example, an upward arrow
The indicator scans for Dinapoli thrust pattern in multiple timeframes for the all markets filtered and shows the results on Dashboard. Key Features Dashboard can be used for all markets It can scan for thrust pattern on MN1, W1, D1, H4, H1, M30, M15 ,M5, M1 timeframes Ability to choose number of bars required above/below displaced moving average to define thrust Parameters UseMarketWatch: Set true to copy all symbols available in market watch MarketWatchCount : Set the number of symbols that
1. Why did I develop this series of indicators I found that most traders need to use multiple time frame indicators. They usually switch time frame to see indicators. However, once the timeframe is switched, you cannot see the  corresponding relationship  between  the price in the smaller timeframe  and  the indicator in the larger timeframe . For example: if your price chart is in H1 timeframe, you can see H4, D1 and W1 indicators in H1 timeframe Chart. This is more helpful for you to find th
このインジケーターは実践的なトレードに最適な自動波動分析のインジケーターです! 場合... 注:   Tang Lun (Tang Zhong Shuo Zen) の命名規則の影響で、私は波のグレーディングに西洋の名前を使用することに慣れていません。基本的な波を ペン 、二次波のバンドを セグメント と名付けました。同時に、 セグメント にはトレンドの方向が指定されます (この命名方法は将来のノートで使用されます。最初に言っておきます)。ただし、アルゴリズムは曲がりくねった理論とはほとんど関係がないため、付けるべきではありません。これは、私の市場分析 によって要約された、絶えず変化する複雑な運用ルール を反映しています。 バンドは標準化され、人によって異なることがないよう定義されており、市場参入を厳密に分析する上で重要な役割を果たす人為的な干渉の描画方法が排除されています。 このインジケーターを使用することは、取引インターフェイスの美しさを改善することと同等であり、元の K ライン取引を放棄し、取引の新しいレベルに連れて行きます。また、宣伝の観点から顧客の認識も向上します。 イ
Introduction to Fractal Pattern Scanner Fractal Indicator refers to the technical indicator that makes use of the fractal geometry found in the financial market. Fractal Pattern Scanner is the advanced Fractal Indicator that brings the latest trading technology after the extensive research and development work in the fractal geometry in the financial market. The most important feature in Fractal Pattern Scanner is the ability to measure the turning point probability as well as the trend probabil
1. Why did I develop this series of indicators I found that most traders need to use multiple time frame indicators. They usually switch time frame to see indicators. However, once the timeframe is switched, you cannot see the  corresponding relationship  between  the price in the smaller timeframe  and  the indicator in the larger timeframe . For example: if your price chart is in H1 timeframe, you can see H4, D1 and W1 indicators in H1 timeframe Chart. This is more helpful for you to find th
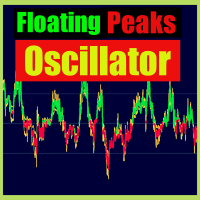
Floating peaks oscillator - it the manual trading system. It's based on Stochastik/RSI type of oscillator with dynamic/floating  overbought and oversold levels. When main line is green - market is under bullish pressure, when main line is red - market is under bearish pressure. Buy arrow appears at the floating bottom and sell arrow appears at floating top. Indicator allows to reverse signal types. Main indicator's adjustable inputs : mainTrendPeriod; signalTrendPeriod; smoothedTrendPeriod; tre
1. Why did I develop this series of indicators I found that most traders need to use multiple time frame indicators. They usually switch time frame to see indicators. However, once the timeframe is switched, you cannot see the  corresponding relationship  between  the price in the smaller timeframe  and  the indicator in the larger timeframe . For example: if your price chart is in H1 timeframe, you can see H4, D1 and W1 indicators in H1 timeframe Chart. This is more helpful for you to find th
The 4 headed dragon is an indicator that has two functions. 1) Set the background trend. 2) Mark the predominant trend. By combining these two indicator signals, we will be able to trade for or against the trend, adapting the signals to your reading of the market. You can download the demo and test it yourself. 1) Set the background trend.    Define four possibilities of trend that are the four heads of the dragon, marked by colors on the indicator, marking a) Powerful buying trend. b) Weak
Stochastic Color Alerts
Pablo Filipe Soares De Almeida
Stochastic Color Alerts Stochastic Color は、動的な色の変化と統合されたアラートシステムを備えたカスタム・ストキャスティクス・オシレーターで、モメンタムの方向とクロスオーバーシグナルを識別します。 メインライン (%K) は自動的に色が変わります: 緑:上昇モメンタム 赤:下降モメンタム オレンジ:現在形成中のローソク足 このインジケーターは、クラシックな %K、%D、Slowing パラメータに基づき、期間は設定可能で、標準レベルは 20 と 80 です。 含まれるアラートタイプ: 買われすぎ・売られすぎゾーンでの %K と %D のクロスによる Buy/Sell アラート 任意のレベルでのクロスオーバーアラート 色の変化アラート(モメンタムの変化) すべてのアラートはローソク足確定後に生成され(リペイントなし)、1本のローソク足につき1回のみ通知され、モバイルプッシュ通知も利用可能です。 すべての銘柄と時間足で、スキャルピング、デイトレード、スイングトレードに適しています。
このプロダクトを購入した人は以下も購入しています
SMART TREND TRADING SYSTEM — 特別オファー トレードシステム、自動化EA、学習コンテンツとサポートをひとつに。 MT5用のSmart Trend Trading Systemを99米ドルでご購入いただくと、シグナルの自動売買に使える Smart Universal Expert Advisorを無料でプレゼント します。 STTSは、トレンドの方向、エントリー・決済シグナル、反転ゾーン、重要な価格水準をチャート上にまとめて表示します。システムを参考に手動で取引することも、付属のEAを接続し、ご自身で選んだ設定に基づいて自動売買することもできます。 現在の99米ドルという価格は、これからの30件の購入に適用されます。その後、価格は149米ドルに上がります。 充実のパッケージ内容 ご購入には以下が含まれます。 • MT5用Smart Trend Trading System。 • Smart Universal Expert Advisor — 無料。 • STTSの完全版PDFユーザーマニュアル。 • STTS公式オンラインコース。 • インストールと
Trend Sniper X
Sarvarbek Abduvoxobov
4.9 (39)
Trend Sniper X は、トレードの方向性と潜在的な反転ポイントを明確かつ正確に特定するのに役立つ、MetaTrader 5 用のマルチタイムフレーム・トレンドフォロー指標です。 MT4用: https://www.mql5.com/en/market/product/193245 価格情報: 現在の価格はプロモーション価格であり、今後のアップデートや新機能のリリースに伴い変更される場合があります。 ボーナス特典: このインジケーター用の無料自動売買アシスタントEAを入手するには、購入後に an 著者(開発者)へメッセージをお送りください。 Code2Profit チャンネル マルチタイムフレーム分析で相場をマスターしよう! Trend Sniper X で勝率を最大化する方法:重要なルールとセッションのコツ 技術仕様 プラットフォーム MetaTrader 5 インジケータータイプ マルチタイムフレーム・トレンドインジケーター 操作タイムフレーム あらゆるチャートタイムフレームに対応。個別に選択可能な上位タイムフレーム (M1–MN1) を搭載 主要銘柄 FX、ゴールド (X
Neuro Poseidon is a new indicator by Daria Rezueva. It combines precise trading signals with adaptive TP/SL levels - creating best possible trades as a result! Message me and get  Neuro Poseidon Assistant  as a gift to automize your trading process! What makes it stand out? 1. Proven profitability on all assets and timeframes 2. Only confirmed BUY and SELL signals present on the chart 3. Adaptive TP & SL levels generated by the software for each trade 4. Easy to understand - suitable for al
Zoryk Gold
Reda El Koutbane
5 (12)
割引は 24 時間後に終了します — 次の価格は$ 69 ZORYK — MetaTrader 5専用 XAUUSDシグナル・トレードプランニングシステム このような経験はありませんか。 ゴールドを分析し、エントリーを待ち、ようやくポジションを持った直後に価格が逆方向へ動く。 早すぎる決済をしてしまったり、Stop Lossを動かしたり、数秒迷っている間にチャンスを逃したりする。 その後、相場は自分が最初に予想していた方向へ進み、目標へ到達する。 問題は常に方向判断ではありません。 本当の問題は、明確な計画がなかったことです。 どこでエントリーすべきか。 どこでトレードの前提が無効になるのか。 近い利益を確保すべきか、より大きな値動きを待つべきか。 現在のsetupが本当に強いのか、それとも無理にトレードを探しているだけなのか。 ゴールドは非常に速く動きます。 正しい分析でも、明確なプランがなければ数秒で悪い判断に変わることがあります。 ZORYKは、その問題を解決するために開発されました。 ZORYKとは ZORYKは、MetaTrader 5とXAU
まず正直に言いましょう。 どんなインジケーターも、それ単体であなたを利益化させることはできません。もしそう言う人がいるなら、それは夢を売っているだけです。完璧な売買シグナル(矢印)を表示するインジケーターは、いくらでも“完璧に見せる”ことができます。正しい過去の区間を拡大して、勝ちトレードだけを切り取ればいいだけです。私たちはそれをしません。 SMC Intraday Formula はツールです。 市場構造を読み取り、最も高い確率の価格ゾーンを特定し、今この瞬間のスマートマネーの痕跡をシンプルな言葉で正確に示します。最終判断はあなたが行います。トレードを実行するのもあなたです。しかし今は「希望」ではなく「精度」でエントリーできます。 私たちはこのインジケーターを、ゴールド(XAUUSD)および主要FX通貨ペアで約3年間、日々のスキャルピングに使用してきました。M1、M5、M15、M30の主要ツールです。これは未来を予測しようとするのではなく、今まさに形成されている高確率セットアップを示し、その理由を説明します。 他のすべてのインジケーターと何が違うのか? ほとんどのトレーディングイ
UNIX SCALPER — 特別オファー セットアップを見つけ、取引プランを確認し、取引方法を選ぶ。 MT5用UNIX Scalperを99米ドルで購入すると、シグナルを自動売買に活用できるSmart Universal Expert Advisorが無料で付属します。 UNIX Scalperは、市場分析、BUY/SELL/WAITの判断、Entry、Stop Loss、TP1、TP2の水準を、見やすいパネルにまとめています。取引プランに沿って手動で取引することも、付属のEAを接続し、ご自身の設定に従って自動執行することもできます。 現在の99米ドルの価格は、今後30件の購入に適用されます。その後、価格は149米ドルになります。 パッケージの内容 ご購入には以下が含まれます。 • MT5用UNIX Scalper。 • Smart Universal Expert Advisor — 無料。 • UNIX Scalperの完全版PDFユーザーマニュアル。 • UNIX Scalper公式オンラインコース。 • インストールと設定の手順ガイド。 • 購入者限定コミュニティへ
SuperScalp Pro
Van Minh Nguyen
4.65 (34)
SuperScalp Pro - Professional Multi-Layer Confluence Scalping System SuperScalp Proは、クラシックなSupertrendに複数のインテリジェントな確認フィルターを追加した、高度なスキャルピングインジケーターです。より高い確率が期待できるBuy/Sellの取引機会を特定し、ダマシのシグナルを大幅に減らすことをサポートします。 明確なBuyとSellの矢印がチャート上に直接表示され、ATRに基づくStop LossとTake Profitのレベルがリアルタイムで自動計算されます。 購入後、設定方法や推奨設定についてのサポートが必要な場合は、私にご連絡ください。 SuperScalp Pro Auto Traderを使用して、シグナルを簡単に自動化できます: [Auto Trader] 推奨設定ファイルをダウンロード: [Set File] 完全なドキュメントは製品ブログでご覧いただけます: [User Guide] 最新情報を受け取るには公式チャンネルに参加してください: [Official Channel]
Reversion King Indicator
Eugen-alexandru Zibileanu
5 (9)
新たな王者が登場 - インジケーター + 注文管理表示(TP1 + TP2 + TP3)+ オプションのTelegramシグナル送信機能付き(無料) (完全なトレード&シグナルシステム) ゴールド向け最高のEA: Gold Slayer このインジケーターには、高度な戦略、カスタマイズ可能な注文管理システム、そしてエンベロープ拡張を組み合わせた平均回帰システムが搭載されています。さらに、RSIなど複数のインテリジェントな確認フィルターによって、高確率の反転エントリーをBUY・SELLシグナルとして検出します。 単にトレードを学ぶだけでなく、複数ポジションを効果的に管理し、過去に利益を出しているオープンポジションで損失トレードをカバーする方法も学べます。 M5向けに構築・最適化されており、流動性が高くシグナルの精度が安定しているBTCUSDとXAUUSDで優れたパフォーマンスを発揮します。 このインジケーターは、ATRを基に自動計算されたエントリー、ストップロス、テイクプロフィットレベルを備えた明確なLong・Shortシグナルを提供するため、リスク管理が最初から組み込まれています。 マ
GoldenX Entryは、MT5向けのインジケーターであり、適応型Smart Entry Trendアルゴリズム、シグナルスコアリングシステム、マーケットレジーム検出機能、およびボラティリティフィルターを備えています。各シグナルには、計算されたエントリーレベル、3つのテイクプロフィット(TP1、TP2、TP3)、およびストップロスレベルが含まれます。本インジケーターは、異なる市場環境に適応するために設計された複数の分析レイヤー上に構築されており、マルチレイヤー分析システムと内蔵オプティマイザーおよび統計トラッキングシステムを組み合わせています。リスク・リワード(RR)指標および過去のトレード履歴に基づく定量分析を提供します。 使い始めは簡単です — 選択した時間足でオプティマイザーを実行し、そのままチャート上でインジケーターを使用します。 コア機能 GoldenX Entryは、シグナルエンジンとトレード管理機能、そして過去統計トラッキングを1つのチャートに統合しています: - 内蔵オプティマイザー: オプティマイザーはチャート上でワンクリックで実行できます。200通りのパラメー
Gann Made Easy   は、ミスター・ギャンの理論を使用した取引の最良の原則に基づいた、プロフェッショナルで使いやすい外国為替取引システムです。 W・D・ガン。このインジケーターは、ストップロスとテイクプロフィットレベルを含む正確な買いと売りのシグナルを提供します。 PUSH通知を利用して外出先でも取引可能です。 ご購入後、取引方法の説明と優れた追加インジケーターを無料で入手するには、私にご連絡ください! おそらく、ギャンの取引手法についてはすでに何度も聞いたことがあるでしょう。通常、ギャンの理論は初心者のトレーダーだけでなく、すでにある程度の取引経験がある人にとっても非常に複雑なものです。なぜなら、ギャンの取引手法は理論的にはそれほど簡単に適用できるものではないからです。私はその知識を磨き、最良の原則を私の外国為替インジケーターに組み込むために数年を費やしました。 このインジケーターは非常に簡単に適用できます。必要なのは、それをチャートに添付し、簡単な取引推奨事項に従うだけです。このインジケーターは常に市場分析の仕事を行い、取引の機会を探します。適切なエントリーポイントを検
Get The FABLE Pro Suite – 7 Supporting Indicators  Supporting indicators for Entry In The Zone & SMC Multi-Timeframe.  No additional cost. Download instantly and ready to use after purchase. Welcome to ENTRY IN THE ZONE AND SMC MULTI TIMEFRAME Entry In The Zone and SMC Multi Timeframe is a real-time market analysis tool developed based on Smart Money Concepts (SMC), designed to help analyze market structure, price direction, and key areas where price may react. It supports both Single-Timeframe
伝説が帰ってきました:Entry Points Pro 10。 MQL5 Marketのトップ3に3年間入り続けた伝説的インジケーターの再始動です。 2つのバージョンで合計589件の高評価レビュー、毎日数千人のトレーダーが実際のトレードに使用し、デモのダウンロードは31,000件以上   MT4+MT5 。 私はこの5年間に寄せられたレビューをすべて読み、約束を並べる代わりに、その答えをバージョン10に組み込みました。1999年から相場に携わり、 誠実さ、自らの評判、そして顧客を大切にする 作者による製品です。 Entry Points Proのエントリーシグナルは、リペイント(再描画)を一切行いません。 そして今回初めて、これは作者の言葉ではなく検証可能な事実になりました。確定シグナルはローソク足の終値確定後にのみ表示され、自動テストで リペイントはゼロ と確認されています(EURUSD、XAUUSD、BTCUSDで2,486,568回の不変条件チェック、違反0件)。検証方法は公開されており、ストラテジーテスターでご自身で再現できます。 ご購入後は、必ずすぐにダイレクトメッセージでご
M1 SNIPER は使いやすいトレーディングインジケーターシステムです。M1時間足向けに設計された矢印インジケーターです。M1時間足でのスキャルピングのためのスタンドアロンシステムとして、また既存のトレーディングシステムの一部としても使用できます。このトレーディングシステムはM1時間足での取引に特化して設計されていますが、他の時間足でも使用できます。元々、この手法はXAUUSDとBTCUSDの取引用に設計しましたが、他の市場においても役立つと考えています。 インジケーターのシグナルは、トレンドの方向と逆方向に取引できます。インジケーターのシグナルを利用して両方向に取引するのに役立つ特別な取引テクニックをご紹介します。この手法は、特別な動的なサポートとレジスタンスの価格帯を利用することに基づいています。 ご購入後、M1 SNIPER矢印インジケーターをすぐにダウンロードできます。さらに、M1 SNIPERツールのすべてのユーザーに、以下のスクリーンショットに表示されているApollo Dynamic SRインジケーターを無料で提供しています。この2つのインジケーターを組み合わせることで
Tokyo Indicatorは、トレンドの方向性、潜在的な取引シグナル、および市場状況を視覚的に分かりやすく表示します。 色分けされた階段状のトレンドラインにより、強気局面(青色)と弱気局面(マゼンタ色)が明確に区別されます。トレンドの変化に合わせて表示される方向矢印は、売買の好機を強調します。 統合されたダッシュボードには、現在のシグナル、市場のバイアス(傾向)、モメンタム、ボラティリティ、シグナルの品質がひと目で分かるようにまとめられています。これにより、トレーダーはパネルを切り替えることなく、価格変動(プライスアクション)とインジケーターの数値を照らし合わせて分析を行うことができます。 すっきりとしたチャート表示と簡潔な市場概要により、Tokyo Indicatorはトレンド分析や取引判断における体系的なアプローチをサポートします。 あらゆる時間足や銘柄に対応しており、特に金(ゴールド)の取引に適しています。 トレンド スキャナーの強力なサポートを利用して、無料のインジケーターを入手し、プライバシーを守ります。あーみー!     設定 ShowHUD - チャート上のパネ
ATOMIC ANALYST — 特別オファー 市場分析、自動化EA、学習コンテンツとサポートをひとつに。 MT5用のAtomic Analystを99米ドルでご購入いただくと、シグナルの自動売買に使える Smart Universal Expert Advisorを無料でプレゼント します。 Atomic Analystは、プライスアクション、トレンドの方向、エントリー・決済シグナル、損切り水準、複数の利確水準をチャート上にまとめて表示します。分析を参考に手動で取引することも、付属のEAを接続し、ご自身で選んだ設定に基づいて自動売買することもできます。 現在の99米ドルという価格は、これからの30件の購入に適用されます。その後、価格は149米ドルに上がります。 充実のパッケージ内容 ご購入には以下が含まれます。 • MT5用Atomic Analyst。 • Smart Universal Expert Advisor — 無料。 • Atomic Analystの完全版PDFユーザーマニュアル。 • Atomic Analyst公式オンラインコース。 • インストールと設
Market Structure Order Block Dashboard MT5 は、市場構造と主要な価格反応ゾーンをチャート上で直接読み取りたいトレーダー向けに設計された MT5 インジケーターです。BOS、ChoCH、オーダーブロック、Fair Value Gap (FVG)、流動性、Kill Zones、Volume Profile、そして素早い分析のためのコンパクトなダッシュボードを組み合わせています。 本インジケーターは、市場構造、ICT、Smart Money の概念を意思決定の枠組みとして使用するトレーダーを対象としています。トレンド継続、反転の可能性、価格の不均衡、流動性ターゲット、注目ゾーンをより構造的に特定する助けとなります。 購入者向けの付属リソース 購入後、MQL5 のプライベートメッセージにてご依頼いただくと、完全な PDF ユーザーガイドとパラメータ設定のヒントを提供いたします。MQL5 のプライベートメッセージによる直接的な技術サポート。 バージョン 1.20 では 2 つの重要な追加機能があります: Pending BOS / Pending Cho
通貨強さウィザードは、取引を成功させるためのオールインワン ソリューションを提供する非常に強力な指標です。このインジケーターは、複数の時間枠のすべての通貨のデータを使用して、このまたはその外国為替ペアのパワーを計算します。このデータは、使いやすい通貨インデックスと通貨パワーラインの形式で表され、特定の通貨のパワーを確認するために使用できます。 必要なのは、取引したいチャートにインジケーターを接続することだけです。インジケーターは、取引する通貨の実際の強さを示します。このインジケーターは、トレンドに合わせて取引するときに有利に利用できる売買高の圧力の極値も示します。このインジケーターには、フィボナッチに基づく可能なターゲットも表示されます。 このインジケーターは、PUSH 通知を含むあらゆるタイプのアラートを提供します。 購入後ご連絡下さい。私の取引のヒントをあなたと共有し、素晴らしいボーナスインジケーターを無料で提供します! 幸せで有益な取引をお祈りします。
FiboSniper Pro – Multi-Filter Fibonacci System with Auto SL/TP and Control Panel FiboSniper Proは、動的なFibonacci Envelopesと複数の確認フィルターを組み合わせ、選別されたBuyおよびSellシグナルを生成するテクニカルインジケーターです。FibonacciレベルはMoving AverageとATRを基に計算され、その後ADX、EMA、RSI、ATR、Volume、Time、Candle構造によってフィルタリングされます。インジケーターは、ATRに基づく自動Stop LossおよびTake Profitレベルをチャート上に直接表示し、さらに迅速な調整が可能なインタラクティブControl Panelを提供します。 購入後、推奨設定ファイルと詳細な使用方法については、私にご連絡ください。 Auto Trader Xを使用してFiboSniper Proのシグナルを自動化できます: [Auto Trader X] User GuideとSet Files: [Click her
このインジケーターを購入された方には、以下の特典を 無料 で提供しています: 各トレードを自動で管理し、ストップロスとテイクプロフィットを設定し、戦略ルールに基づいてポジションを決済する補助ツール 「Bomber Utility」 様々な銘柄に合わせたインジケーターの設定ファイル(セットファイル) 「最小リスク」、「バランスリスク」、「待機戦略」 の3つのモードで使用できる Bomber Utility 用の設定ファイル このトレーディング戦略をすぐに導入・設定・開始できる ステップバイステップのビデオマニュアル ご注意: 上記の特典を受け取るには、MQL5のプライベートメッセージシステムを通じて販売者にご連絡ください。 オリジナルのカスタムインジケーター 「Divergence Bomber(ダイバージェンス・ボンバー)」 をご紹介します。これは、MACDのダイバージェンス(乖離)戦略に基づいた 「オールインワン」型のトレーディングシステム です。 このテクニカルインジケーターの主な目的は、価格とMACDインジケーターの間に発生するダイバージェンスを検出 し、将来の価格の動きを示
Adaptive Price Action Engine インジケーターを購入すると、EAが無料に マルチタイムフレーム対応・自己最適化トレンド&ローソク足パターン分析 市場環境は常に変化しており、すべてのPrice Actionパターンが、あらゆる市場環境で同じ価値を持つわけではありません。 Adaptive Price Action Engine は、変化する市場環境への適応を目的として、 トレンド構造、マルチタイムフレーム分析、ローソク足パターン、統計的最適化 を1つの分析フレームワークに統合しています。 2つのアダプティブモード Dual Alpha Trend Mode 低い時間足と高い時間足のAlpha Trendパラメータを自動的に探索し、直近の市場動向に合わせてトレンド判定を適応させます。 Candlestick + Alpha Mode Alpha Trendによる市場レジーム判定と、 22種類の強気・弱気ローソク足パターン を組み合わせます。すべてのパターンを同じように扱うのではなく、さまざまなパターンの組み合わせを統計的に評価し、選択された市場環境において過去
Power Candles V3 - 自己最適化型強弱インジケーター Power Candles V3は 、通貨や銘柄の強さを、適用されたすべてのチャート上で実行可能なトレードプランに変換します。単にローソク足を色分けするだけでなく、バックグラウンドでリアルタイムの自動最適化を実行し、目の前の銘柄に対して最適なストップロス、テイクプロフィット、およびシグナルの閾値を提示します。ワンクリックで実取引に適用でき、エントリーポイント、ストップロス、テイクプロフィットのラインが正確な価格位置にチャート上に表示され、方向性を示すアラートがリアルタイムで発動します。 このツールは、Stein Investmentsのエコシステムの一部です。  18種類以上のツールをすべて閲覧し、AIを活用したセットアップの推奨事項を入手し、  https://stein.investments でコミュニティに参加しましょう クローズしたバーごとに3,000回以上のトレードシミュレーション。9つの強さの状態。2つの戦略を並行してテスト。勝率の高い設定をワンクリックで適用。 なぜこれが必要なのか ほとんどの強
SMART PRICE ACTION CONCEPTS — 特別オファー 構造を確認し、ゾーンを見つけ、取引プランを立てる。 MT5用Smart Price Action Conceptsを49米ドルで購入すると、Smart Universal Expert Advisorが無料で付属します。 Smart Money Concepts(SMC)、ICTスタイルの分析、プライスアクションを、見やすいチャートにまとめます。市場構造、オーダーブロック、流動性の参考水準、インバランスを確認し、Smart Panelで表示する要素を選択できます。 現在の49米ドルの価格は、今後30件の購入に適用されます。その後、価格は100米ドルになります。 パッケージの内容 • MT5用Smart Price Action Concepts。 • Smart Universal Expert Advisor — 無料特典。 • 完全版PDFユーザーマニュアルと公式オンラインコース。 • インストールと設定の手順ガイド。 • 購入者限定コミュニティへの参加とサポート。 ツール、学習教材、わかりやすい入門
Axiom Matrix — 特別オファー Axiom Matrix を 49 米ドルで購入すると、Smart Universal Expert Advisor を無料でプレゼント。 市場をスキャン。セットアップを比較。次のチャートを選ぶ。 Axiom Matrix は複数銘柄・複数時間足の分析を一つのダッシュボードに集約します。チャートを一つずつ開かずに注目する市場を探せます。 気配値表示または選択した銘柄を複数の時間足でスキャン。 トレンド、モメンタム、出来高、ボラティリティ、市場環境の質を比較。 Best Axiom Pick、シグナルの状態、クリックできるセルでセットアップを確認。 Axiom Matrix は分析用ダッシュボードです。取引は実行しません。 パッケージ内容 Axiom Matrix Smart Universal Expert Advisor PDF ユーザーガイドとオンライン講座。 設定ガイドと購入者コミュニティへのアクセス。 Smart Universal Expert Advisor は独立した特典です。本製品の直接的な自動化を約束するものではありません。
SUPERHEROインジケーターは、「オールインワン」方式に基づいて設計された多通貨対応の取引システムです。このインジケーターは市場を独自に分析し、取引の開始および終了のタイミングに関するシグナルを提供します。ストップロス注文とテイクプロフィット注文を使用します。R:R比率は1:1です。 このシステムはスマートフォンにプッシュ通知を送信できるため、PCに縛られることなく「外出先」からでも取引を行うことができます。自己勘定取引を行う企業に最適です。 すべてのお客様への特典: このインジケーターをご購入いただいたすべてのお客様に、私から特別なユーティリティをプレゼントいたします。その内容は以下の通りです: 自動的にストップロス注文とテイクプロフィット注文を発注します 価格が目標水準に達すると、自動的に取引を決済します 指値注文による取引に対応しています 平均化取引モードに対応しています この優れた、しかも非常に便利なユーティリティをプレゼントとして受け取りたい場合は、SUPERHEROインジケーターをご購入後、直ちにMQL5プラットフォームのプライベートメッセージを通じて私までご連絡くださ
CRT Candle Range Theory HTF MT5 - Ultimate CRT Indicator: 高度なICTコンセプトとMalaysian SnRトレーディングシステム 最も先進的なCandle Range Theoryインジケーターでマーケットメーカーの足跡をマスターしましょう。Ultimate CRT Indicatorを使用して、Smart Money Concepts (SMC)の真の力を解き放ち、機関投資家のように正確にトレードします。真剣なトレーダー専用に構築されたこのインジケーターは、ICT Concepts (Inner Circle Trader)の核となる柱である、非常に効果的なCandle Range Theory (CRT)を自動化し、Malaysian Support and Resistance (SnR)エントリー手法とFVG (Imbalance)ゾーンの致命的な精度でそれを強化します。 MT5でForex、Crypto、Indicesのいずれを取引している場合でも、このアルゴリズムは市場のノイズを取り除き、ダマシ(fakeout)を
トレンドキャッチャーインジケーター トレンドキャッチャーインジケーターは、開発者独自の適応型トレンド分析指標を組み合わせることで、市場価格の動きを分析します。短期的なノイズを除去し、根底にあるモメンタムの強さ、ボラティリティの拡大、価格構造の挙動に焦点を当てることで、真の市場方向性を特定します。また、移動平均線、RSI、ボラティリティフィルターなどの平滑化およびトレンドフィルタリング機能を備えたカスタマイズ指標も使用します。 実際の運用状況のモニタリングやその他の製品については、こちらをご覧ください: https://www.mql5.com/en/users/mechanic/seller ご注意ください。私はTelegramでEAや設定を販売していません。詐欺です。すべての設定はブログで無料で公開しています。 重要!ご購入後すぐにご連絡ください。手順とボーナスをお送りします!
RelicusRoad Pro: 定量的市場オペレーティングシステム 【期間限定】無制限アクセス 70% OFF - 2,000人超のトレーダーと共に なぜ多くのトレーダーは「完璧な」インジケーターを使っても失敗するのでしょうか? それは、文脈を無視して 単一の概念 だけでトレードしているからです。文脈のないシグナルは単なるギャンブルです。勝ち続けるには、 根拠の重なり(コンフルエンス) が必要です。 RelicusRoad Proは単なる矢印インジケーターではありません。完全な 定量的市場エコシステム です。独自のボラティリティモデリングを用いて、価格が推移する「適正価値の道(Fair Value Road)」をマッピングし、ノイズと真の構造的ブレイクを判別します。 推測はやめましょう。機関投資家レベルの「ロード・ロジック」でトレードを。 コアエンジン:「Road」アルゴリズム システムの中心となる Road Algo は、市場環境にリアルタイムで適応するダイナミックなボラティリティチャネルです。 安全ライン(平衡点) と、価格が数学的に反転しやすい 拡張レベル を投影します。 Si
ATSTRONG PRO:市場構造&ブレイクアウトインジケーター ブレイクアウト検出エンジン | 5つの動的TPターゲット | ライブダッシュボードパネル | リペイントなし 導入価格 現在の価格: $59 — 10回の販売ごとに価格が$10上昇します。 ATSTRONG PRO は、MetaTrader 5 用に設計された高度なブレイクアウトおよび機関投資家向け市場構造インジケーターです。 高確率のスイングピボットを検出し、クラスター化されたサポートとレジスタンスの蓄積ゾーンを特定し、 リアルタイムで構造の破壊(BOS)と性質の変化(CHoCH)のシグナルを発します。 このインジケーターは、ダイナミックなストップロスと5つの個別のテイクプロフィットレベル(TP1〜TP5)をチャート上に自動的に直接描画します。 リスクリワード予測ボックス、星付けされたシグナル品質の評価、およびリアルタイムのオンチャートパフォーマンス分析ダッシュボードを備えています。 取引に関する注意: これは手動取引および市場分析用のインジケーターです。ローソク足の確定時に明確な視覚的シグナル、レベル、アラー
UZFX {SSS} スキャルピング・スマートシグナル v5.0 MT5は、変動の激しい市場において正確かつリアルタイムのシグナルを求めるスキャルパー、デイトレーダー、スイングトレーダー向けに設計された、リペイントのない高性能な取引インジケーターです。(UZFX-LABS)によって開発されたこのインジケーターは、価格行動分析、トレンド確認、スマートフィルタリングを組み合わせることで、すべての通貨ペアおよび時間枠において、高確率の売買シグナル、警告シグナル、トレンド継続の機会を生成します。 トレードの判断に迷うのはもうやめましょう。明確さ、正確さ、そして規律ある市場執行を求めるトレーダーのために設計された、体系的なシグナルシステムに従い始めましょう。 間違いなく、MQL5で入手可能な最高のインジケーターの一つです。絶対に見逃さないでください!!「スマートなトレーダーのためのスマートシグナル」 最新バージョン5.0がリリースされました。価格は予告なく最大499.99ドルまで値上がりする可能性がありますので、チャンスを逃さないようお早めにお求めください!! 購入を決める前に!無料トライアル
SMC Market Structure MT5 PRO is a chart-based analysis indicator for MetaTrader 5 designed for traders who use Smart Money Concepts (SMC), Inner Circle Trader (ICT) concepts, market structure, liquidity analysis, and multi-timeframe price action. The indicator brings a comprehensive collection of SMC and ICT tools into a single chart, including Market Structure, Break of Structure (BOS), Change of Character (CHoCH), Order Blocks (OB), Fair Value Gaps (FVG), Inverse Fair Value Gaps (IFVG), Balanc
作者のその他のプロダクト
CCI MULTI-FILTER OB/OS SIGNAL PRO MT5 17 Confirmation Filters + Arrows + Alerts Professional CCI Overbought / Oversold Buy-Sell Arrow Indicator for MetaTrader 5 with 17 optional confirmation filters, closed-bar signals, popup / push / email / sound alerts. Turn raw CCI crosses into cleaner entries. Keep every filter OFF for classic CCI arrows, or stack RSI, ADX, MA, Ichimoku, AO, SAR, Heiken Ashi, MACD, RVI, Support-Resistance, and Fibonacci to reduce weak signals. PRODUCT
HARMONIC PATTERN SCANNER DASHBOARD MT5 – Multi Pair Multi TF Gartley Bat Butterfly Crab Cypher Shark + MA RSI RVI Filters PRODUCT TYPE Product type : Technical Indicator Platform : MetaTrader 5 (MT5) Chart mode : Chart window overlay (dashboard + optional pattern drawing) Plots : 0 (no extra price buffers) Version : 1.13 Author : Harmonic Dashboard by FAZA A N Use : Multi-symbol / multi-timeframe harmonic scanning, alerts, and visual trade planning (Entry / SL /
PINBAR MULTI-FILTER SIGNALS MT5 No-Repaint Price Action Arrows with 17 Optional Confirmations Non-repaint pin bar detector for MetaTrader 5. Buy and sell arrows print on closed candles only. Optional trend, momentum, and level filters can block a pin before an alert is sent. PRODUCT TYPE • Type         : MT5 technical indicator (NOT an Expert Advisor) • Function     : Marks pin-bar rejections and can alert you. It doe
5 and 6 Candle Pattern Multi Filter No Repaint A MetaTrader 5 chart indicator that marks Buy and Sell arrows from two closed-candle reversal patterns, then confirms them with optional technical filters and alerts. This product is a technical indicator, not an Expert Advisor. It does not open, close, or manage trades. It plots arrows on the chart window after a candle has closed and can send popup, sound, push, and email alerts. WHAT THIS INDICATOR IS FOR Many candle tools paint a signal while th
ADX SIGNAL ARROWS MULTIFILTER — NO REPAINT BUY SELL INDICATOR FOR MT5 Professional ADX +DI / −DI crossover arrows with 17 optional confirmation filters, closed-bar logic, and multi-channel alerts. Turn raw directional movement into cleaner, filterable buy and sell arrows — without waiting for a second indicator window and without signals that jump after the candle has closed. PRODUCT TYPE • Platform : MetaTrader 5 (MT5) • Produc
ALLIGATOR EXACT SIGNAL MT5 No-Repaint Buy/Sell Arrows + 17 Smart Filters + Full Alerts Alligator Exact Signal MT5 is a professional chart-window indicator for MetaTrader 5. It draws the classic Bill Williams Alligator (Jaw, Teeth, Lips) and prints clear BUY / SELL arrows only when the three lines are in exact order: • BUY = Lips above Teeth above Jaw • SELL = Jaw above Teeth above Lips Every extra confirmation is optional. You can run a clean Alligator-only sign
BB BREAKOUT MULTIFILTER PRO Bollinger Band Buy Sell Signals + 17 Smart Filters for MT5 Precision Bollinger Band breakout arrows with optional multi-filter confirmation, alerts, sound, and mobile push. Built for traders who want a clean chart signal and full control over when a trade setup is allowed. PRODUCT TYPE Type : Technical Indicator (Chart Window) Platform : MetaTrader 5 File : .mq5 Version : 1.42 Display : Upper / Middle
RSI Divergence Breakout Pro – Regular and Hidden Divergence + Trendline Breakout Multi-Filter for MT5 RSI Divergence Breakout Pro finds disagreement between price and RSI, then turns that setup into a visual signal on the MetaTrader 5 chart. It marks Regular and Hidden divergences, draws the connecting line, and can print a separate Breakout Buy or Breakout Sell arrow when price closes through that line. All confirmation filters are optional and off by default. You can use raw divergence only, o
CCI Multi Filter Pro MT5 - Zero Cross Buy Sell Arrows with 17 Confirmation Filters and Instant Alerts CCI Multifilter Pro is a MetaTrader 5 indicator that uses CCI zero-cross as the entry trigger, then confirms that trigger with optional filters. Buy is considered when CCI crosses above zero. Sell is considered when CCI crosses below zero. A signal is accepted only if every filter you enabled also agrees. You can run a simple CCI-only setup, or combine trend, momentum, candle structure, support/
CHO MULTI-FILTER PRO MT5 No-Repaint Chaikin Oscillator Zero-Cross Signals + 16 Smart Filters + Alerts Turn Chaikin Oscillator zero-line crosses into cleaner, filter-confirmed Buy and Sell arrows — after the candle closes, with no repaint on confirmed signals. This is a professional MetaTrader 5 indicator built for traders who want a clear CHO zero-cross engine, then the freedom to add trend, momentum, volatility, structure, and price-action confirmation. Enable
Pin Bar Rejection and Marubozu Multi Filter Signal Indicator for MT5 PRODUCT TYPE Platform      : MetaTrader 5 Type          : Technical Indicator Category      : Price Action / Signal / Multi Filter Display       : Main chart arrows Aqua arrow    : BUY Red arrow     : SELL Does not trade: no orders are opened or closed Markets       : Forex, Gold, Indices, Crypto, Oil, Stocks Timeframes    : All (M1 to MN) Version       : 1.21 Signal bar    : last closed cand
DUAL ENGULFING PRO MT5 Retail + Institutional Candle Signals with 16 Smart Filters Professional Price-Action Signal Indicator for MetaTrader 5 Dual Engulfing Engine • Multi-Filter Confirmation • Real-Time Alerts Find high-quality engulfing reversals the way retail traders see them — and the way institutions prefer them. Dual Engulfing Pro MT5 plots two independent arrow systems on the chart, then lets you confirm every signal with up to 16 optional filters: tren
Fractal Breakout Pro MT5 Dual Wick and Body Signals with 17 Confirmation Filters Custom MetaTrader 5 indicator for confirmed fractal breakouts. It plots wick and body arrows, optional active level lines, and alerts by popup, sound, push, and email. Filters are optional and combined with AND logic. PRODUCT TYPE Type: Custom technical indicator (not an Expert Advisor) Platform: MetaTrader 5 Window: Chart window Plots: 4 arrows (Buy Wick, Sell Wick, Buy Body, Sell Body) Version: 1.34 Use: Manual
Non-Repaint Heiken Ashi No-Wick Signal MT5 | Multi-Filter Buy Sell Arrows + Alerts ===== PRODUCT TYPE ===== Product Category : Technical Indicator Platform : MetaTrader 5 (MT5) Window : Chart Window (overlay) Version : 3.17 Code Name : HA Signal v3.17 MultiFilter Author : FAZA A N Signal Style : Buy and Sell arrows on closed Heiken Ashi candles Repaint Status : Non-repaint. Signals are drawn only on already closed bars. Alerts : Terminal popup, sound, push notification, email Filters : 16 opti
Heiken Ashi Pro Signals MT5 Color-Change Buy/Sell Arrows + Ichimoku Senkou Span B + Multi Filters + Alerts Heiken Ashi signal indicator for MetaTrader 5. It finds a bullish or bearish HA color change on a closed bar, then prints a Buy or Sell arrow only if the filters you enabled all agree. Optional Ichimoku Senkou Span B line (Sienna), Parabolic SAR, trend, momentum, oscillator, support/resistance, and Fibonacci filters. Popup, sound, push, and email alerts are included. Works on Forex, gold,
HULL CROSSOVER ARROWS MULTI FILTER MT5 Non-Repaint Buy / Sell Signals + Modular Filters Hull Crossover Arrows Multi Filter MT5 Hull Trend Signal Arrows Smart Filter PRODUCT TYPE Platform      : MetaTrader 5 Product Type  : Indicator Program Type  : Custom Indicator Window        : Chart Window Plots         : Buy Arrow + Sell Arrow + Hull Line Core Logic    : Price crossover of Hull Moving Average Repaint Policy: Arrows confir
MA10 HL MultiFilter No-Repaint | EMA High-Low Cross Buy Sell Arrows MT5 Professional no-repaint buy and sell arrow indicator for MetaTrader 5. The entry is an EMA High and EMA Low crossover. After the cross, a modular multi-filter engine can confirm or block the setup. The result is a closed-bar arrow with optional popup, sound, and push notification. Built for traders who want a High/Low breakout trigger instead of a generic close-price MA cross, with full control over confirmation instead o
MA CROS KU v3.52 - No-Repaint Multi-Filter MA Crossover Buy/Sell Signals with Ichimoku Shift-26 and Alerts (MT5) No-repaint Fast/Slow MA crossover for MetaTrader 5. Optional confirmation: Trend MA, Ichimoku Senkou Span B (shift 26 fixed), RSI, ADX, Single MA, RSI75, Double MA, Awesome Oscillator, Parabolic SAR, Heiken Ashi, CCI, RVI, MACD, Support/Resistance and Fibonacci. Popup, sound, push and email alerts fire only on the last closed bar. ================ PRODUCT TYPE ================ Type:
MA Cross Scanner MT5 | Multi Pair Multi Timeframe Dashboard with No-Repaint Signals PRODUCT TYPE Platform: MetaTrader 5 Category: Technical Indicator Display: Chart-window overlay and on-chart dashboard Version documented: 1.12 Role: Manual screening tool Markets: Forex pairs, metals such as XAUUSD, and any Market Watch symbol Timeframes: Any MT5 period you list from M1 to MN1 This product does not open, close, or manage orders. It finds completed Fast/Slow m
MACD Zero Cross Multi Filter Signals MACD Zero Cross Pro | Level 0 Signals + Multi Filters | No Repaint for MT5 MACD Zero Cross Pro is a MetaTrader 5 oscillator and signal tool built around a classic MACD histogram. It marks BUY and SELL only when the MACD main line crosses the zero level on a closed bar, then checks optional confirmation filters before drawing an arrow or sending an alert. This is not an Expert Advisor. It does n
MACD Histogram Signal Multi Filter with Arrows and Alerts PRODUCT TYPE Product type : Technical Indicator Platform : MetaTrader 5 Category : Oscillators / Signal Indicators Display : Separate MACD window + buy/sell arrows on the price chart Markets : Forex, Gold, Indices, Crypto, Stocks, Commodities Timeframes : All (M1 to MN1) Does it trade: No. This indicator does not open, close, or manage orders. This MetaTrader 5 indicator turns a MACD line crossover into a
MOMENTUM KU PRO MT5 No-Repaint Momentum Cross 100 • Multi-Filter Buy & Sell Signals MT5 Chart Indicator • Closed-Bar Arrows • Alert • Sound • Push Momentum • RSI • ADX • MA • Ichimoku • AO • SAR • Heiken Ashi • CCI • RVI • MACD • S/R • Fibonacci PRODUCT TYPE Type : Technical Indicator for MetaTrader 5 Display : Chart window Buy / Sell arrows Core signal : Momentum cross of the 100 level Repaint rule : No arrow on the still-forming bar Platform : MetaTrader
NLMS Adaptive Volatility Trail Pro | No-Repaint Multi-Filter Buy & Sell Signals MT5 Adaptive NLMS trailing line + ATR volatility bands + 18 optional confirmation filters. Closed-bar arrows only. Alerts, push notifications, and custom sounds included. PRODUCT TYPE • Platform        : MetaTrader 5 • Type            : Technical Indicator (chart window) • Category        : Trend / Trailing Stop / Buy-Sell Signals / Multi-Filter • Version         : 1.28 — Stri
PARABOLIC RSI MULTIFILTER SIGNAL NR Non-Repaint Buy Sell Indicator for MetaTrader 5 PRODUCT TYPE Type        : Technical Indicator Platform    : MetaTrader 5 Category    : Oscillators / Trading Signals Version     : 2.11 Signal Mode : Closed-candle confirmation (no repaint) Markets     : Forex, Gold, Indices, Crypto, Stocks, CFD Timeframes  : All (M15, H1, H4, D1 recommended) Display     : RSI window + arrows on the main chart SHORT DESCRIPTI
PARABOLIC RSI SCANNER DASHBOARD MT5 No-Repaint Multi-Pair Multi-Timeframe Momentum Reversal Scanner PRODUCT TYPE Platform : MetaTrader 5 Category : Technical Indicator Mode : Chart overlay panel, manual decision tool This is not an Expert Advisor. It does not open, close, or manage orders. Scans many symbols and timeframes from one chart. Parabolic SAR is applied to RSI, then the latest closed-bar SAR-on-RSI reversal is listed. Filters, alerts, sorting, chart
PARABOLIC SAR FLIP SIGNAL MULTI FILTER No-Repaint Buy and Sell Entry Arrows for MetaTrader 5 MetaTrader 5 chart indicator that plots Parabolic SAR dots and prints a Buy or Sell arrow only after a confirmed SAR flip on a closed candle, and only if the filters you enabled also agree. This product is an entry-signal indicator. It does not open, close, or manage orders.
MULTI CANDLE PATTERN MULTI FILTER SIGNALS No-Repaint Buy and Sell Arrows for MetaTrader 5 PRODUCT TYPE Type            : Technical Indicator Platform        : MetaTrader 5 Display         : Chart window arrows Markets         : Forex, Gold, Indices, Crypto, Stocks, Oil Timeframes      : All timeframes (M1 to MN) Signals         : BUY and SELL arrows after candle close Repaint         : No. Forming candle stays empty Version logic   : Multi candle pattern + opt
RSI Dual Crossover Scanner Dashboard MT5 Multi-Pair Multi-TF RSI I / RSI II Signals + 17 Filters + Alerts Scan many pairs and timeframes from one panel. Catch the latest Fast RSI vs Slow RSI crossover, confirm it with optional filters, get alerts, and open the signal chart in one click. A professional RSI crossover radar — without opening 20 charts. PRODUCT TYPE
RSI Dynamic Line + Multi Filters - Professional MQL5 Trading Indicator RSI Dynamic Line + Multi Filters Professional MQL5 Trading Indicator | Trend Reversal & Momentum Signals with 15 Powerful Filters PRODUCT TYPE Multi-Indicator Expert MQL5 for MT4/MT5 • Entry Signals (RSI Cross) + 15 Powerful Filters • Professional Trading Tool • Trend Reversal & Momentum Signals with Alerts KEY FEATURES RSI Dynamic Line (Entry Signal) Fa
ULTIMATE RSI PRO X-TREME: MULTI-FILTER REVERSAL SYSTEM MT5 Welcome to the most advanced, highly customizable, and powerful RSI-based indicator available on the MQL5 Market! The "Ultimate RSI Pro X-Treme" (RSI TVKU) is not just another standard Relative Strength Index indicator. It is a complete, all-in-one trading system designed for serious tr
フィルタ:
レビューなし
レビューに返信