QuantMatrix Prism Structure

  • インディケータ
  • Rafael Barreto Haddad
    Rafael Barreto Haddad
    • Rafael Haddad → QuantMatrix → quantitative trading research において  Quantitative Trading Systems Researcher
    • ブラジル
    • 1754
    クオンツ・トレーディングシステム研究者 | QuantMatrix Research Series 開発者 | MetaTrader 5
    MetaTrader 5向け QuantMatrix Research Series の開発者です。
    過去の市場データ、戦略検証、継続的なモデル評価を基盤として、定量的トレーディングシステム、適応型Expert Advisor、マーケット分析ツールを開発しています。
  • バージョン: 1.1
  • アクティベーション: 5
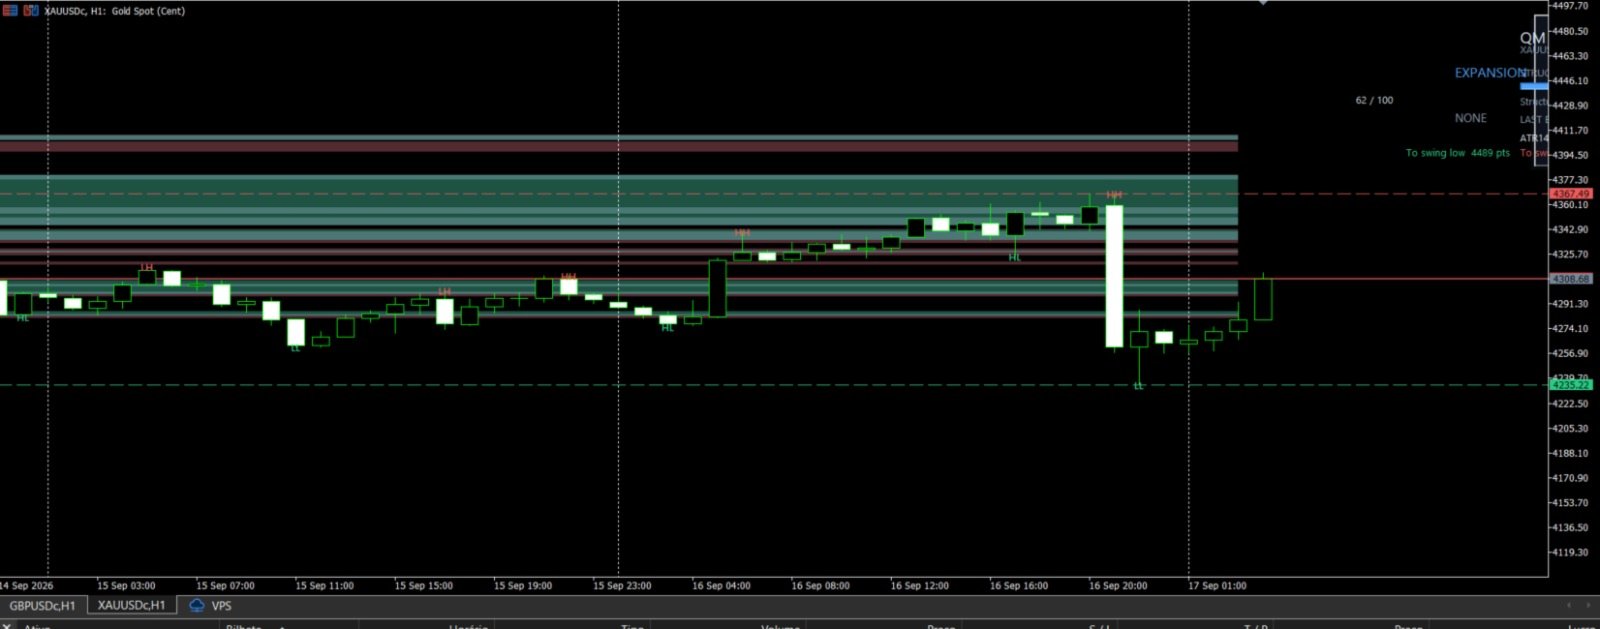
QuantMatrix Prism Structure is a MetaTrader 5 indicator for visual analysis of market structure.

It identifies confirmed swing highs and swing lows and displays structural information directly on the chart.

The indicator can display higher highs, higher lows, lower highs, lower lows, structure changes, fair value gap areas and ATR based information.

A chart panel summarizes the current structure state, recent structural events and relevant market information.

The indicator is intended for market analysis and does not open, modify or close trades.


QuantMatrix Prism Structure is a MetaTrader 5 indicator for market structure analysis.


It identifies confirmed swing highs and swing lows and displays structural information on the chart.


The indicator shows market structure, structural changes, fair value gap areas and ATR based information.


It is an analytical tool and does not open, modify or close trades.
おすすめのプロダクト
VolProfile PRO
Paulo Henrique Faquineli Garcia
For those who need a Volume Profile / Market Profile indicator, here is the solution! It contains the essential information: Control Point (POC); Higher Value Area (VAH); Lower Value Area (VAL); You can choose to SHOW or NOT SHOW the volume Histogram, according to your wish. If you choose to show the histogram, note that according to the type of asset, it is necessary to adjust the scale of the indicator (last parameter of the indicator). You can also choose from the data source of your hist
Indicador de Volume
Devscode Desenvolvimento de Softwares LTDA
4.5 (2)
This indicator is a volume indicator it changes the color of the candles according to a certain number of ticks, and this number of ticks can be informed by the user both the number of ticks and the color of the candles, this indicator works in any graphical time or any asset, provided that the asset has a ticker number to be informed. This indicator seeks to facilitate user viewing when analyzing candles with a certain number of ticks.
FREE
Volume profile CVD Frato
Francisco Felipe Alves Da Silva Rocha
5 (2)
Frato Volume Profile Pro v7.5 Frato Academy開発 このインジケーターは、MetaTrader 5用の価格ボリュームプロファイルを表示します。設定可能な期間における価格レベルごとの取引量の分布を計算し、その結果をメインチャートに直接表示します。 特徴: カラーグラデーションによるボリュームプロファイル このインジケーターは、価格帯を複数のレベルに分割し、各レベルに対応するボリュームを割り当てます。各レベルの色は、ボリュームに応じて連続的なグラデーションで変化します。ボリュームの少ないレベルは寒色系(濃い青)、ボリュームの多いレベルは暖色系(黄色)で表示されます。最もボリュームの多いレベルは、ポイント・オブ・コントロール(POC)と呼ばれ、視覚的に強調表示されます。 参照線:POC、VAH、VAL このインジケーターは、以下の3本の水平線を自動的にプロットします。 - POC(ポイント・オブ・コントロール):最高出来高レベル - VAH(バリューエリア高値):バリューエリアの上限 - VAL(バリューエリア安値):バリューエリアの下限
FREE
Simple Dispersion Zones(シンプル・ディスパージョン・ゾーンズ) は、トレーダーの日々のマーケット分析をサポートするために設計された、シンプルで使いやすく、かつ強力なインジケーターです。 直近の N 本のローソク足の高値と安値をもとに、重要なディスパージョン(分散)ゾーンを計算し、透明な赤い三角形でチャート上に表示します。これにより、重要なトレードエリアを素早く視覚的に把握できます。 トレンドチャネルの描画、レンジ相場の特定、ブレイクアウト戦略の計画など、あらゆる場面で価格の動きを明確かつ効果的に視覚化するのに役立ちます。 シンプルで直感的なインターフェース カスタマイズ可能なパラメーター すべての銘柄・時間足に対応 初心者から上級トレーダーまで幅広く対応 Simple Dispersion Zones を使って、チャート分析をより簡単かつ正確にしましょう。
Moving Ratio
Ricardo Rodrigues Lucca
"Moving Ratio Candle" is used to check the distance of a candle to a theoretical pressure point. Furthermore, we have two points of interest, the first for the mean and the second for the median. This indicator uses the shape of bars and the line that crosses the bar from left to right is based on the calculation of the closing price for both sides. The rest follows a more standard calculation. The same could be done as a line, but I want to know the behavior of this indicator in relation to the
FREE
Stop guessing your lot size. Risk the same amount on every trade. Most traders blow accounts not because of bad entries, but because of inconsistent position sizing: fixed lots with variable stops means every trade risks a different — and unknown — amount of money. TrendSync Risk Calculator solves this in one drag. How it works Attach the indicator. It automatically anchors three draggable lines at the current price: Entry , SL at N×ATR and TP at your chosen R:R . Drag any line — or type a new A
FREE
Proton Candle Time MT5 OVERVIEW Proton Candle Time MT5 is an indicator for MetaTrader 5 that displays a real-time countdown timer showing the number of seconds remaining in the current candle. The indicator updates continuously as the candle develops and resets when a new candle opens. This tool is designed for traders who need precise timing information while analyzing price action. PRIMARY FUNCTION The indicator displays the active candle countdown timer directly on the chart. The timer show
FREE
VWAP Indicator, the short form of Volume Weighted Average Price, is similar to a moving average but takes into consideration the tick volume of the candles. The indicator calculates the moving average multiplying the price of each candle for the tick volume in the candle. Said calculation weighs with more significance price where more transactions were made. Features: Visual styling customizable Period customizable Ease of use
FREE
Renko bricks drawn as time-anchored boxes on your ordinary chart, so brick structure and real time stay visible together. A renko brick prints when price moves a set distance, ignoring how long that takes. That strips out the sideways noise a time chart is full of. The usual way to see them is a separate offline chart, which loses the clock. This draws the same bricks over your normal candles instead, so you keep the time axis, your other indicators, and your orders. How the bricks are built Onl
FREE
High Low Open Close
Alexandre Borela
4.98 (45)
このプロジェクトが好きなら、5つ星レビューを残してください。 このインジケータは、指定されたためのオープン、ハイ、ロー、クローズ価格を描画します 特定のタイムゾーンの期間と調整が可能です。 これらは、多くの機関や専門家によって見られた重要なレベルです トレーダーは、彼らがより多くのかもしれない場所を知るために有用であり、 アクティブ。 利用可能な期間は次のとおりです。 前の日。 前週。 前の月。 前の四半期。 前年。 または: 現在の日。 現在の週。 現在の月。 現在の四半期。 現年。
FREE
Descrição Este Expert Advisor (EA) implementa uma estratégia baseada na divergência de preços entre o mini dólar (WDO$N) e o dólar cheio (DOL$N). Ele monitora, segundos antes da abertura do mercado ou ao longo do dia (conforme o modo escolhido), possíveis discrepâncias entre esses dois ativos e efetua ordens no mini dólar, apostando na convergência futura. Principais Recursos Divergência Mínima Configurável: A estratégia utiliza um parâmetro de divergência mínima de 10 pontos, ajustável de acor
FREE
Heiken Ashi Stacked Pro is a chart overlay indicator that combines smooth Heiken Ashi visual trend candles, a real-time bar completion timer, and an on-hover crosshair HUD for instant price and wick-to-body ratio diagnostics. Marketplace Description Overview Heiken Ashi Stacked Pro upgrades standard Heiken Ashi candle visuals with an interactive HUD. Designed for trend followers and price action traders, it filters out market noise using colored candles while supplying precise candle metric read
Value Chart Candlesticks
Flavio Javier Jarabeck
4.57 (14)
The idea of a Value Chart indicator was presented in the very good book I read back in 2020 , " Dynamic Trading Indicators: Winning with Value Charts and Price Action Profile ", from the authors Mark Helweg and David Stendahl. The idea is simple and the result is pure genius: Present candlestick Price analysis in a detrended way! HOW TO READ THIS INDICATOR Look for Overbought and Oversold levels. Of course, you will need to test the settings a lot to find the "correct" one for your approach. It
FREE
Test Phi Cubic
Genildo De Moura Vasconcelos
Numa folha qualquer Eu desenho um sol amarelo E com cinco ou seis retas É fácil fazer um castelo Corro o lápis em torno da mão e me dou uma luva E se faço chover com dois riscos, tenho um guarda-chuva Se um pinguinho de tinta Cai num pedacinho azul do papel Num instante imagino uma linda gaivota a voar no céu Vai voando, contornando A imensa curva norte-sul Vou com ela viajando Havai, Pequim ou Istambul Pinto um barco à vela Branco navegando É tanto céu e mar num beijo azul Entre as nuvens vem
FREE
Here   our more valuable tools SMC Trend Trading   ,  Easy SMC Trading  ,  Institutional SMC Architect Volume Analysis Tools  ,  Volume flow Profile  ,  Market volume profile  , FVG with Volume  , Liquidity Heatmap Profile  ,  Volume Spread Analysis A professional spike pattern indicator built for synthetic traders who scalp and swing Crash 500/300/1000 with precision.  This indicator: Detects powerful 3-candle spike formations (Spike → Pullback → Spike) Automatically draws a clean box a
FREE
Midas VWAP
Paulo Henrique Faquineli Garcia
4 (2)
Volume Weighted Average Price (VWAP) is a trading benchmark commonly used by Big Players that gives the average price a Symbol has traded throughout the day. It is based on both Volume and price. This indicator contains Daily VWAP and MIDAS' VWAP, which means you are able to anchor the beggining of MIDAS' calculations and, therefore you will be able to use this methodology to study price versus volume moves after anchor point. You will be able to anchor up to 3 HIGH MIDAS VWAP's and 3 LOW. Wish
FREE
VolumaxProfile
Alexandre Vincent Traber
概要 VolumaxProfil eは、選択した期間の各価格レベルでの出来高集中箇所をチャート上に直接表示する、本 格的なボリュームプロファイルです。ポイントオブコントロール(POC)とバリューエ リア(VAH/VAL)を自動的に強調表示します。 仕組み 直近N本(Lookback_Bars)のバーをスキャンし、価格レンジを行に分割 各バーの出来高を、触れた価格レベルに分配 出来高に比例した水平ヒストグラムを各行に描画 POC(出来高最大の行)を特定し、設定割合をカバーするバリューエリアを計算 新しいバーごとに自動再構築 入力パラメータ Lookback_Bars: プロファイル構築に使用するバー数 Row_Count: 価格行の数 Value_Area_Pct: バリューエリアがカバーする出来高の割合 Max_Bar_Width_Px: ヒストグラムの最大幅 Show_POC: POCラインの表示 Show_Value_Area: VAH/VALラインの表示 Use_Tick_Volume: ティック出来高か実出来高か Color_Profile: ヒストグラムの色 Color_
FREE
White Weis Volume This indicator shows the sum of the volume in each wave, bulish or bearish, as idealized by David Weis , but it brings an important addition , which is the marking of the bar with the highest volume of the wave (White Bar)! In coding the indicator, it was sought to optimize the code to require minimal processing during use and not to overload mt5. The indicator can be used for pre-trading analysis and study, where the trader analyzes possible points of support and resistance
Gm Volumes
Antonio Augusto Barreto De Melo
4 (3)
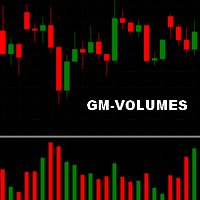
A simple volume indicator according to the color of the candle! - Custom background! - Supports Volume by Ticks or Real Volume. The original Metatrader Volume indicator does not show the colors of the bar according to the color of the Candle, it only changes color when the volume of a candle is greater than the previous one, this sometimes creates confusion for beginners and does not know the real reason for the color change. Free indicator, support may take a while to respond!
FREE
FiveStarFX Gold Reversal Edge Professional automated trading solution designed for structured execution and controlled risk management in the Gold market. Built for traders who value discipline, precision, and consistency. Key Features Fully automated trading One trade at a time (controlled exposure) Fixed Stop Loss and Take Profit Smart Break-Even protection Profit lock with buffer Step-based trailing management Spread protection system Works on any broker Trade Management The E
FREE
RBM Smc
Renato Brendim Medici
RBM SMC Liquidity Hunter MT5 — Institutional Structure and Liquidity Indicator   The RBM SMC Liquidity Hunter is a professional tool developed to map Smart Money Concepts (SMC) dynamics directly on your charts. The indicator tracks market structure breaks, validates supply and demand zones using price displacement, and detects liquidity sweeps confirmed by volume, integrating all confluences into an executive on-chart dashboard.   Key Features  Market Structure Mapping (BOS / CHoCH): Automatic
FREE
top finder, bottom finder, market structure, price action, trend reversal, trend continuation, support resistance, swing high, swing low, frequency analysis, price projection, breakout detection, pullback trading, swing trading, market turning points EXPERIMENTAL VERSION – UNDER ACTIVE DEVELOPMENT Smart Top Bottom Finder is a market structure and frequency analysis indicator designed to identify potential tops and bottoms based on recurring price movement patterns. The indicator does not rely
FREE
Expansoes M
Marcus Vinicius Da Silva Miranda
The M Extensions are variations of the Golden Ratio (Fibonacci Sequence). It is the World's first technique developed for Candle Projections. Advantages: Easy to plot. Candle anchoring; High and accurate precision as support and resistance; Excellent Risk x Return ratio; Works in any timeframe; Works in any asset / market.   The M Extensions are classified into: M0: Zero point (starting candle) RC: Initial candle control region M1: Extension region 1 M2: Extension region 2 M3: Extension regi
FREE
Aggression Volume Profile
Edson Cavalca Junior
4.55 (11)
This indicator plots the volume profile by Price on the chart There are 5 ways to view it: By Total Volume Traded (Premium Version); Volume Ticks(Forex) Separated by Buyers and Sellers (Premium Version); Buyers Only (Premium Version); Sellers Only (Premium Version); Business balance (Buyers - Sellers) (Premium Version); . It is possible to select how many days the profiles will be calculated.( Premium Version) On the current day it recalculates the histogram data for each new candlestick.
FREE
AvgVolumes
Marco Montemari
5 (1)
This indicator is based on Volumes standard indicator, calculates the average of Volumes based on the last N bars set by users, and if the value of the volume is bigger then a set % respect the average a different color will be used. The indicator is shown in a separate indicator window. This version has now a limitation in setting the % about the threshold. If you are interested to set threshold consider to buy the PRO version ( https://www.mql5.com/en/market/product/35925 ) If you want to use
FREE
VP hidden
Emr Aljnaby
4.33 (12)
The indicator works to convert normal volume into levels and determine financial liquidity control points. It is very similar in function to Fixed Volume Profile. But it is considered more accurate and easier to use than the one found on Trading View because it calculates the full trading volumes in each candle and in all the brokers present in MetaTrade, unlike what is found in Trading View, as it only measures the broker’s displayed prices. To follow us on social media platforms: telegram
FREE
Order Book, known also as Market Book, market depth, Level 2, - is a dynamically updated table with current volumes of orders to buy and to sell specific financial instument at price levels near Bid and Ask. MetaTrader 5 provides the means for receiving market book from your broker, but in real time only, without access to its history. The indicator OrderBook Cumulative Indicator accumulates market book data online and visualizes them on the chart. In addition, the indicator can show the market
Waves Sizer
Flavio Javier Jarabeck
3.86 (7)
Wyckoff fans, enjoy! Ideally to be used with the Weis Waves indicator, but it can be easily used alone, the Waves Sizer puts the range (in resulting Price movement) done by the Price on its market swings. You can control how accurate or loose will be the swings. This tool is very helpful for visually know how much the Price has traveled in your Timeframe. This way you can confront this level of effort with the resulting Volume, etc... Weis Waves indicator: https://www.mql5.com/en/market/produc
FREE
ST Flow Context: The Professional Trader’s Compass ST Flow Context is a macro analysis tool developed to identify the predominant direction of institutional money. It filters out intraday noise and delivers the real market context, helping the trader never to trade against the main tide. Key Features: Trend Alignment: Identifies whether the daily flow is bullish or bearish based on multiple timeframes. Interest Zones: Maps where institutional volume is defending positions. Entry Filter: Use Flow
FREE
Bar Countdown
Mario Antonio Oliveira
4.9 (10)
Bar Countdown is a simple indicator for MetaTrader 5 that shows the time remaining of the each candle. It can be placed in any corner of the chart or near of the price close and it'll help you to know if the current candle is ending. Choose the counter format between HR:MIN:SEC and MIN:SEC It is so easy to use, configure the color, size and counter position on the chart and that's it!!! The Countdown starts now! Updates: 2021/02/28; v1.0: Initial release 2021/03/16; v1.1: Minor code changes   
FREE
このプロダクトを購入した人は以下も購入しています
SMART TREND TRADING SYSTEM — 特別オファー トレードシステム、自動化EA、学習コンテンツとサポートをひとつに。 MT5用のSmart Trend Trading Systemを99米ドルでご購入いただくと、シグナルの自動売買に使える Smart Universal Expert Advisorを無料でプレゼント します。 STTSは、トレンドの方向、エントリー・決済シグナル、反転ゾーン、重要な価格水準をチャート上にまとめて表示します。システムを参考に手動で取引することも、付属のEAを接続し、ご自身で選んだ設定に基づいて自動売買することもできます。 現在の99米ドルという価格は、これからの30件の購入に適用されます。その後、価格は149米ドルに上がります。 充実のパッケージ内容 ご購入には以下が含まれます。 • MT5用Smart Trend Trading System。 • Smart Universal Expert Advisor — 無料。 • STTSの完全版PDFユーザーマニュアル。 • STTS公式オンラインコース。 • インストールと
Trend Sniper X
Sarvarbek Abduvoxobov
4.89 (38)
Trend Sniper X は、トレードの方向性と潜在的な反転ポイントを明確かつ正確に特定するのに役立つ、MetaTrader 5 用のマルチタイムフレーム・トレンドフォロー指標です。 MT4用: https://www.mql5.com/en/market/product/193245 価格情報: 現在の価格はプロモーション価格であり、今後のアップデートや新機能のリリースに伴い変更される場合があります。 ボーナス特典: このインジケーター用の無料自動売買アシスタントEAを入手するには、購入後に an 著者(開発者)へメッセージをお送りください。 Code2Profit チャンネル マルチタイムフレーム分析で相場をマスターしよう! Trend Sniper X で勝率を最大化する方法:重要なルールとセッションのコツ 技術仕様 プラットフォーム MetaTrader 5 インジケータータイプ マルチタイムフレーム・トレンドインジケーター 操作タイムフレーム あらゆるチャートタイムフレームに対応。個別に選択可能な上位タイムフレーム (M1–MN1) を搭載 主要銘柄 FX、ゴールド (X
UNIX SCALPER — 特別オファー セットアップを見つけ、取引プランを確認し、取引方法を選ぶ。 MT5用UNIX Scalperを99米ドルで購入すると、シグナルを自動売買に活用できるSmart Universal Expert Advisorが無料で付属します。 UNIX Scalperは、市場分析、BUY/SELL/WAITの判断、Entry、Stop Loss、TP1、TP2の水準を、見やすいパネルにまとめています。取引プランに沿って手動で取引することも、付属のEAを接続し、ご自身の設定に従って自動執行することもできます。 現在の99米ドルの価格は、今後30件の購入に適用されます。その後、価格は149米ドルになります。 パッケージの内容 ご購入には以下が含まれます。 • MT5用UNIX Scalper。 • Smart Universal Expert Advisor — 無料。 • UNIX Scalperの完全版PDFユーザーマニュアル。 • UNIX Scalper公式オンラインコース。 • インストールと設定の手順ガイド。 • 購入者限定コミュニティへ
まず正直に言いましょう。 どんなインジケーターも、それ単体であなたを利益化させることはできません。もしそう言う人がいるなら、それは夢を売っているだけです。完璧な売買シグナル(矢印)を表示するインジケーターは、いくらでも“完璧に見せる”ことができます。正しい過去の区間を拡大して、勝ちトレードだけを切り取ればいいだけです。私たちはそれをしません。 SMC Intraday Formula はツールです。 市場構造を読み取り、最も高い確率の価格ゾーンを特定し、今この瞬間のスマートマネーの痕跡をシンプルな言葉で正確に示します。最終判断はあなたが行います。トレードを実行するのもあなたです。しかし今は「希望」ではなく「精度」でエントリーできます。 私たちはこのインジケーターを、ゴールド(XAUUSD)および主要FX通貨ペアで約3年間、日々のスキャルピングに使用してきました。M1、M5、M15、M30の主要ツールです。これは未来を予測しようとするのではなく、今まさに形成されている高確率セットアップを示し、その理由を説明します。 他のすべてのインジケーターと何が違うのか? ほとんどのトレーディングイ
SuperScalp Pro
Van Minh Nguyen
4.65 (34)
SuperScalp Pro - Professional Multi-Layer Confluence Scalping System SuperScalp Proは、クラシックなSupertrendに複数のインテリジェントな確認フィルターを追加した、高度なスキャルピングインジケーターです。より高い確率が期待できるBuy/Sellの取引機会を特定し、ダマシのシグナルを大幅に減らすことをサポートします。 明確なBuyとSellの矢印がチャート上に直接表示され、ATRに基づくStop LossとTake Profitのレベルがリアルタイムで自動計算されます。 購入後、設定方法や推奨設定についてのサポートが必要な場合は、私にご連絡ください。 SuperScalp Pro Auto Traderを使用して、シグナルを簡単に自動化できます: [Auto Trader] 推奨設定ファイルをダウンロード: [Set File] 完全なドキュメントは製品ブログでご覧いただけます: [User Guide] 最新情報を受け取るには公式チャンネルに参加してください: [Official Channel]
Reversion King Indicator
Eugen-alexandru Zibileanu
5 (8)
新たな王者が登場 - インジケーター + 注文管理表示(TP1 + TP2 + TP3)+ オプションのTelegramシグナル送信機能付き(無料) (完全なトレード&シグナルシステム) ゴールド向け最高のEA: Gold Slayer このインジケーターには、高度な戦略、カスタマイズ可能な注文管理システム、そしてエンベロープ拡張を組み合わせた平均回帰システムが搭載されています。さらに、RSIなど複数のインテリジェントな確認フィルターによって、高確率の反転エントリーをBUY・SELLシグナルとして検出します。 単にトレードを学ぶだけでなく、複数ポジションを効果的に管理し、過去に利益を出しているオープンポジションで損失トレードをカバーする方法も学べます。 M5向けに構築・最適化されており、流動性が高くシグナルの精度が安定しているBTCUSDとXAUUSDで優れたパフォーマンスを発揮します。 このインジケーターは、ATRを基に自動計算されたエントリー、ストップロス、テイクプロフィットレベルを備えた明確なLong・Shortシグナルを提供するため、リスク管理が最初から組み込まれています。 マ
Neuro Poseidon is a new indicator by Daria Rezueva. It combines precise trading signals with adaptive TP/SL levels - creating best possible trades as a result! Message me and get  Neuro Poseidon Assistant  as a gift to automize your trading process! What makes it stand out? 1. Proven profitability on all assets and timeframes 2. Only confirmed BUY and SELL signals present on the chart 3. Adaptive TP & SL levels generated by the software for each trade 4. Easy to understand - suitable for al
伝説が帰ってきました:Entry Points Pro 10。 MQL5 Marketのトップ3に3年間入り続けた伝説的インジケーターの再始動です。 2つのバージョンで合計589件の高評価レビュー、毎日数千人のトレーダーが実際のトレードに使用し、デモのダウンロードは31,000件以上   MT4+MT5 。 私はこの5年間に寄せられたレビューをすべて読み、約束を並べる代わりに、その答えをバージョン10に組み込みました。1999年から相場に携わり、 誠実さ、自らの評判、そして顧客を大切にする 作者による製品です。 Entry Points Proのエントリーシグナルは、リペイント(再描画)を一切行いません。 そして今回初めて、これは作者の言葉ではなく検証可能な事実になりました。確定シグナルはローソク足の終値確定後にのみ表示され、自動テストで リペイントはゼロ と確認されています(EURUSD、XAUUSD、BTCUSDで2,486,568回の不変条件チェック、違反0件)。検証方法は公開されており、ストラテジーテスターでご自身で再現できます。 ご購入後は、必ずすぐにダイレクトメッセージでご
Welcome to ENTRY IN THE ZONE AND SMC MULTI TIMEFRAME Entry In The Zone and SMC Multi Timeframe is a real-time market analysis tool based on Smart Money Concepts (SMC), designed to analyze market structure, price direction, and key trading zones. It supports both Single-Timeframe Analysis and Multi-Timeframe Analysis, providing a clearer view of the overall market structure across multiple timeframes, with real-time BUY / SELL signals that do not repaint. It is designed to help filter trading opp
このインジケーターを購入された方には、以下の特典を 無料 で提供しています: 各トレードを自動で管理し、ストップロスとテイクプロフィットを設定し、戦略ルールに基づいてポジションを決済する補助ツール 「Bomber Utility」 様々な銘柄に合わせたインジケーターの設定ファイル(セットファイル) 「最小リスク」、「バランスリスク」、「待機戦略」 の3つのモードで使用できる Bomber Utility 用の設定ファイル このトレーディング戦略をすぐに導入・設定・開始できる ステップバイステップのビデオマニュアル ご注意: 上記の特典を受け取るには、MQL5のプライベートメッセージシステムを通じて販売者にご連絡ください。 オリジナルのカスタムインジケーター 「Divergence Bomber(ダイバージェンス・ボンバー)」 をご紹介します。これは、MACDのダイバージェンス(乖離)戦略に基づいた 「オールインワン」型のトレーディングシステム です。 このテクニカルインジケーターの主な目的は、価格とMACDインジケーターの間に発生するダイバージェンスを検出 し、将来の価格の動きを示
Gann Made Easy   は、ミスター・ギャンの理論を使用した取引の最良の原則に基づいた、プロフェッショナルで使いやすい外国為替取引システムです。 W・D・ガン。このインジケーターは、ストップロスとテイクプロフィットレベルを含む正確な買いと売りのシグナルを提供します。 PUSH通知を利用して外出先でも取引可能です。 ご購入後、取引方法の説明と優れた追加インジケーターを無料で入手するには、私にご連絡ください! おそらく、ギャンの取引手法についてはすでに何度も聞いたことがあるでしょう。通常、ギャンの理論は初心者のトレーダーだけでなく、すでにある程度の取引経験がある人にとっても非常に複雑なものです。なぜなら、ギャンの取引手法は理論的にはそれほど簡単に適用できるものではないからです。私はその知識を磨き、最良の原則を私の外国為替インジケーターに組み込むために数年を費やしました。 このインジケーターは非常に簡単に適用できます。必要なのは、それをチャートに添付し、簡単な取引推奨事項に従うだけです。このインジケーターは常に市場分析の仕事を行い、取引の機会を探します。適切なエントリーポイントを検
FiboSniper Pro – Multi-Filter Fibonacci System with Auto SL/TP and Control Panel FiboSniper Proは、動的なFibonacci Envelopesと複数の確認フィルターを組み合わせ、選別されたBuyおよびSellシグナルを生成するテクニカルインジケーターです。FibonacciレベルはMoving AverageとATRを基に計算され、その後ADX、EMA、RSI、ATR、Volume、Time、Candle構造によってフィルタリングされます。インジケーターは、ATRに基づく自動Stop LossおよびTake Profitレベルをチャート上に直接表示し、さらに迅速な調整が可能なインタラクティブControl Panelを提供します。 購入後、推奨設定ファイルと詳細な使用方法については、私にご連絡ください。 Auto Trader Xを使用してFiboSniper Proのシグナルを自動化できます: [Auto Trader X] User GuideとSet Files: [Click her
Power Candles V3 - 自己最適化型強弱インジケーター Power Candles V3は 、通貨や銘柄の強さを、適用されたすべてのチャート上で実行可能なトレードプランに変換します。単にローソク足を色分けするだけでなく、バックグラウンドでリアルタイムの自動最適化を実行し、目の前の銘柄に対して最適なストップロス、テイクプロフィット、およびシグナルの閾値を提示します。ワンクリックで実取引に適用でき、エントリーポイント、ストップロス、テイクプロフィットのラインが正確な価格位置にチャート上に表示され、方向性を示すアラートがリアルタイムで発動します。 このツールは、Stein Investmentsのエコシステムの一部です。  18種類以上のツールをすべて閲覧し、AIを活用したセットアップの推奨事項を入手し、  https://stein.investments でコミュニティに参加しましょう クローズしたバーごとに3,000回以上のトレードシミュレーション。9つの強さの状態。2つの戦略を並行してテスト。勝率の高い設定をワンクリックで適用。 なぜこれが必要なのか ほとんどの強
ATOMIC ANALYST — 特別オファー 市場分析、自動化EA、学習コンテンツとサポートをひとつに。 MT5用のAtomic Analystを99米ドルでご購入いただくと、シグナルの自動売買に使える Smart Universal Expert Advisorを無料でプレゼント します。 Atomic Analystは、プライスアクション、トレンドの方向、エントリー・決済シグナル、損切り水準、複数の利確水準をチャート上にまとめて表示します。分析を参考に手動で取引することも、付属のEAを接続し、ご自身で選んだ設定に基づいて自動売買することもできます。 現在の99米ドルという価格は、これからの30件の購入に適用されます。その後、価格は149米ドルに上がります。 充実のパッケージ内容 ご購入には以下が含まれます。 • MT5用Atomic Analyst。 • Smart Universal Expert Advisor — 無料。 • Atomic Analystの完全版PDFユーザーマニュアル。 • Atomic Analyst公式オンラインコース。 • インストールと設
トレンドキャッチャーインジケーター トレンドキャッチャーインジケーターは、開発者独自の適応型トレンド分析指標を組み合わせることで、市場価格の動きを分析します。短期的なノイズを除去し、根底にあるモメンタムの強さ、ボラティリティの拡大、価格構造の挙動に焦点を当てることで、真の市場方向性を特定します。また、移動平均線、RSI、ボラティリティフィルターなどの平滑化およびトレンドフィルタリング機能を備えたカスタマイズ指標も使用します。 実際の運用状況のモニタリングやその他の製品については、こちらをご覧ください: https://www.mql5.com/en/users/mechanic/seller ご注意ください。私はTelegramでEAや設定を販売していません。詐欺です。すべての設定はブログで無料で公開しています。 重要!ご購入後すぐにご連絡ください。手順とボーナスをお送りします!
M1 SNIPER は使いやすいトレーディングインジケーターシステムです。M1時間足向けに設計された矢印インジケーターです。M1時間足でのスキャルピングのためのスタンドアロンシステムとして、また既存のトレーディングシステムの一部としても使用できます。このトレーディングシステムはM1時間足での取引に特化して設計されていますが、他の時間足でも使用できます。元々、この手法はXAUUSDとBTCUSDの取引用に設計しましたが、他の市場においても役立つと考えています。 インジケーターのシグナルは、トレンドの方向と逆方向に取引できます。インジケーターのシグナルを利用して両方向に取引するのに役立つ特別な取引テクニックをご紹介します。この手法は、特別な動的なサポートとレジスタンスの価格帯を利用することに基づいています。 ご購入後、M1 SNIPER矢印インジケーターをすぐにダウンロードできます。さらに、M1 SNIPERツールのすべてのユーザーに、以下のスクリーンショットに表示されているApollo Dynamic SRインジケーターを無料で提供しています。この2つのインジケーターを組み合わせることで
CRT Candle Range Theory HTF MT5 - Ultimate CRT Indicator: 高度なICTコンセプトとMalaysian SnRトレーディングシステム 最も先進的なCandle Range Theoryインジケーターでマーケットメーカーの足跡をマスターしましょう。Ultimate CRT Indicatorを使用して、Smart Money Concepts (SMC)の真の力を解き放ち、機関投資家のように正確にトレードします。真剣なトレーダー専用に構築されたこのインジケーターは、ICT Concepts (Inner Circle Trader)の核となる柱である、非常に効果的なCandle Range Theory (CRT)を自動化し、Malaysian Support and Resistance (SnR)エントリー手法とFVG (Imbalance)ゾーンの致命的な精度でそれを強化します。 MT5でForex、Crypto、Indicesのいずれを取引している場合でも、このアルゴリズムは市場のノイズを取り除き、ダマシ(fakeout)を
UZFX {SSS} スキャルピング・スマートシグナル v5.0 MT5は、変動の激しい市場において正確かつリアルタイムのシグナルを求めるスキャルパー、デイトレーダー、スイングトレーダー向けに設計された、リペイントのない高性能な取引インジケーターです。(UZFX-LABS)によって開発されたこのインジケーターは、価格行動分析、トレンド確認、スマートフィルタリングを組み合わせることで、すべての通貨ペアおよび時間枠において、高確率の売買シグナル、警告シグナル、トレンド継続の機会を生成します。 トレードの判断に迷うのはもうやめましょう。明確さ、正確さ、そして規律ある市場執行を求めるトレーダーのために設計された、体系的なシグナルシステムに従い始めましょう。 間違いなく、MQL5で入手可能な最高のインジケーターの一つです。絶対に見逃さないでください!!「スマートなトレーダーのためのスマートシグナル」 最新バージョン5.0がリリースされました。価格は予告なく最大499.99ドルまで値上がりする可能性がありますので、チャンスを逃さないようお早めにお求めください!! 購入を決める前に!無料トライアル
BTMM State Engine Pro by G-Labs — Beat The Market Maker indicator for MetaTrader 5. Asian session range, London and New York kill zones, level progression (L1/L2/L3), peak formation detection (PFH/PFL), entry signals, and a multi-pair scanner from one chart. Stop scanning charts one pair at a time. The State Engine tracks the BTMM daily cycle automatically — Asian box, room boundaries, level blocks, peak formations, and filtered entries — while the scanner dashboard shows level, peak status, d
ATSTRONG PRO:市場構造&ブレイクアウトインジケーター ブレイクアウト検出エンジン | 5つの動的TPターゲット | ライブダッシュボードパネル | リペイントなし 導入価格 現在の価格: $59 — 10回の販売ごとに価格が$10上昇します。 ATSTRONG PRO は、MetaTrader 5 用に設計された高度なブレイクアウトおよび機関投資家向け市場構造インジケーターです。 高確率のスイングピボットを検出し、クラスター化されたサポートとレジスタンスの蓄積ゾーンを特定し、 リアルタイムで構造の破壊(BOS)と性質の変化(CHoCH)のシグナルを発します。 このインジケーターは、ダイナミックなストップロスと5つの個別のテイクプロフィットレベル(TP1〜TP5)をチャート上に自動的に直接描画します。 リスクリワード予測ボックス、星付けされたシグナル品質の評価、およびリアルタイムのオンチャートパフォーマンス分析ダッシュボードを備えています。 取引に関する注意: これは手動取引および市場分析用のインジケーターです。ローソク足の確定時に明確な視覚的シグナル、レベル、アラー
Scalper Vault は、スキャルピングを成功させるために必要なすべてを提供するプロフェッショナルなスキャルピング システムです。このインジケーターは、外国為替およびバイナリー オプションのトレーダーが使用できる完全な取引システムです。推奨される時間枠は M5 です。 システムは、トレンドの方向に正確な矢印シグナルを提供します。また、トップとボトムのシグナルとギャン マーケット レベルも提供します。 インジケーターは、プッシュ通知を含むすべてのタイプのアラートを提供します。 インジケータの購入後にご連絡ください。私の個人的な取引の推奨事項と素晴らしいボーナス指標を無料で共有します! 幸せで有益な取引をお祈りします!
Quantum TrendPulse を ご紹介します。これは、   SuperTrend   、   RSI   、および Stochastic のパワーを 1 つの包括的なインジケーターに組み合わせて、取引の可能性を最大限に引き出す究極の取引ツールです。精度と効率を求めるトレーダー向けに設計されたこのインジケーターは、市場のトレンド、勢いの変化、最適なエントリー ポイントとエグジット ポイントを自信を持って特定するのに役立ちます。 主な特徴: SuperTrend 統合: 現在の市場動向に簡単に追従し、収益性の波に乗ることができます。 RSI精度: 買われすぎと売られすぎのレベルを検出し、市場の反転のタイミングに最適で、SuperTrendのフィルターとして使用されます。 確率的精度: 確率的振動を活用して、変動の激しい市場で隠れたチャンスを見つけます。SuperTrend のフィルターとして使用されます。 マルチタイムフレーム分析:   M5 から H1 または H4 まで、さまざまなタイムフレームで市場を常に把握します。 カスタマイズ可能なアラート: カスタム取引条件が満たされ
ご紹介     Quantum Breakout PRO は 、ブレイクアウト ゾーンの取引方法を変革する画期的な MQL5 インジケーターです。 13年以上の取引経験を持つ経験豊富なトレーダーのチームによって開発されました。     クォンタム ブレイクアウト プロ   は、革新的でダイナミックなブレイクアウト ゾーン戦略により、あなたのトレーディングの旅を新たな高みに押し上げるように設計されています。 クォンタム ブレイクアウト インジケーターは、5 つの利益ターゲット ゾーンを備えたブレイクアウト ゾーン上のシグナル矢印と、ブレイクアウト ボックスに基づいたストップロスの提案を提供します。 初心者トレーダーにもプロのトレーダーにも適しています。 量子EAチャネル:       ここをクリック 重要!購入後、インストールマニュアルを受け取るためにプライベートメッセージを送ってください。 推奨事項: 時間枠: M15 通貨ペア: GBPJPY、EURJPY、USDJPY、NZDUSD、XAUUSD アカウントの種類: ECN、Raw、またはスプレッドが非常に低い R
This indicator automatically detects internal & swing market structure, Fibonacci Retracement and Fibo Levels. Features Full internal & swing market structure labeling in real-time Fibonacci Retracement Fibonacci Levels After purchasing the indicator, the full source code is provided, and via indicator buffers it can be easily integrated into your Expert Advisors (EAs) for automated trading strategies.
Wolfe Wavesは、すべての金融市場に存在する自然に発生する取引パターンであり、均衡価格への戦いを表しています。これらのパターンは、短期および長期の時間枠で発生する可能性があり、現在の最も信頼性の高い予測反転パターンの1つであり、通常は強い長期の価格変動に先行します。 [ インストールガイド | 更新ガイド | トラブルシューティング | よくある質問 | すべての製品 ] クリアな取引シグナル 驚くほど簡単に取引できます カスタマイズ可能な色とサイズ パフォーマンス統計を実装します 適切なストップロスおよび利益レベルを表示します 電子メール/音声/視覚アラートを実装します インジケーターはパターンとブレイクアウト矢印を同時に描画し、インジケーターが展開するときにパターンが再描画されないようにします。ただし、エントリのブレイクアウトが何度も発生し、インジケータが再描画される場合、あまり頻繁にではなく控えめに再描画される可能性があります。インジケータは非バックペインティングです。 オオカミの定義 ウルフ波には、次の特性が必要です。 ( 例を見るにはここをクリック ) ウェーブ
Crystal Heikin Ashi Signals - Professional Trend & Signal Detection Indicator Advanced Heikin Ashi Visualization with Intelligent Signal System for Manual & Automated Trading Final Price: $149 ---------> Price goes up $10 after every 10 sales . Limited slots available — act fast . Overview Crystal Heikin Ashi Signals is a professional-grade MetaTrader 5 indicator that combines pure Heikin Ashi candle visualization with an advanced momentum-shift detection system. Designed for both manual traders
FX Power: 通貨の強弱を分析して、より賢い取引を実現 概要 FX Power は主要通貨と金の実際の強弱をあらゆる市場状況で理解するための必須ツールです。強い通貨を買い、弱い通貨を売ることで、 FX Power は取引の意思決定を簡素化し、高い確率の取引機会を見出します。トレンドを追従する場合でも、極端なデルタ値を使用して反転を予測する場合でも、このツールはあなたの取引スタイルに完全に適応します。ただ取引するだけではなく、 FX Power で賢く取引をしましょう。 1. なぜ FX Power がトレーダーにとって非常に有益なのか 通貨と金のリアルタイム強弱分析 • FX Power は主要通貨と金の相対的な強弱を計算し、マーケットダイナミクスに関する明確な洞察を提供します。 • どの資産がリードしているか、または後れを取っているかを監視して、取引するペアを賢く選びましょう。 マルチタイムフレームの包括的なビュー • 短期、中期、長期のタイムフレームで通貨と金の強弱を追跡し、マーケットトレンドに基づいて取引戦略を調整できます。 • スキャルピングからスイングトレード
ARICoin is a powerful trading companion designed to generate high-probability entry signals with dynamic TP/SL/DP levels based on volatility. Built-in performance tracking shows win/loss stats, PP1/PP2 hits, and success rates all updated live. Key Features: Buy/Sell signals with adaptive volatility bands Real-time TP/SL/DP levels based on ATR Built-in MA Filter with optional ATR/StdDev volatility Performance stats panel (Success, Profit/Loss, PP1/PP2) Alerts via popup, sound, push, or email Cust
SMC Market Structure MT5 PRO is a chart-based analysis indicator for MetaTrader 5 designed for traders who use Smart Money Concepts (SMC), Inner Circle Trader (ICT) concepts, market structure, liquidity analysis, and multi-timeframe price action. The indicator brings a comprehensive collection of SMC and ICT tools into a single chart, including Market Structure, Break of Structure (BOS), Change of Character (CHoCH), Order Blocks (OB), Fair Value Gaps (FVG), Inverse Fair Value Gaps (IFVG), Balanc
M1 Quantum MT5
Hamed Dehgani
4.27 (11)
M1 Quantum を使用したライブトレードシグナル : シグナル (取引は 自動的に Quantum Trade Assistant によって実行され、この製品に 無料 で含まれています。) 最新ニュース: バージョン1.64がリリースされました。現在、すべての取引で、関連するサポート/レジスタンスゾーンの後ろにStop Lossが設定されます。今回のバージョンでは、EAのパフォーマンスを向上させるためにSmart Close機能も改善されました。 8月9日から、ライブシグナルはバージョン1.64で稼働しています。 価格プラン: 現在価格: $169 (早期購入者向けオファー) 次回予定価格: $189 予定小売価格: $299 開発者からのお知らせ: ご購入後、 最新の推奨設定ファイル(Set File) 、運用アドバイス、および他の M1 Quantum ユーザーと交流できる VIPサポートグループ への招待をご希望の場合は、お気軽にご連絡ください。 よくある質問 - 設定ファイル - インストールガイド M1 Quantum は、M1専用のプロフェッショナルトレーディング
作者のその他のプロダクト
QuantMatrix Probability AI Free QuantMatrix Probability AI Free is a technical indicator for MetaTrader 5 that combines several measurements of current market conditions into three numerical estimates. The indicator uses exponential moving averages, Relative Strength Index (RSI), Average True Range (ATR) and the current price position in its calculation. These measurements are combined into a normalized market score. The resulting information is displayed on the chart as: BUY percentage SELL p
FREE
QuantMatrix Probability AI PRO QuantMatrix Probability AI PRO is a technical indicator for MetaTrader 5 designed to evaluate current market conditions and present them as BUY, SELL and NEUTRAL percentage estimates. The indicator combines several market measurements, including trend, momentum, volatility, price position, candlestick wick behavior and breakout conditions. It also compares the current market state with similar historical situations found in the selected symbol and timeframe. The hi
QuantMatrix Candle Patterns is a free MetaTrader 5 indicator designed to identify classic candlestick formations directly on the chart. The indicator analyzes completed candles and detects recognized bullish, bearish and neutral price-action patterns. When a valid bullish or bearish formation is confirmed, the corresponding BUY or SELL signal is displayed on the following candle . This means the signal is only generated after the source pattern has been completed. The indicator also displays a c
FREE
QuantMatrix Wick Pressure QuantMatrix Wick Pressure is a technical indicator for MetaTrader 5 that measures the relationship between upper and lower candlestick wicks and converts this information into a numerical pressure measurement. Candlestick wicks represent price movement that occurred beyond the candle body before price returned from those levels. The indicator measures this rejection behavior over consecutive candles and displays the result in a separate indicator window. Positive values
FREE
QuantMatrix Volatility Regime QuantMatrix Volatility Regime is a technical indicator for MetaTrader 5 that evaluates the current volatility of the selected symbol and timeframe. The indicator uses Average True Range (ATR) to compare current volatility with a historical baseline calculated from previous bars. Based on this comparison, the current market condition is classified into one of four volatility regimes: LOW – current volatility is below the historical baseline. NORMAL – current volatil
FREE
QM FlowVision X1 Visual Multi-Factor Trading Indicator with Historical Probability, Market Flow, Momentum, Divergence and Multi-Timeframe Context QM FlowVision X1 is a visual decision-support indicator for MetaTrader 5 designed to transform multiple market conditions into a simple and readable trading state. Instead of displaying isolated oscillators without interpretation, FlowVision combines momentum, money flow, RSI, Stochastic RSI, divergence and higher-timeframe context into a unified 0–100
FREE
QM Candle Timing Meter is a free MetaTrader 5 indicator designed to answer one simple question: How late am I in the current candle? A trading signal may still be technically valid while the timing of the entry has already changed significantly. For example, entering during the first minutes of an H1 candle is very different from entering when 90% of that candle has already elapsed. QM Candle Timing Meter continuously measures the temporal position of the current candle and displays this informa
FREE
QuantMatrix FX+Gold V8.4 Adaptive Quantitative Trading for Forex & Gold QuantMatrix FX+Gold V8.4 is an advanced multi-asset Expert Advisor developed for Forex and Gold (XAUUSD) . Instead of relying on a single fixed trading strategy or a conventional combination of indicators, QuantMatrix uses a research-driven architecture designed to discover, validate, rank and continuously monitor multiple trading models derived from the historical behavior of each market. The central idea is simple: The mar
QuantMatrix Candle Exhaustion QuantMatrix Candle Exhaustion is a technical indicator for MetaTrader 5 that identifies candles showing predefined price expansion and wick characteristics. The indicator compares the range of the current candle with the average range of previous candles. When the candle range exceeds the configured historical range threshold, its upper and lower wicks are evaluated. A bullish exhaustion marker can be displayed when an expanded bullish candle also contains the requi
QuantMatrix False Breakout Detector QuantMatrix False Breakout Detector is a technical indicator for MetaTrader 5 that identifies potential failed breakouts of recent price ranges. The indicator calculates the highest high and lowest low within a configurable historical period. It then evaluates whether the current price moves beyond one of these levels by a minimum volatility-adjusted distance and subsequently closes back inside the previous range. Average True Range (ATR) is used to adjust the
QuantMatrix Historical Move Probability QuantMatrix Historical Move Probability is a statistical indicator for MetaTrader 5 that compares the current price movement with similar movements found in the historical data of the selected symbol and timeframe. Price movements are normalized using Average True Range (ATR). This allows movements from different historical periods to be compared relative to the volatility present at each period. The indicator searches the configured historical sample for
QuantMatrix Volume Depth is a MetaTrader 5 indicator for visual analysis of market activity across different price levels. The indicator builds a horizontal profile across the analyzed price range and shows where trading activity has been concentrated. It displays the Point of Control, Value Area High, Value Area Low and the distribution of activity across multiple price levels. The indicator can use real volume when it is available from the symbol. When real volume is not available, tick vol
フィルタ:
レビューなし
レビューに返信