Prev Week High Low Sweep

Weekly Extreme Liquidity Sweep and Mean-Reversion for MT5

Systematic Weekly High/Low Sweep Detection and Macro Range Rotation Validation

Core Concept and Value Proposition

Trading initial breakouts beyond major previous week extremes often leads to rapid drawdowns: price briefly penetrates the level, absorbs clustered resting liquidity, and swiftly reverses back into the established weekly range. Traders who hesitate during this rejection phase frequently miss the continuation toward internal range targets.

This indicator provides a structured framework to identify institutional liquidity sweeps at previous week highs and lows (PWH / PWL). The algorithm continuously monitors major weekly price boundaries, isolates false expansion probes that raid external liquidity pools, and validates genuine rejection as soon as price closes back inside the prior weekly range. This offers an objective visual methodology for executing structured mean-reversion and range-rotation opportunities.

The system is optimized for liquid instruments (Forex majors, Gold, stock index CFDs) and active trading sessions characterized by clear institutional order flow across multiple timeframes.

Algorithmic Logic and Trade Validation

Visual BUY Confirmation (Sell-Side Liquidity Sweep):

  • Context: Price pierces below the Previous Week Low (PWL) to access resting sell-side stop liquidity.
  • Rejection: A bullish candle displays clear lower-wick absorption and closes firmly back above the Previous Week Low threshold.
  • Execution Trigger: The setup confirms strictly upon candle close; the open of the subsequent bar serves as the execution reference.

Visual SELL Confirmation (Buy-Side Liquidity Sweep):

  • Context: Price spikes above the Previous Week High (PWH) to access resting buy-side stop liquidity.
  • Rejection: A bearish candle displays clear upper-wick absorption and closes firmly back below the Previous Week High threshold.
  • Execution Trigger: The setup confirms strictly upon candle close; the open of the subsequent bar serves as the execution reference.

Strict Closed-Bar Calculation:

  • All signal calculations, weekly threshold references, and target projections are determined strictly upon the close of the setup candle.
  • Once a bar completes, the signal markers and levels lock permanently; they do not recalculate, shift, or disappear on historical data.

Risk Management Architecture and Target Ladder

Every validated setup automatically projects a structured trade management plan directly onto the chart:

  • Protective Stop Loss: Systematically anchored beyond the extreme wick of the weekly liquidity sweep, with a configurable volatility buffer to protect against spread spikes and minor secondary retests.
  • TP1 (0.5R): Rapid risk-mitigation milestone designed for early partial profit securing.
  • TP2 (0.8R): Balanced continuation milestone capturing early range recovery momentum.
  • TP3 (1.2R): Swing target positioned to capture extended rotation toward internal weekly liquidity.
  • TP4 (2.0R): Macro expansion target engineered to track full-range rotations across structural extremes.
  • Lifecycle Tracking: Real-time on-chart indicators monitor setup progression (Active, TP Hit, SL Hit).

Integrated Functional Modules

1. Multi-Symbol and Multi-Timeframe Scanner

Monitors multiple instruments simultaneously across M15, M30, H1, H4, and D1 without opening multiple charts:

  • Active Signal Discovery: Scans and highlights active BUY and SELL setups as weekly extremes are tested.
  • Progress Monitor: Tracks the live state of active trade plans (Active, approaching TP, approaching SL).
  • Timeframe Confluence: Alerts when lower-timeframe sweep rejections align with higher-timeframe trend context.
  • Market Bias Reading: Displays an UP, DOWN, or FLAT reading based on structural range position.
  • One-Click Switching: Click any cell on the scanner dashboard to immediately redirect your active chart to that symbol and timeframe.

2. Noise Filtering (Signal Brake Engine)

  • Suppresses alternating BUY/SELL signals during choppy consolidation.
  • Restricts new signals in the same direction while a prior setup remains actively tracked.
  • Enforces a minimum structural R-distance between triggers to prevent signal clustering.

3. On-Chart Historical Backtest Panel

Provides an immediate statistical summary of past signal outcomes directly on your chart:

  • Reports hit-rate performance across all target tiers (TP1, TP2, TP3, and TP4).
  • Displays total setup count and sample size across the configured historical lookback.
  • Identifies optimal historical target levels for the selected asset.
  • Note: Backtest metrics represent past price behavior for the active symbol and settings. Past performance does not guarantee future results.

4. Multi-Channel Alert Suite

  • MT5 desktop visual pop-ups.
  • Audible sound alerts (.wav).
  • Instant mobile push notifications via MetaQuotes ID.

5. Optimized Chart Interface

  • Three size presets: Small (S), Medium (M), and Large (L).
  • One-click minimize and expand controls to keep chart space clutter-free.
  • Draggable interface panel that retains its position across timeframe changes.

Recommended Usage and Operating Specifications

  • Supported Instruments: Highly liquid assets such as Forex majors, Gold (XAUUSD), and stock index CFDs.
  • Recommended Timeframes: M15, M30, H1, and H4 for precise sweep-and-close confirmation relative to weekly levels.
  • Platform Compatibility: Fully compatible with MetaTrader 5 on both Hedging and Netting account types.

Support and Free Demo Testing

A functional demo version is available to evaluate directly inside the MetaTrader 5 Strategy Tester prior to purchase.

If you have questions regarding indicator logic, settings, or chart configuration, please send a direct message via my MQL5 profile or comment on the product page.

おすすめのプロダクト
CosmiCLab SMC FIBO CosmiCLab SMC FIBO is a professional trading indicator designed for traders who use Smart Money Concepts (SMC), market structure analysis and Fibonacci retracement levels. The indicator automatically detects market swings and builds Fibonacci levels based on the latest impulse movement. It also identifies market structure changes such as BOS (Break of Structure) and CHOCH (Change of Character), helping traders understand the current market direction. CosmiCLab SMC FIBO also pr
Heiken_Ashi_Bars - MT5用 高度なトレンド可視化ツール 概要 Heiken_Ashi_Bars は、市場のノイズを取り除き、真のトレンドを浮き彫りにするために設計された、強力で視覚的に直感的なカスタムインジケーターです。従来のローソク足チャートは不規則な動きが多く、ダマシのシグナルにつながることがよくあります。価格データを平均化することで、このインジケーターはプライスアクションを滑らかにし、トレンドの継続、反転、および利益の出るエントリーポイントを非常に簡単に見つけることができます。 主な機能と利点 究極のノイズリダクション: 小さな価格のスパイクや持ち合いのノイズをフィルタリングします。 明確な視覚的シグナル: 色分けされたバーにより、強気および弱気のモメンタムを一目で確認できます。 リペイントなし (No Repaint): バーが確定するとシグナルは固定され、過去のバーを再計算しません。 高度に最適化: ターミナルの遅延をゼロにするクリーンなコード。 多用途: すべての金融商品 (FX、インデックス、貴金属、仮想通貨) で完璧に機能します。 トレード方法 上昇
To review our products, please click the link: LINK This Classic Pivot Point Indicator accurately calculates and displays 7 essential pivot levels , including the Pivot Point , 3 Support levels (S1–S3) , and 3 Resistance levels (R1–R3) based on the standard classic pivot formula . Designed for Forex, indices, commodities, and crypto trading , it supports multi-currency and multi-timeframe analysis in a clean, professional dashboard interface . With the built-in interactive dashboard , traders c
Price Magnet — Price Density and Attraction Levels Indicator Price Magnet is a professional analytical tool designed to identify key support and resistance levels based on statistical Price Density. The indicator analyzes a specified historical period and detects price levels where the market spent the most time. These zones act as “magnets,” attracting price action or forming a structural base for potential reversals. Unlike traditional Volume Profile tools, Price Magnet focuses on price-time d
Caicai L&S Yield Histogram Important Notice: This indicator is an integral tool of the automated EA Caicai Long and Short Pair Trading . This indicator visually displays the percentage deviation (Yield %) of a pair's current spread relative to its own historical mean. It is an excellent tool for quickly visualizing the gross financial potential of a market distortion in Long & Short operations. Main Features: Percentage Visualization: Understand the size of the distortion in palpable percentage
Smart Trendlines – No.1 Trendlines Indicator Smart Trendlines is a precision tool that automatically draws trendlines based on every valid pivot point, helping traders identify key support and resistance zones. It continuously adjusts as new market pivots form, providing a live and accurate reflection of price structure. Whether you’re tracking trends, preparing for reversals, or anticipating breakouts — this indicator keeps you one step ahead. It works seamlessly across all assets including For
ZigZag Market Structure Breakout Pro ZigZag Extras Display BreakOut points is a MetaTrader 5 indicator for traders who use ZigZag, breakout points, market structure, BOS, CHoCH, swing high, swing low, support and resistance, and higher timeframe bias in their trading analysis. Main Benefits Displays confirmed ZigZag swing highs and swing lows Marks BOS Up, BOS Down, CHoCH Up and CHoCH Down Shows Depth Highest High and Depth Lowest Low lines Adds HH, HL, LH and LL structure labels Includes HTF bi
Pivot Confluence Zones は、   MT4およびMT5用のテクニカル分析インジケーター で、 ピボットポイント 、 フィボナッチリトレースメント 、   ATR   、   ADR を1つの取引ワークスペースに 組み合わせることで 、 リトレースメントゾーン 、 反転エリア 、 サポートおよびレジスタンスレベルを 識別 するように 設計されています。単一のテクニカルツールに頼るのではなく、このインジケーターは 複数の取引レベルが重なる コンフルエンスゾーン を検索し 、トレーダーが市場の注目度が高まる可能性のあるエリアを評価するのに役立ちます。価格分析を強化するために、このインジケーターには 最大45のローソク足パターン 、 移動平均トレンドフィルター 、インタラクティブな描画ツール、および設定可能なレベルタッチアラートも含まれています。Pivot   Confluence Zonesは、 外国為替トレーダー 、 金(XAUUSD)トレーダー 、 インデックストレーダー 、 暗号通貨トレーダー 、 スキャルパー 、 デイ トレーダー、スイングトレーダー 、 プライス
「調整可能なフラクタル」はフラクタル インジケーターの高度なバージョンで、非常に便利なトレーディング ツールです。 - ご存知のとおり、標準フラクタル MT5  インジケーターには設定がまったくありません。これはトレーダーにとって非常に不便です。 - 調整可能なフラクタルは、この問題を解決しました。必要な設定がすべて揃っています。 - インジケーターの調整可能な期間 (推奨値 - 7 以上)。 - 価格の高値/安値からの距離を調整可能。 - フラクタル矢印のデザインを調整可能。 - インジケーターにはモバイルおよび PC アラートが組み込まれています。 高品質のトレーディングロボットとインジケーターをご覧になるにはここをクリックしてください! これは、この MQL5 Web サイトでのみ提供されるオリジナル製品です。
Fabii Half Trend Baseline
Fabien Georges Andre Guillemaud
上位足のトレンドに逆らう取引をやめましょう。2本のベースライン、1つのチャート。リペイントなし。 どの通貨ペアでも、どの時間足でも。2分でチャートに表示。Strategy Tester で無料デモを試せます。 Get more indicators here Baselines, volatility filters and oscillators. No repaint. 必要な理由 チャート上のラインが緑になったので、あなたはエントリーします。その後、上位足を開くと、大きなトレンドは逆方向を向いています。シグナルは本物でした。しかし、その背景のトレンドはあなたの味方ではありませんでした。 大きなトレンドに逆らう取引は、そのたびにエントリーの優位性を失わせます。 得られるもの Fabii Half Trend Baseline は、現在の時間足のトレンドと上位足のトレンドを1つのチャートに表示します。ウィンドウを切り替えて全体像を確認する必要がなくなります。 上位足の2本目のベースラインがメインのラインの後ろに描かれるため、別のチャートを開かずに大きなトレンドが分かります。 ベ
This script provides basic pivot point Support and Resistance Levels to the user whilst displaying Break signal tags. It also has the ability to let the user display more significant breaks by filtering using the Volume Oscillator. Only more significant breaks of these basic levels are displayed to the user when optimized which avoids noise and messy signals. It will also display breaks with candles it deems to be bullish (e.g. having a longer upper or lower wick). Notation The notation
SMC Session Scanner MT5 is a panel indicator for MetaTrader 5 that watches many symbols and timeframes for smart-money structure and session levels. For each symbol and timeframe it shows one of these: a fresh break of structure (BOS), a change of character (CHoCH), or a fresh liquidity sweep. It also shows price inside a live order block or fair value gap. Otherwise it shows the latest break and how long ago it was. A Session column shows the session now. It also shows today's first close beyon
RBreaker Gold Indicatorsは、金先物の短期日内取引戦略であり、トレンドフォローと日内反転の2つの取引手法を組み合わせたものです。トレンド相場での利益を捉えるだけでなく、相場が反転した際には迅速に利確し、その流れに沿ってポジションを反転させることができます。 この戦略は、アメリカの雑誌『Futures Truth』において、15年連続で最も収益性の高い取引戦略トップ10に選ばれた実績を持ち、非常に長いライフサイクルを誇り、現在も国内外で広く使用・研究されています。 本インディケーターは、2026年の金先物の値動きに対応し、14日間のATR指標に基づいて、ブレイクアウト係数A、観察係数B、リバーサル係数Rをより合理的な値で定義しています。非常に優れたインディケーターであり、安定的な年間収益を実現しています。ぜひおすすめします〜
Key level wedge MT5
Presley Annais Tatenda Meck
The   Key level wedge MT5   indicator automatically draws rising wedge pattern and falling wedge pattern for you on the chart. This pattern is really good when used as a confirmation entry at key support & resistance, supply & demand and reversal zones. Advantages  The   Key level wedge MT5   block DOES NOT RE-PAINT, giving you confidence when a signal appears and also helps when looking back.  The   Key level wedge MT5   includes an on/off button on the chart to easily keep the charts clean
HAS RSI Signal — SL/TP自動計算機能付き プロフェッショナル・トレンドインジケーター HAS RSI Signal は、信頼性の高いクラシックな手法と最新のノイズ除去アルゴリズムを融合させた強力なトレーディングツールです。 平均足スムーズド(Heiken Ashi Smoothed) と RSI を組み合わせることで、トレンドの転換点や買われすぎ・売られすぎ圏からの脱出タイミングを正確に捉え、明確なエントリーシグナルを提示します。 主な特徴: 二重のフィルタリング: 平均足スムーズドで市場の「ノイズ」を除去し、RSIで勢い(モメンタム)の強さを確認します。 損切り・利確ラインの自動計算: 単にシグナルを出すだけでなく、ボラティリティ( ATR )に基づいた最適なストップロス(SL) と テイクプロフィット(TP)を自動で算出します。 視覚的な分かりやすさ: シグナルはチャート上にカラーキャンドルとして表示されるため、一目でトレンドを把握でき、取引画面をスッキリと保てます。 充実の通知機能: アラート、音声、スマートフォンへのプッシュ通知機能を搭載。チャンスを逃すこと
RelicusRoad Support Resistance は MetaTrader 4 および MetaTrader 5 向けのサポート・レジスタンスインジケーターで、フラクタルの高値安値から需給ゾーンを構築し、強さと直近のテストに基づいて各ゾーンを格付けします。 価格の上下にある直近のゾーンの短い地図を保持し、各ゾーンには格付け、幅、直近のテスト回数のラベルが付きます。 仕組み 高値と安値のスイングは、単一の線ではなく価格帯としてまとめられます。スイングとは、その足の高値または安値が両側 7 本の足で超えられていない足のことで、より大きな 15 本のスイングや、そのあとに強い反応を伴ったスイングほど重く数えられます。加重したスイングを価格軸に沿って積み上げ、最も密集した独立領域がゾーンになります。各ゾーンは強さのスコアを得て、テストが繰り返されるたびにそのスコアは下がり、ゾーンどうしは Average True Range(ATR)の 0.75 倍以上の間隔を保ち、重ならないように保たれます。 Verified:直近でテストされ、なお強い。 Weak:直近でテストされたが、強さは
Einstein Pivot Point Pro は、日足・週足・月足のピボットレベルを描画し、今日と似た過去の日に、各レベルで価格がどう動いたかを表示します。 多くのピボットインジケーターはラインを引くだけです。本インジケーターは小さなパネルを追加し、レベルごとに3つのシンプルな問いに答えます。 Reached: 価格はどのくらいの頻度でこのレベルに到達したか? Held: 到達したとき、どのくらいの頻度で押し戻されたか? Broke: そして、どのくらいの頻度で突き抜けたか? 数値は、今日と似た過去の日だけを数えます。初期設定では「今日と似た日」とは、ピボットの同じ側で始まった日のことです。今日 P より上で始まった場合、パネルは同じく P より上で始まった過去の日だけを数えます。 パネルの読み方 EURUSD チャートからの例です(数値は銘柄や日によって変わります)。 見出し:"Based on 110 past days that opened ABOVE the pivot, like today" 行:R1 | 50% | 46% | 50% | today: reache
Chỉ báo này sẽ thông báo cho bạn nếu cấu hình xu hướng thành công. Tín hiệu theo xu hướng không nên được tăng theo, nhưng tín hiệu mua ở mức giá thấp theo mô hình giao dịch thông thường của bạn, hoặc tín hiệu bán ở mức giá tốt, là một lựa chọn rất tốt. Hãy thiết lập nó trên khung thời gian lớn hơn và theo dõi các khung thời gian nhỏ hơn, bám sát các xu hướng chính. Tôi thường thiết lập ba khung thời gian gần nhau nhất và không bao giờ đi ngược tín hiệu của INdicator này. INdicator   này không có
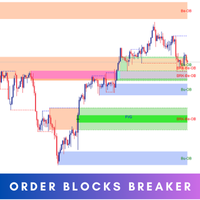
Introducing   Order Blocks Breaker , a brand-new way to identify and leverage order blocks in your trading strategy. After developing multiple order block tools with unique concepts, I’m proud to present this tool that takes things to the next level. Unlike previous tools,   Order Blocks Breaker   not only identifies order blocks but also highlights   Breaker Order Blocks —key areas where the price is likely to retest after a breakout. MT4 -  https://www.mql5.com/en/market/product/124101/ This t
这是一个基于前一个交易日的最高价、最低价和收盘价来计算的枢轴点指标,具体公式如下: 计算前一日的 Pivot Point (枢轴点): Pivot = (High + Low + Close) / 3 计算 Resistance 1 (R1) 、 Support 1 (S1) ​ 等: R1 = (2 * Pivot) - Low S1 = (2 * Pivot) - High R2 = Pivot + (High - Low) S2 = Pivot - (High - Low) 与市面上其他的枢轴点指标相比,该指标主要有以下4个特点: 1、可以修改交易日的开始时间; 2、可以设定支撑压力线的颜色; 3、可以设定是否显示各个支撑压力线对应的价格; 4、可以设定天数用以显示枢轴点的历史记录; 开发这个指标的最初目的是为了解决设定交易日开始时间的问题,接下来会进一步说明。基于计算公式,我们需要获得上一个交易日的最高价、最低价和收盘价,在夏令时,北京时间6点是开市时间,大多数交易平台服务器的0点对应的是北京时间的6点,但是香港的服务器6点才是对应的是北京时间的6点。如果你有多个平台,且存在
Advanced Support and Resistance Support and resistance levels are widely used in trading. They are important as they show some key price levels. Before applying any strategy, one may consider it necessary to draw support and resistance. However, this process can take much time especially if one is to analyse a lot of currency pairs, commodities or indices. This Advanced Support and Resistance tool was designed for traders at any level, amateur to professional. It plots key support and resistance
Noize Absorption Index - is the manual trading system that measures the difference of pressure between bears forces and bulls forces. Green line - is a noize free index that showing curent situation. Zero value of index shows totally choppy/flat market.Values above zero level shows how powerfull bullish wave is and values below zero measures bearish forces.Up arrow appears on bearish market when it's ready to reverse, dn arrow appears on weak bullish market, as a result of reverse expectation.
プレミアムレベルは、正しい予測の精度が80%を超える独自の指標です。 この指標は、最高のトレーディングスペシャリストによって2か月以上テストされています。 あなたが他のどこにも見つけられない作者の指標! スクリーンショットから、このツールの正確さを自分で確認できます。 1は、1キャンドルの有効期限を持つバイナリーオプションの取引に最適です。 2はすべての通貨ペア、株式、商品、暗号通貨で機能します 手順: 赤い矢印が表示されたらすぐにダウントレードを開き、青い矢印が表示されたら閉じます。青い矢印の後に開くこともできます。 試してテストしてください!推奨設定はデフォルトです! 日足チャートで最高の精度を示します! インディケータは、2600 Pipsの収益性に対して、約10Pipsという非常に小さなマージンを使用します。
EMA256 Fourier Cycle Trader EMA256 Fourier Cycle Trader is an advanced MetaTrader 5 Expert Advisor combining a long-term EMA or TEMA trend model, causal Fourier cycle analysis, configurable averaging and a unified basket take-profit system. The Expert Advisor is designed primarily for CENT accounts and for traders who understand basket recovery strategies, geometric lot progression and the risks associated with trading without a mandatory Stop Loss. RECOMMENDED STARTING CONFIGURATION Recommended
Nexora EA Monitoring System — Free Remote Position Monitor for MetaTrader 5 (VPS-Friendly) Nexora Monitor is a free, read-only MetaTrader 5 indicator that displays a live dashboard of your open positions — designed for traders who run an Expert Advisor on a VPS and want to check its status from a separate MT5 desktop terminal without remoting into the VPS itself. Attach it to a chart on any MT5 desktop terminal (Windows or Mac) logged into the same trading account and it reconstructs a clear s
FREE
Crypto_Forex MT5用インジケーター「ハンマー&シューティングスターパターン」。リペイント不要、遅延なし。 - インジケーター「ハンマー&シューティングスターパターン」は、プライスアクショントレードに非常に強力なインジケーターです。 - このインジケーターは、チャート上で強気のハンマーパターンと弱気のシューティングスターパターンを検出します。 - 強気のハンマーパターン:チャート上に青い矢印シグナルを表示します(画像参照)。 - 弱気のシューティングスターパターン:チャート上に赤い矢印シグナルを表示します(画像参照)。 - PC, Mobile alerts. - インジケーター「ハンマー&シューティングスターパターン」は、サポートレベル/レジスタンスレベルと組み合わせるのに最適です。 高品質のトレーディングロボットとインジケーターをご覧になるにはここをクリックしてください! これは、このMQL5ウェブサイトでのみ提供されるオリジナル製品です。
BlueBoat – Prime Cycle is a technical indicator for MetaTrader 5 that visualizes market cycles based on the Fimathe cycle model (Marcelo Ferreira) . It identifies and displays historic and live cycle structures such as CA, C1, C2, C3, etc., helping traders understand the rhythm and timing of price movement across multiple sessions. This tool is ideal for manual analysis or as a supporting signal in discretionary strategies. Key Features Historical Cycle Analysis – Backtest and visualize as many
How it works –   Base-departure detection — algorithmically finds consolidation bases (overlapping range with compressed volatility) followed by displacement departures. Patterns: Drop-Base-Rally, Rally-Base-Drop, Rally-Base-Rally, Drop-Base-Drop — detected structurally, not by candle names. –   Strength score (0–100) — from departure velocity, time-at-base, freshness (each revisit decays the score), higher-timeframe confluence and origin volume. –   Lifecycle — Fresh, Tested (decaying), Broken
FREE
MACD Sniper Pro is an advanced automated trading system designed for traders seeking high-precision entries and robust risk management. By combining the classic momentum of MACD Crossover with a strict ADX Volatility Filter and Dynamic ATR Management , this EA completely eliminates emotional trading and filters out dangerous flat/sideways markets. Unlike standard MACD indicators that suffer during consolidation, MACD Sniper Pro verifies trend strength before entering and protects your capital us
Market Structure Fractals The structure layer MetaTrader 5 was missing Most traders stare at candles and draw structure manually — imprecisely, inconsistently, and always too late. You know what a fractal high and low look like. The question is whether you can spot every one, mark it cleanly, and track it the moment price breaks through. You can't. Market Structure Fractals can. MetaTrader 5 shows you price. It doesn't show you structure. That gap — between a candle pattern and a confirmed bre
FREE
このプロダクトを購入した人は以下も購入しています
Trend Sniper X
Sarvarbek Abduvoxobov
4.86 (43)
Trend Sniper X は、トレードの方向性と潜在的な反転ポイントを明確かつ正確に特定するのに役立つ、MetaTrader 5 用のマルチタイムフレーム・トレンドフォロー指標です。 MT4用: https://www.mql5.com/en/market/product/193245 価格情報: 現在の価格はプロモーション価格であり、今後のアップデートや新機能のリリースに伴い変更される場合があります。 ボーナス特典: このインジケーター用の無料自動売買アシスタントEAを入手するには、購入後に an 著者(開発者)へメッセージをお送りください。 Code2Profit チャンネル マルチタイムフレーム分析で相場をマスターしよう! Trend Sniper X で勝率を最大化する方法:重要なルールとセッションのコツ 技術仕様 プラットフォーム MetaTrader 5 インジケータータイプ マルチタイムフレーム・トレンドインジケーター 操作タイムフレーム あらゆるチャートタイムフレームに対応。個別に選択可能な上位タイムフレーム (M1–MN1) を搭載 主要銘柄 FX、ゴールド (X
Smart Trend Trading System — MetaTrader 5 ご購入後、MQL5で私にメッセージをお送りいただくと、Smart Universal Expert Advisorを無料で受け取れるほか、オンライン講座、PDFマニュアル、非公開グループへのアクセスもご利用いただけます。 STTSは、トレンドの方向、エントリー・決済シグナル、反転ゾーン、重要な価格水準をチャート上にまとめて表示します。システムを参考に手動で取引することも、別の対応EAを接続し、ご自身で選んだ設定に基づいて自動売買することもできます。 ひとつのシステム、4つのトレードアプローチ STTSのトレードアプローチは、大きく4つのカテゴリーに分かれています。 • スキャルピング — 短期的なシグナルや相場の動きを捉えます。 • トレンドトレード — 方向性を評価し、トレンド内の機会を探します。 • 反転トレード — 反転の可能性があるゾーンや方向の変化を見つけます。 • 出来高トレード — 出来高に基づく情報を使い、市場の活発さを評価します。 エントリー・決済の矢印、トレンド情報、サポート・
新たな王者が登場 - インジケーター + 注文管理表示(TP1 + TP2 + TP3)+ オプションのTelegramシグナル送信機能付き(無料) (完全なトレード&シグナルシステム) ゴールド向け最高のEA: Gold Slayer このインジケーターには、高度な戦略、カスタマイズ可能な注文管理システム、そしてエンベロープ拡張を組み合わせた平均回帰システムが搭載されています。さらに、RSIなど複数のインテリジェントな確認フィルターによって、高確率の反転エントリーをBUY・SELLシグナルとして検出します。 単にトレードを学ぶだけでなく、複数ポジションを効果的に管理し、過去に利益を出しているオープンポジションで損失トレードをカバーする方法も学べます。 M5向けに構築・最適化されており、流動性が高くシグナルの精度が安定しているBTCUSDとXAUUSDで優れたパフォーマンスを発揮します。 このインジケーターは、ATRを基に自動計算されたエントリー、ストップロス、テイクプロフィットレベルを備えた明確なLong・Shortシグナルを提供するため、リスク管理が最初から組み込まれています。 マ
あなたのトレード優位性を視界に入れよう! M5 Sniper は MeanFX による新しいインジケーターです。 正確なトレードシグナル と 適応型TP/SLレベル を組み合わせることで、結果として可能な限り最高の統計的トレードを実現します! 5回購入されるごとに価格が上昇し、次の価格は69$です 購入後に私にメッセージを送っていただければ、ヒント/ガイドとボーナスEAをお受け取りいただけます 何が他と違うのでしょうか? Gold XAUUSDにおける 実証済みの統計的パフォーマンス ( ほぼすべてのアセットで機能します 。一貫した結果が得られないまま何でも扱おうとするのではなく、1つの時間足をマスターすることに重点を置いています) 1日あたり1~8回のトレード を各シンボルで実行し、高い勝率と、すべての統計的優位性をこちら側に持つことができます チャート上には 確認済みの BUYおよびSELLシグナルのみを表示 適応型TPおよびSLレベル を各トレードごとにインジケーターが生成 平均Winrate 75%+ 平均 Signal Ratio 最低1.1+ アラーム と通知を 携帯電話
ULTRAは、「オールインワン」方式で機能するテクニカル指標です。市場を独自に分析し、売買シグナルを生成し、ストップロス注文を設定するための水準を表示し、利益を確定したり損失を最小限に抑えたりするためにポジションを決済すべきタイミングを提案します。 つまり、市場の分析方法や、水準(ストップロスをどこに設定すべきか)の見極め方がわからなくても、あるいは資金管理に苦労していても問題ありません。ULTRAがすべて代行してくれます! 購入者限定特典 :「ULTRA」インジケーターをご購入後、私にプライベートメッセージをお送りいただければ、「ULTRA BOT」を無料プレゼントとしてお受け取りいただけます。これは、このインジケーターからのシグナルに基づいて、オープンしたトレードを管理するのに役立つ特別なツールです(各トレードにストップロスを設定し、最適な結果が得られるよう、戦略のルールに従って自動的にトレードを決済します)。  また、インジケーターを最大限に活用できるよう、さまざまな資産向けの既成の設定も購入者の皆様に提供しています。これらの「超お得な特典」を無料で入手するには、私へダイレクトメ
2019年、私はこのインジケーターの実力を世界中に示しました。そのシグナルに従って手動で、リアル口座で、公開の場でトレードしたのです。口座はMyfxbookでモニタリングされ、私はこの実験の経過をFacebookで詳しく発信していました。結果:4か月で10,000ドルが941,411ドルになりました。リスクは意図的に極端に取っていました — ドローダウンは最大54%に達しました。私たちの仕事では、利益とリスクは常に表裏一体だからです。Myfxbookのスクリーンショットは、ギャラリーの最初の画像です。 どうやら、おめでとうと申し上げてよさそうです。あなたの探求はここで終わりです。Entry Points Proはエントリーから当て推量を取り除き、すべてのトレーダーが求めているもの、つまり自信と落ち着きをもたらします。なぜなら、このインジケーターは本当に機能し、シグナルを一切リペイントせず、それをすぐにあなたのチャート上で金額として示すからです。ウィンドウだらけで、設定が30個もあり、中身のない約束ばかりの複雑なインジケーターにうんざりしていませんか?それらは機能せず、ますます混乱させる
SuperScalp Pro
Van Minh Nguyen
4.54 (37)
SuperScalp Pro - Professional Multi-Layer Confluence Scalping System SuperScalp Proは、複数の高度な確認フィルターを追加することで、従来のSupertrendを強化したスキャルピング向けインジケーターです。誤ったシグナルを大幅に減らしながら、成功する可能性がより高いBuy/Sellの取引機会を見つけるのに役立ちます。 BuyとSellの矢印がチャート上に明確に表示され、ATRに基づくStop LossとTake Profitのレベルもリアルタイムで自動計算されます。 ご購入後、MQL5で私にメッセージを送っていただくと、SuperScalp Pro Auto Trader EAを無料で受け取れるほか、ユーザーガイドとプライベートグループへのアクセスもご利用いただけます。 推奨設定ファイルをダウンロード: [Set File] 詳細なドキュメントは製品ブログでご覧いただけます: [User Guide] 最新情報を受け取るには公式チャンネルにご参加ください: [Official Channel] Sup
Gann Made Easy   は、ミスター・ギャンの理論を使用した取引の最良の原則に基づいた、プロフェッショナルで使いやすい外国為替取引システムです。 W・D・ガン。このインジケーターは、ストップロスとテイクプロフィットレベルを含む正確な買いと売りのシグナルを提供します。 PUSH通知を利用して外出先でも取引可能です。 ご購入後、取引方法の説明と優れた追加インジケーターを無料で入手するには、私にご連絡ください! おそらく、ギャンの取引手法についてはすでに何度も聞いたことがあるでしょう。通常、ギャンの理論は初心者のトレーダーだけでなく、すでにある程度の取引経験がある人にとっても非常に複雑なものです。なぜなら、ギャンの取引手法は理論的にはそれほど簡単に適用できるものではないからです。私はその知識を磨き、最良の原則を私の外国為替インジケーターに組み込むために数年を費やしました。 このインジケーターは非常に簡単に適用できます。必要なのは、それをチャートに添付し、簡単な取引推奨事項に従うだけです。このインジケーターは常に市場分析の仕事を行い、取引の機会を探します。適切なエントリーポイントを検
SMC Intraday Formula
VividMind Digital Solutions
5 (26)
まず正直に言いましょう。 どんなインジケーターも、それ単体であなたを利益化させることはできません。もしそう言う人がいるなら、それは夢を売っているだけです。完璧な売買シグナル(矢印)を表示するインジケーターは、いくらでも“完璧に見せる”ことができます。正しい過去の区間を拡大して、勝ちトレードだけを切り取ればいいだけです。私たちはそれをしません。 SMC Intraday Formula はツールです。 市場構造を読み取り、最も高い確率の価格ゾーンを特定し、今この瞬間のスマートマネーの痕跡をシンプルな言葉で正確に示します。最終判断はあなたが行います。トレードを実行するのもあなたです。しかし今は「希望」ではなく「精度」でエントリーできます。 私たちはこのインジケーターを、ゴールド(XAUUSD)および主要FX通貨ペアで約3年間、日々のスキャルピングに使用してきました。M1、M5、M15、M30の主要ツールです。これは未来を予測しようとするのではなく、今まさに形成されている高確率セットアップを示し、その理由を説明します。 他のすべてのインジケーターと何が違うのか? ほとんどのトレーディングイ
M1 SNIPER は使いやすいトレーディングインジケーターシステムです。M1時間足向けに設計された矢印インジケーターです。M1時間足でのスキャルピングのためのスタンドアロンシステムとして、また既存のトレーディングシステムの一部としても使用できます。このトレーディングシステムはM1時間足での取引に特化して設計されていますが、他の時間足でも使用できます。元々、この手法はXAUUSDとBTCUSDの取引用に設計しましたが、他の市場においても役立つと考えています。 インジケーターのシグナルは、トレンドの方向と逆方向に取引できます。インジケーターのシグナルを利用して両方向に取引するのに役立つ特別な取引テクニックをご紹介します。この手法は、特別な動的なサポートとレジスタンスの価格帯を利用することに基づいています。 ご購入後、M1 SNIPER矢印インジケーターをすぐにダウンロードできます。さらに、M1 SNIPERツールのすべてのユーザーに、以下のスクリーンショットに表示されているApollo Dynamic SRインジケーターを無料で提供しています。この2つのインジケーターを組み合わせることで
次回アップデート — バージョン 2.52 近日公開!【新機能】 市場分析とトレードワークフローを強化する、4つの主要な新機能にご期待ください 皆様のトレードニーズに応える4つの新機能により、市場分析を次のレベルへと引き上げます。新機能をご紹介します: 1. TRADE OVERVIEW DASHBOARD 2. CONFLUENCE AT ZONE 3. STRONG & WEAK HIGH/LOW 4. OTE 1. TRADE OVERVIEW DASHBOARD 市場全体の状況をより簡単に把握できるダッシュボードです。トレード判断をサポートするガイダンスを提供し、市場分析とトレード計画を体系的に行えるよう支援します。すべてを1つの画面で確認できます。 マルチタイムフレーム市場概要(Multi-Timeframe Market Overview) 市場の方向性と価格構造をより明確に把握 市場状況をすばやく確認 体系的な市場分析とエントリー計画のためのガイダンス 2. CONFLUENCE AT ZONE 価格が重要なゾーンに入るとき…いくつのサポート要因が一致しているかを確認で
Atomic Analyst — MetaTrader 5 ご購入後、MQL5で私にメッセージをお送りいただくと、Smart Universal Expert Advisorを無料で受け取れるほか、オンライン講座、PDFマニュアル、非公開グループへのアクセスもご利用いただけます。 Atomic Analystは、プライスアクション、トレンドの方向、エントリー・決済シグナル、損切り水準、複数の利確水準をチャート上にまとめて表示します。 シグナルを確認し、取引の状況を理解する Atomic Analystは、分析結果をわかりやすい視覚情報として表示します。 • エントリーの候補を見つけるための買い・売りの矢印。 • 取引計画に役立つ損切り水準と複数の利確水準。 • 市場の方向性を評価するトレンド、強さ、モメンタムの指標。 • より広い市場背景を比較する複数時間足の分析。 • 変化する状況を追うための色分けされたローソク足とアラート。 シグナルと補助分析を併せて確認し、その取引機会がご自身のルールに合うかを判断してください。 短期の取引機会から、より大きな値動きまで Atomic A
Boba Analysis Suite
Trade Ready Solutions LLC
5 (2)
Boba Analysis Suite Boba Analysis Suite は、MetaTrader 5 向けの分析インジケーターです。市場構造、重要な価格帯、相場全体の状況を、一つのチャート画面にまとめて表示します。 トレーダーおよびトレーディング指導者としての実務経験をもとに開発され、市場の方向性の評価、重要な価格水準の特定、複数の時間足を組み合わせた分析など、体系的な分析プロセスを支援します。 相場の背景を踏まえた分析 個々のシグナルの意味は、相場の状況によって変わります。Boba Analysis Suite は、現在のチャート状況をより大きな市場構造と関連付け、あらかじめ定めたルールに沿って取引アイデアを検討するための分析を支援します。 主な分析機能: トレンドと市場構造: 市場の方向性と、その背景にある構造を評価します。 重要な価格帯と価格水準: さらに分析すべき重要な領域を視覚的に表示します。 複数の時間足: 異なる時間足の情報を組み合わせ、相場全体の状況を評価します。 視覚的な分析プロセス: 分析情報をチャート上で直接確認できます。 自主的な取引判断を支援 Boba
Adaptive Price Action Engine インジケーターを購入すると、EAが無料に マルチタイムフレーム対応・自己最適化トレンド&ローソク足パターン分析 市場環境は常に変化しており、すべてのPrice Actionパターンが、あらゆる市場環境で同じ価値を持つわけではありません。 Adaptive Price Action Engine は、変化する市場環境への適応を目的として、 トレンド構造、マルチタイムフレーム分析、ローソク足パターン、統計的最適化 を1つの分析フレームワークに統合しています。 2つのアダプティブモード Dual Alpha Trend Mode 低い時間足と高い時間足のAlpha Trendパラメータを自動的に探索し、直近の市場動向に合わせてトレンド判定を適応させます。 Candlestick + Alpha Mode Alpha Trendによる市場レジーム判定と、 22種類の強気・弱気ローソク足パターン を組み合わせます。すべてのパターンを同じように扱うのではなく、さまざまなパターンの組み合わせを統計的に評価し、選択された市場環境において過去
Azimuth Pro
Ottaviano De Cicco
5 (7)
Azimuth Pro V2:MT5向けシンセティック・フラクタル構造分析と確認済みエントリー 概要 Azimuth Pro は Merkava Labs によるマルチレベルスイング構造インジケーターです。4つのネストされたスイングレイヤー、スイングアンカーVWAP、ABCパターン検出、3タイムフレーム構造フィルタリング、そして確定バーでの確認済みエントリー — 1つのチャートで、ミクロスイングからマクロサイクルまでを網羅するワークフロー。 これはブラインドシグナル製品ではありません。ロケーション、コンテキスト、タイミングを重視するトレーダーのための構造ファーストワークフローです。 ハロウィンプロモーション — 35%オフ 相場が不気味に揺れても、あなたの優位性は鋭いまま。このオファーが霧の中に消える前に、35%オフで手に入れよう。 Azimuth Proが現在259 USD(通常399 USD)。 1. V2での変更点 シンセティック・マルチタイムフレームエンジン 上位タイムフレーム分析をMeridian Proと同じ独自のシンセティックアーキテクチャで一から再構築。より
Auto Optimized SpeedAngle は、継続的なウォークフォワード最適化(WFO:Walk-Forward Optimization)によりカーブフィッティング(過剰最適化)を排除した、機関投資家レベルのモメンタムベクトルシステムです。市場レジームの変化時に効果が低下する静的な入力に依存せず、アウトオブサンプル(OOS)検証を用いてパラメーターを動的に再キャリブレーションすることで、表示されるシグナルが単なる過去の偶然ではなく、確実な統計的優位性に基づいていることを保証します。 主な機関投資家向けフレームワーク ウォークフォワード最適化エンジン: ルックバック期間やしきい値の数千に及ぶ組み合わせを継続的にスキャンし、データをインサンプルとアウトオブサンプルに厳格に分離します。未検証のデータ環境において数学的優位性が証明された場合にのみ、新しいパラメーター設定を採用します。 定量的目的関数: 単なる純利益の追求ではなく、機関投資家レベルの安定性指標をターゲットとします。システム品質ナンバー(SQN)、期待値(1トレードあたりの平均Rマルチプル)、またはネットRの最適化を選
Zain Gold Scalping
Ahmed Gamal Abdel Nasser Mohamed
A complete price-action analysis tool built around dual independent entry logic, each confirmed against a volatility band, combined with a configurable set of nine optional confirmation filters that let you shape exactly how conservative or aggressive the tool's signals behave. Core Strategy Two independent entry setups, each triggering only when price moves outside a dynamic volatility band — giving two distinct ways to spot potential reversal points, which can be used together or separately.
Tokyo Indicatorは、トレンドの方向性、潜在的な取引シグナル、および市場状況を視覚的に分かりやすく表示します。 色分けされた階段状のトレンドラインにより、強気局面(青色)と弱気局面(マゼンタ色)が明確に区別されます。トレンドの変化に合わせて表示される方向矢印は、売買の好機を強調します。 統合されたダッシュボードには、現在のシグナル、市場のバイアス(傾向)、モメンタム、ボラティリティ、シグナルの品質がひと目で分かるようにまとめられています。これにより、トレーダーはパネルを切り替えることなく、価格変動(プライスアクション)とインジケーターの数値を照らし合わせて分析を行うことができます。 すっきりとしたチャート表示と簡潔な市場概要により、Tokyo Indicatorはトレンド分析や取引判断における体系的なアプローチをサポートします。 あらゆる時間足や銘柄に対応しており、特に金(ゴールド)の取引に適しています。 トレンド スキャナーの強力なサポートを利用して、無料のインジケーターを入手し、プライバシーを守ります。あーみー!     設定 ShowHUD - チャート上のパネ
FiboSniper Pro – Multi-Filter Fibonacci System with Auto SL/TP and Control Panel FiboSniper Proは、動的なFibonacci Envelopesと複数の確認フィルターを組み合わせ、選別されたBuyおよびSellシグナルを生成するテクニカルインジケーターです。FibonacciレベルはMoving AverageとATRを基に計算され、その後ADX、EMA、RSI、ATR、Volume、Time、Candle構造によってフィルタリングされます。インジケーターは、ATRに基づく自動Stop LossおよびTake Profitレベルをチャート上に直接表示し、さらに迅速な調整が可能なインタラクティブControl Panelを提供します。 ご購入後、MQL5で私にメッセージを送っていただくと、Auto Trader Xを無料で受け取れるほか、このインジケーターの取引シグナルを自動化する方法についての説明もご利用いただけます。 User GuideとSet Files: [Click here] 完全
Quantum TrendPulse を ご紹介します。これは、   SuperTrend   、   RSI   、および Stochastic のパワーを 1 つの包括的なインジケーターに組み合わせて、取引の可能性を最大限に引き出す究極の取引ツールです。精度と効率を求めるトレーダー向けに設計されたこのインジケーターは、市場のトレンド、勢いの変化、最適なエントリー ポイントとエグジット ポイントを自信を持って特定するのに役立ちます。 主な特徴: SuperTrend 統合: 現在の市場動向に簡単に追従し、収益性の波に乗ることができます。 RSI精度: 買われすぎと売られすぎのレベルを検出し、市場の反転のタイミングに最適で、SuperTrendのフィルターとして使用されます。 確率的精度: 確率的振動を活用して、変動の激しい市場で隠れたチャンスを見つけます。SuperTrend のフィルターとして使用されます。 マルチタイムフレーム分析:   M5 から H1 または H4 まで、さまざまなタイムフレームで市場を常に把握します。 カスタマイズ可能なアラート: カスタム取引条件が満たされ
SUPERHEROインジケーターは、「オールインワン」方式に基づいて設計された多通貨対応の取引システムです。このインジケーターは市場を独自に分析し、取引の開始および終了のタイミングに関するシグナルを提供します。ストップロス注文とテイクプロフィット注文を使用します。R:R比率は1:1です。 このシステムはスマートフォンにプッシュ通知を送信できるため、PCに縛られることなく「外出先」からでも取引を行うことができます。自己勘定取引を行う企業に最適です。 すべてのお客様への特典: このインジケーターをご購入いただいたすべてのお客様に、私から特別なユーティリティをプレゼントいたします。その内容は以下の通りです: 自動的にストップロス注文とテイクプロフィット注文を発注します 価格が目標水準に達すると、自動的に取引を決済します 指値注文による取引に対応しています 平均化取引モードに対応しています この優れた、しかも非常に便利なユーティリティをプレゼントとして受け取りたい場合は、SUPERHEROインジケーターをご購入後、直ちにMQL5プラットフォームのプライベートメッセージを通じて私までご連絡くださ
多通貨対応の通貨強弱・モメンタム・インジケーター MT5 Dynamic Forex28 Navigator は、長年ご好評いただいているインジケーターの発展版で、3 つの機能を 1 つに統合したものです: Advanced Currency Strength28 Indicator (700 件のレビュー) Advanced Currency IMPULSE with ALERT (530 件のレビュー) CS28 Combo Signals(最近のボーナス) この 2 つの前身インジケーターは MQL5 Market で合計 1,200 件を超えるレビューを獲得しており、2016 年から MT4 コミュニティで定番となっています。Dynamic Forex28 Navigator MT5 は、実績ある同じロジックを引き継いでいます。 MetaTrader 5 向けに完全に再構築 – MT5 ネイティブのマルチシンボル・アーキテクチャを最大限に活かす設計です。 ユーザーマニュアル: https://www.mql5.com/en/blogs/post/758844 MT4 版をお探し
トレンドキャッチャーインジケーター トレンドキャッチャーインジケーターは、開発者独自の適応型トレンド分析指標を組み合わせることで、市場価格の動きを分析します。短期的なノイズを除去し、根底にあるモメンタムの強さ、ボラティリティの拡大、価格構造の挙動に焦点を当てることで、真の市場方向性を特定します。また、移動平均線、RSI、ボラティリティフィルターなどの平滑化およびトレンドフィルタリング機能を備えたカスタマイズ指標も使用します。 実際の運用状況のモニタリングやその他の製品については、こちらをご覧ください: https://www.mql5.com/en/users/mechanic/seller ご注意ください。私はTelegramでEAや設定を販売していません。詐欺です。すべての設定はブログで無料で公開しています。 重要!ご購入後すぐにご連絡ください。手順とボーナスをお送りします!
Apex Patterns PRO インジケーターをご購入いただくと、それに基づいたExpert Advisorを無料でご提供します。 自己最適化するチャートパターンおよびブレイクアウト分析システム 従来のパターンスキャナーは固定のパラメータに依存しているため、市場のボラティリティや構造が変化するとパフォーマンスが低下することがよくあります。 Apex Patterns PROは、構造的なチャートパターン認識、モメンタムフィルタリング、および統計的な自己最適化を単一の分析フレームワークに統合することで、変化する市場環境に適応するように設計されています。 適応型スキャンエンジン 自己最適化パターンモード 最近の履歴データから適切なパターンパラメータを自動的に検索し、静的な設定を使用するのではなく、現在の市場の動きに合わせてインジケーターの構造検出を適応させます。 スマートブレイクアウトフィルタリング 古典的なパターン認識と、モメンタム、ボリューム、プライスアクションの指標を組み合わせます。すべてのブレイクアウトを同じように扱うのではなく、システムが根底にある市場構造を評価し、現在の統計
Neuro Poseidon is a new indicator by Daria Rezueva. It combines precise trading signals with adaptive TP/SL levels - creating best possible trades as a result! Message me and get  Neuro Poseidon Assistant  as a gift to automize your trading process! What makes it stand out? 1. Proven profitability on all assets and timeframes 2. Only confirmed BUY and SELL signals present on the chart 3. Adaptive TP & SL levels generated by the software for each trade 4. Easy to understand - suitable for al
Crystal Heikin Ashi Signals—Professional Trend & Signal Detection Indicator Advanced Heikin Ashi Visualization with Intelligent Signal System for Manual & Automated Trading Final Price: $149 ---------> Price goes up $10 after every 10 sales . Limited slots available — act fast . Overview User Guide PDF Crystal Heikin Ashi Signals is a professional-grade MetaTrader 5 indicator that combines pure Heikin Ashi candle visualization with an advanced momentum-shift detection system. Designed for both m
Break and Retest Hunter is a powerful MetaTrader 5 indicator designed to automatically identify support and resistance levels, breakout structures, and potential retest opportunities in real time. Bonus Indicator: After purchasing Break and Retest Hunter , contact me to receive Trade Indicator Assistant EA completely free as a bonus utility. $65 for the next 10 copies . Next price is $120.  Combining adaptive market analysis, clear BUY/SELL signals, Fibonacci-based profit targets, and a premiu
Power Candles V3 - 自己最適化型強弱インジケーター Power Candles V3は 、通貨や銘柄の強さを、適用されたすべてのチャート上で実行可能なトレードプランに変換します。単にローソク足を色分けするだけでなく、バックグラウンドでリアルタイムの自動最適化を実行し、目の前の銘柄に対して最適なストップロス、テイクプロフィット、およびシグナルの閾値を提示します。ワンクリックで実取引に適用でき、エントリーポイント、ストップロス、テイクプロフィットのラインが正確な価格位置にチャート上に表示され、方向性を示すアラートがリアルタイムで発動します。 このツールは、Stein Investmentsのエコシステムの一部です。  18種類以上のツールをすべて閲覧し、AIを活用したセットアップの推奨事項を入手し、  https://stein.investments でコミュニティに参加しましょう クローズしたバーごとに3,000回以上のトレードシミュレーション。9つの強さの状態。2つの戦略を並行してテスト。勝率の高い設定をワンクリックで適用。 なぜこれが必要なのか ほとんどの強
Unix Scalper — MetaTrader 5 ご購入後、MQL5で私にメッセージをお送りいただくと、Smart Universal Expert Advisorを無料で受け取れるほか、オンライン講座、PDFマニュアル、非公開グループへのアクセスもご利用いただけます。 セットアップを見つけ、取引プランを確認し、取引方法を選ぶ。 UNIX Scalperは、市場分析、BUY/SELL/WAITの判断、Entry、Stop Loss、TP1、TP2の水準を、見やすいパネルにまとめています。 シグナルと取引プランを確認 • 明確な判断:BUY、SELL、WAIT。 • 明示された水準:Entry、Stop Loss、TP1、TP2。 • 複数時間足の一覧:パネル上で各時間足のシグナルを比較。 • 判断を支える分析:トレンド、モメンタム、出来高、ボラティリティ、サポートとレジスタンス、市場の質。 • 選べるレイアウト:Minimized、Compact、Standard、Full。 シグナルと各水準を確認し、そのセットアップがご自身の取引ルールに合うか判断してください。 ゴール
Smart Harmonic Patterns - MetaTrader 5 ご購入後、MQL5で私にメッセージをお送りいただくと、Smart Universal Expert Advisorを無料で受け取れるほか、オンライン講座、PDFマニュアル、非公開グループへのアクセスもご利用いただけます。 MetaTrader 5のチャート上でハーモニック価格構造を確認できます。Smart Harmonic Patternsは、88種類のバリエーション、ATRを基にしたZigZag検出器、表示するパターンや描画を選ぶチャートパネルを組み合わせています。 視覚的な分析と裁量的な取引計画にお使いください。このインジケーターは注文を出したり管理したりしません。表示される参考水準は約定済みの取引ではありません。 注目するパターンを選択 Classic、AB = CD、Antiの3グループを閲覧できます。個別のバリエーションやグループ全体を有効にできます。Gartley、Bat、Butterfly、Crab、Cypher、Sharkと関連バリエーションを収録しています。まずは絞り込まれた初期選択を使い
作者のその他のプロダクト
Gold Sniper Scalper Pro は、XAUUSD における ダマシブレイクアウト(false breakout)パターンの検出に特化した MetaTrader 5 用インジケーターです。価格がレンジの境界を突破してブレイクアウトトレーダーを誘い込み、その後反転してレンジ内に戻る4本バーのトラップ構造を識別します。インジケーターは各セットアップを17の品質要素で採点し、4層コンフルエンスパイプラインで評価し、7タイムフレームトレンドコンセンサスエンジンで検証し、ゴールドボラティリティレジーム分類器でフィルタリングします。すべてシグナルがチャートに表示される前に完了します。 詳細なユーザーガイドは、著者の   MQL5 ブログ   で入手できます。追加の更新は、著者の   MQL5 チャンネル   を通じて入手可能です。 現在のサポートポリシーに基づき、購入者は著者が開発した選定コンパニオンツールへの追加アクセスを受けることができます。 Forex通貨ペア、インデックス、暗号資産でも動作しますが、検出パラメーター、ボラティリティ処理、フィルターロジックはXAUUSD
Range Contraction Break MT5 Quantitative Volatility Compression & Structural Expansion Breakout Engine The Range Contraction Break indicator for MetaTrader 5 provides an algorithmic price action framework designed to detect explosive breakout opportunities emerging from progressive volatility compression cycles. Financial markets constantly alternate between periods of contraction (energy coiling) and directional expansion (energy release). When consecutive candles form progressively narrower ra
OBV Breakout MT5 Quantitative Price Breakout Engine with On-Balance Volume Confirmation The OBV Breakout indicator for MetaTrader 5 provides an algorithmic trading framework engineered to detect directional expansion moves confirmed by underlying volume momentum. Financial markets frequently generate deceptive price breakouts (bull and bear traps) during low-volume consolidation intervals. To filter out low-liquidity market noise, the OBV Breakout engine couples structural high/low price breaks
Gold Cloud Pro for MT5 Systematic Ichimoku Kumo Cloud Breakout and Trend Continuation System on Gold Core Concept and Value Proposition Trading Gold (XAUUSD) while price is trapped inside equilibrium zones presents severe risks: buying or selling inside consolidating boundaries frequently leads to sharp whipsaws, while attempting to guess reversal tops and bottoms often positions traders directly in front of powerful momentum expansions. The central execution challenge lies in identifying the pr
Gold Reflex Pro for MT5 Systematic Dynamic Value Zone Retest and Trend Continuation Validation on Gold Core Concept and Value Proposition Trading Gold (XAUUSD) during trending market conditions often presents severe timing dilemmas: entering after a large expansion candle risks chasing an overextended move right before a sharp corrective retracement, while buying dips or selling rallies prematurely can leave positions exposed to deep corrective swings. The primary challenge lies in identifying t
Gold Trap Reversal Pro for MT5 Systematic False-Breakout Identification and Institutional Liquidity Reversal Validation Core Concept and Value Proposition Gold (XAUUSD) is renowned for aggressive volatility and deceptive liquidity sweeps: price frequently breaches key swing extremes or consolidation boundaries to lure breakout traders into adverse positions, only to snap back violently and rotate in the opposite direction. Retail traders buying breakout peaks or selling breakdowns often absorb h
Trend Momentum Expansion MT5 Systematic Structural Trend Continuation and Momentum Breakout Engine The Trend Momentum Expansion indicator for MetaTrader 5 provides an objective analytical framework designed to identify high-probability trend-continuation setups during active market expansion phases. Intraday traders and scalpers frequently encounter costly execution challenges: entering positions immediately before sharp corrective pullbacks, suffering premature stop-outs from erratic candle wic
Mat Hold Continuation MT5 Systematic Mat Hold Consolidation and Trend-Continuation Engine The Mat Hold Continuation indicator for MetaTrader 5 provides an objective analytical framework designed to identify high-probability trend-continuation setups following structured Mat Hold consolidations. Intraday traders and scalpers frequently encounter execution difficulties during trend pauses: entering prematurely during exhausted moves, misinterpreting shallow counter-trend consolidations as full rev
Separating Lines Continuation MT5 Systematic Trend-Continuation and Counter-Trend Pullback Rejection Engine The Separating Lines Continuation indicator for MetaTrader 5 provides an objective analytical framework designed to identify high-probability trend-continuation setups following counter-trend pullbacks. Intraday traders and scalpers frequently encounter execution errors: entering prematurely during incomplete corrections, suffering stop-outs from extended wicks during routine support tests
HA Doji Reversal MT5 Systematic Structural Indecision Exhaustion and Momentum Reversal Engine The HA Doji Reversal indicator for MetaTrader 5 provides an objective analytical framework designed to identify high-probability turning points following market indecision phases. Active intraday traders and scalpers frequently face costly execution challenges: entering positions immediately before corrective pullbacks, suffering stop-outs from erratic boundary wicks during quiet consolidation, or hesit
HA Momentum Expansion MT5 Systematic Directional Momentum Expansion and Trend Acceleration Engine The HA Momentum Expansion indicator for MetaTrader 5 provides an objective analytical framework designed to identify high-probability trend-continuation setups as directional momentum accelerates. Intraday traders and scalpers frequently encounter costly execution challenges: entering positions immediately before corrective pullbacks, suffering stop-outs from random boundary wicks during quiet conso
HA Pullback Resume MT5 Systematic Trend Retracement and Momentum Resumption Engine The HA Pullback Resume indicator for MetaTrader 5 provides an objective analytical framework designed to identify high-probability trend-continuation setups following shallow corrective pullbacks. Active intraday traders and scalpers frequently encounter execution timing errors during trend pauses: entering prematurely before a correction completes, suffering stop-outs from erratic boundary wicks during quiet cons
HA Three-Candle Momentum MT5 Systematic Directional Momentum Acceleration and Trend-Continuation Engine The HA Three-Candle Momentum indicator for MetaTrader 5 provides an objective analytical framework designed to identify high-probability trend-continuation setups as directional momentum accelerates. Intraday traders and scalpers frequently encounter costly execution challenges: entering positions immediately before a corrective retracement, suffering stop-outs from random boundary wicks durin
HA Two-Bar Reversal MT5 Systematic Structural Swing Exhaustion and Two-Bar Reversal Engine The HA Two-Bar Reversal indicator for MetaTrader 5 provides an objective analytical framework designed to identify high-probability market turning points resulting from structural swing exhaustion. Intraday traders and scalpers frequently encounter costly execution challenges: entering prematurely before a correction completes, getting stopped out by extended wicks around key structural levels, or hesitati
Awesome Saucer Acceleration MT5 Systematic Momentum Acceleration and Cyclical Saucer Continuation Engine The Awesome Saucer Acceleration indicator for MetaTrader 5 provides an objective analytical framework designed to identify high-probability trend-continuation setups as momentum re-accelerates. Active intraday traders and scalpers frequently encounter execution timing errors: initiating positions immediately before corrective pullbacks, suffering stop-outs from erratic boundary wicks during q
CCI EMA Pullback MT5 Systematic Dynamic Value Retracement and Trend Continuation Engine The CCI EMA Pullback indicator for MetaTrader 5 provides an objective analytical framework designed to identify high-probability trend-continuation entries at dynamic value zones. Navigating corrective pullbacks presents persistent timing challenges for intraday traders and scalpers: entering during shallow dips before a full correction develops, suffering stop-outs from random boundary wicks around routine s
ConnorsRSI 2 Pullback MT5 Systematic Trend-Continuation and Short-Term Mean-Reversion Retracement Engine The ConnorsRSI 2 Pullback indicator for MetaTrader 5 provides an objective analytical framework designed to identify high-probability trend-continuation entries at extreme short-term retracement levels. Active intraday traders and scalpers frequently encounter timing errors during corrective phases: entering prematurely before a pullback completes, suffering stop-outs from erratic boundary wi
Hidden Divergence MT5 Systematic Structural Hidden Divergence and Trend Continuation Engine The Hidden Divergence indicator for MetaTrader 5 provides an objective analytical framework designed to identify high-probability trend-continuation setups by tracking momentum resets against structural price swings. Navigating trend retracements presents persistent timing challenges for intraday traders and scalpers: entering prematurely before a deeper correction finishes, suffering stop-outs from exten
RSI Trendline Break MT5 Systematic Momentum Trendline Breakout and Trend Continuation Engine The RSI Trendline Break indicator for MetaTrader 5 provides an objective analytical framework designed to identify high-probability trend-continuation setups by tracking leading momentum breaks. Intraday traders and scalpers frequently encounter execution timing errors on raw price charts: entering immediately before a corrective retracement, suffering premature stop-outs from erratic boundary wicks duri
Stochastic Pullback MT5 Systematic Trend-Continuation and Stochastic Cyclical Retracement Engine The Stochastic Pullback indicator for MetaTrader 5 provides an objective analytical framework designed to identify high-probability trend-continuation entries during cyclical pullbacks. Retail scalpers and intraday traders frequently encounter execution timing errors within established trends: initiating positions immediately before corrective pullbacks, suffering stop-outs from erratic boundary wick
TTM Squeeze Breakout MT5 Systematic Volatility Squeeze and Directional Momentum Expansion Engine The TTM Squeeze Breakout indicator for MetaTrader 5 provides an objective analytical framework designed to identify high-probability breakout opportunities following volatility constriction cycles. Intraday traders and scalpers frequently encounter timing difficulties during low-volatility conditions: entering positions immediately before corrective pullbacks, suffering stop-outs from random boundary
VSA Climax Reversal MT5 Systematic Volume Spread Analysis (VSA) and Institutional Climax Reversal Engine The VSA Climax Reversal indicator for MetaTrader 5 provides an objective analytical framework designed to identify high-probability reversal opportunities resulting from institutional exhaustion and volume absorption. Intraday traders and scalpers frequently encounter timing errors during climactic price extensions: initiating positions into exhausted moves right before a sharp reversal, gett
Momentum Compression Breakout MT5 Systematic Range Compression and Directional Momentum Breakout Engine The Momentum Compression Breakout indicator for MetaTrader 5 provides an objective analytical framework designed to identify high-probability breakout opportunities emerging from market compression phases. Initiating positions inside tight consolidation frequently results in whipsaws from boundary wicks, buying directly into immediate pullbacks, or hesitating until directional momentum has alr
Range Compression Breakout MT5 Systematic Range Compression and Directional Breakout Engine The Range Compression Breakout indicator for MetaTrader 5 provides an objective analytical framework designed to identify high-probability breakout opportunities emerging from consolidation ranges. Navigating tight, range-bound environments presents severe execution risks: taking positions inside quiet ranges frequently leads to whipsaws from boundary wicks, buying into immediate resistance, or entering l
Narrow Range Expansion MT5 Systematic Maximum Range Compression and Volatility Expansion Engine The Narrow Range Expansion indicator for MetaTrader 5 provides an objective analytical framework designed to identify high-probability breakout opportunities following maximum price compression. Navigating stagnant consolidation environments presents severe execution risks: buying into false breaks right before an immediate reversal, suffering stop-outs from random boundary wicks, or hesitating when g
Breakout Retest Continuation MT5 Systematic Structural Breakout Retest and Role-Reversal Continuation Engine The Breakout Retest Continuation indicator for MetaTrader 5 provides an objective analytical framework designed to identify high-probability trend-continuation setups at broken structural boundaries. Trading breakout pullbacks presents distinct execution challenges: entering immediately on initial boundary breaches frequently leads to buying into sudden corrections, getting shaken out by
Range Expansion Breakout MT5 Systematic Volatility Range Expansion and Consolidation Breakout Engine The Range Expansion Breakout indicator for MetaTrader 5 provides an objective analytical framework designed to identify high-probability breakout opportunities emerging from consolidation ranges. Trading within quiet, range-bound environments presents distinct challenges: taking positions inside low-volatility phases frequently leads to whipsaws from boundary wicks, buying into immediate resistan
<h2>Apex Pinch Breakout MT5</h2> <p><strong>Systematic Triangle Compression and Apex Breakout Engine</strong></p> <p>The <strong>Apex Pinch Breakout</strong> indicator for MetaTrader 5 provides an objective analytical framework designed to identify high-probability breakout opportunities emerging from triangular consolidation formations. Trading inside narrowing ranges presents significant timing challenges: navigating within a tightening coil often results in whipsaws from indecisive boundary
Range Contraction Breakout MT5 Systematic Volatility Compression and Directional Expansion Engine The Range Contraction Breakout indicator for MetaTrader 5 provides an objective analytical framework designed to identify high-probability breakout opportunities emerging from market consolidation phases. When price moves through progressively narrower candle ranges, manual monitoring across multiple charts becomes challenging, and tight consolidations frequently produce short-lived fluctuations pri
Session Opening Range Breakout and Directional Flow for MT5 Systematic Session Range Mapping and Intraday Momentum Expansion Validation Core Concept and Value Proposition Navigating early session transitions presents acute execution challenges: attempting to guess market direction prior to sustained volume arrival often leads to premature entries, leaving positions vulnerable to sharp opening shakeouts and low-liquidity whipsaws. Conversely, hesitating while price breaks initial boundaries frequ
フィルタ:
レビューなし
レビューに返信