Trade Map MT5

A clear plan for a breakout and its retest

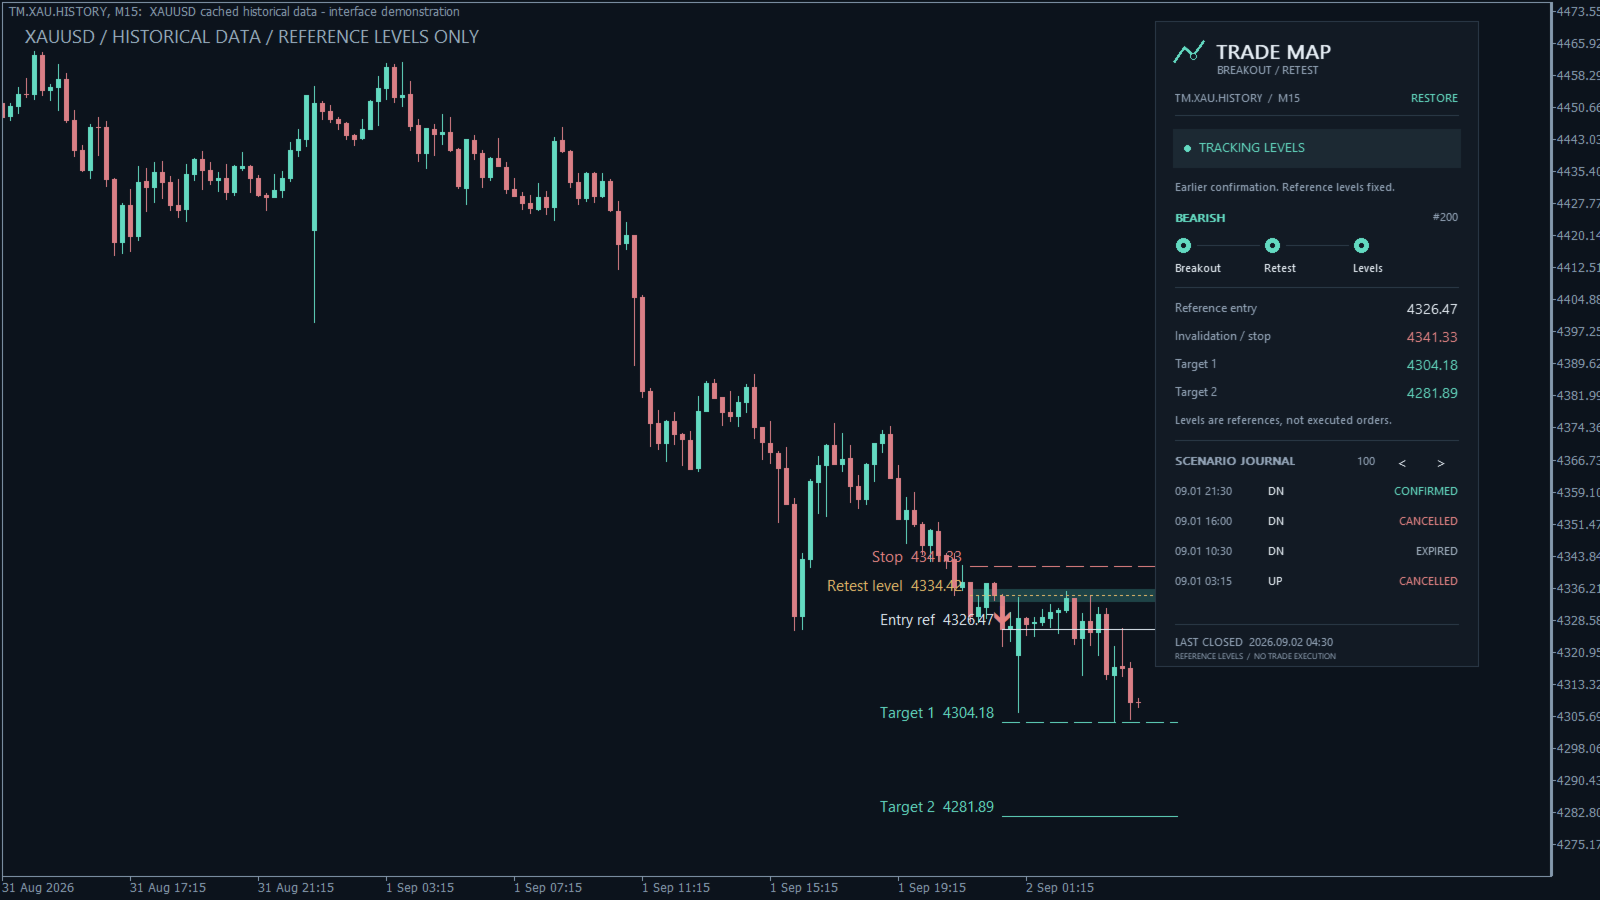
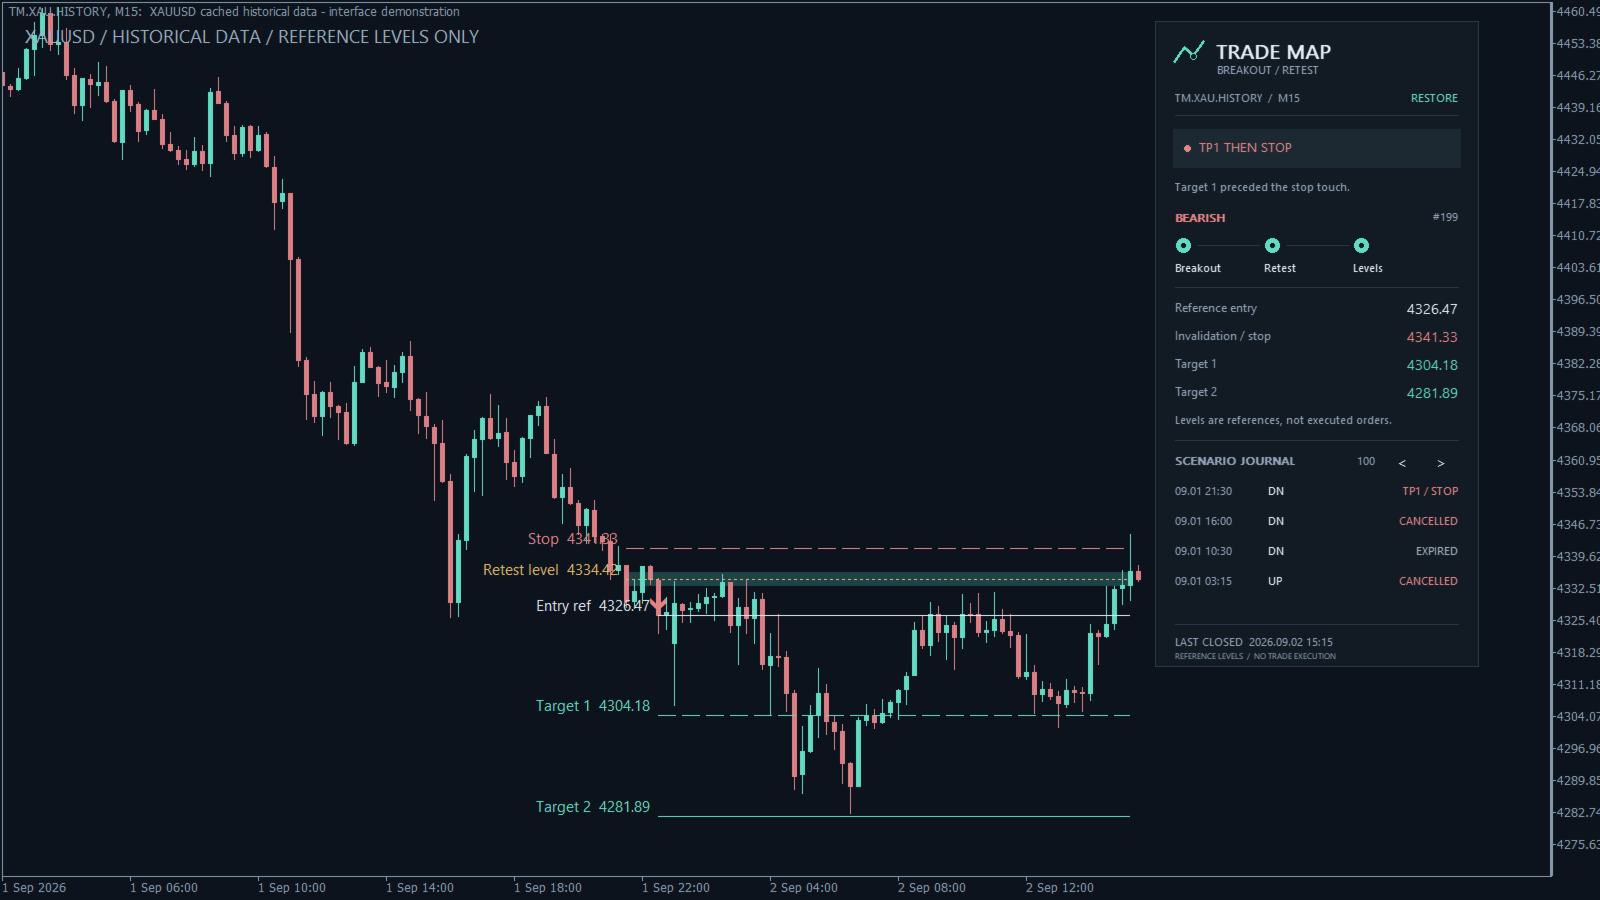
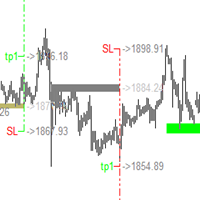
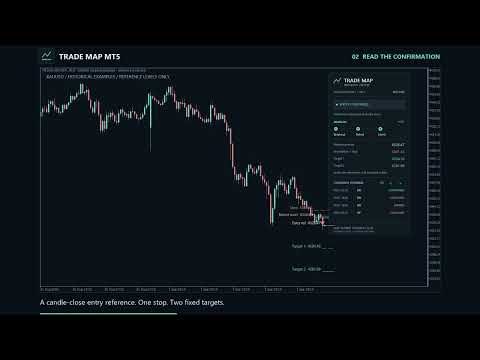
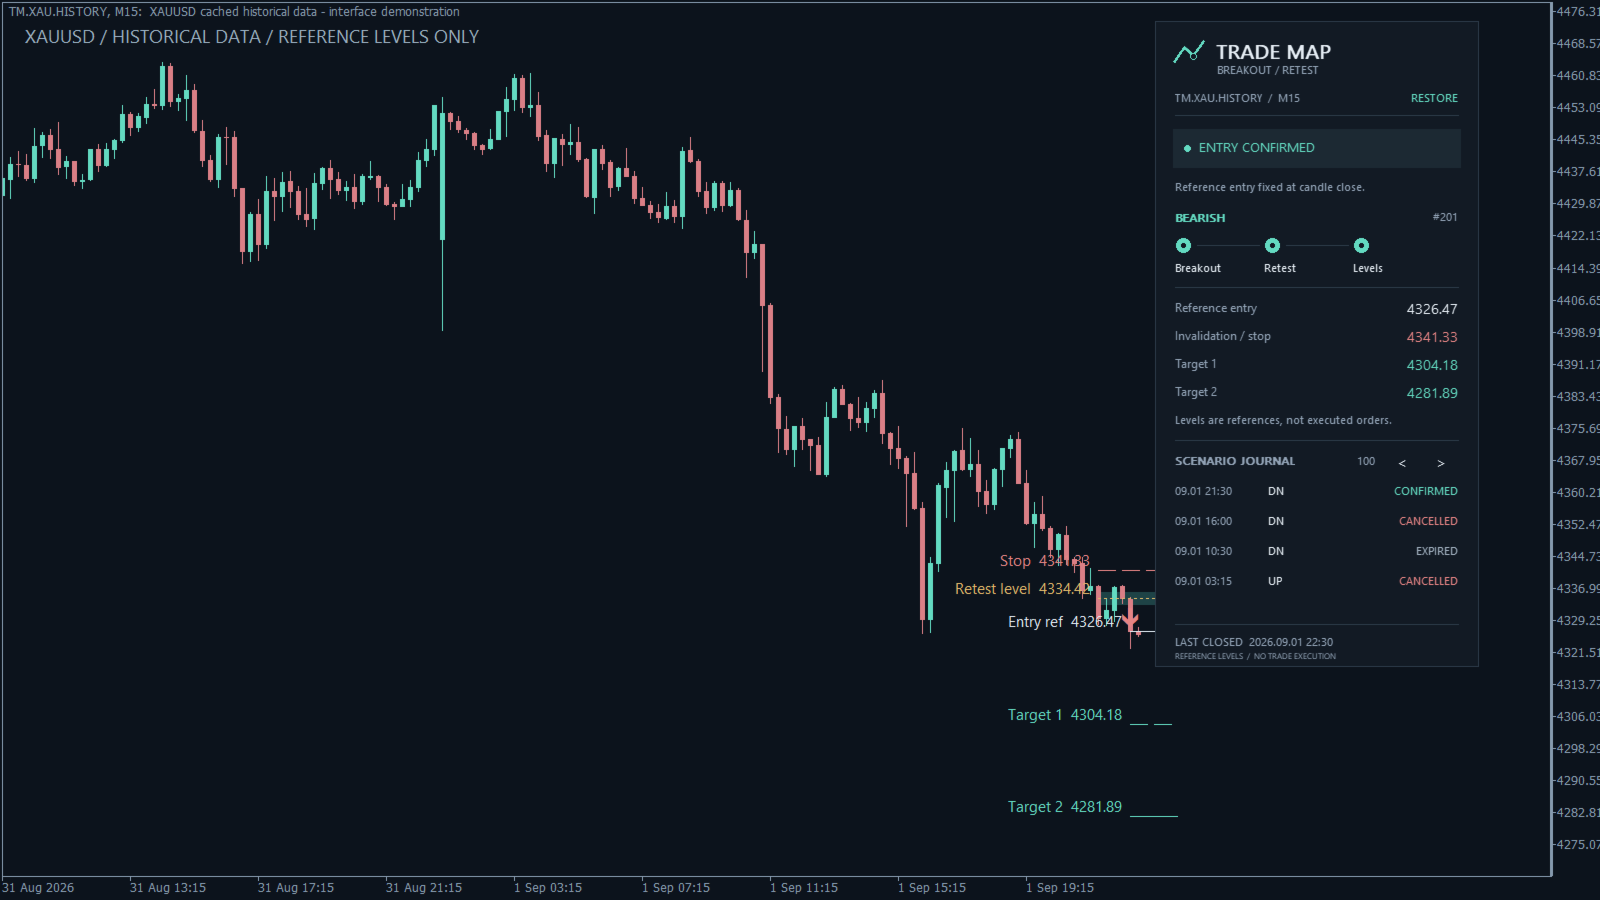
Trade Map follows a completed-candle breakout, waits for price to return to the level, and shows when the confirmation rules have been met. The chart and panel explain the same scenario: what has happened, what is still missing, and where the idea becomes invalid.

Use it as a visual companion to your own trading decisions. The indicator does not place or manage orders.

What you see

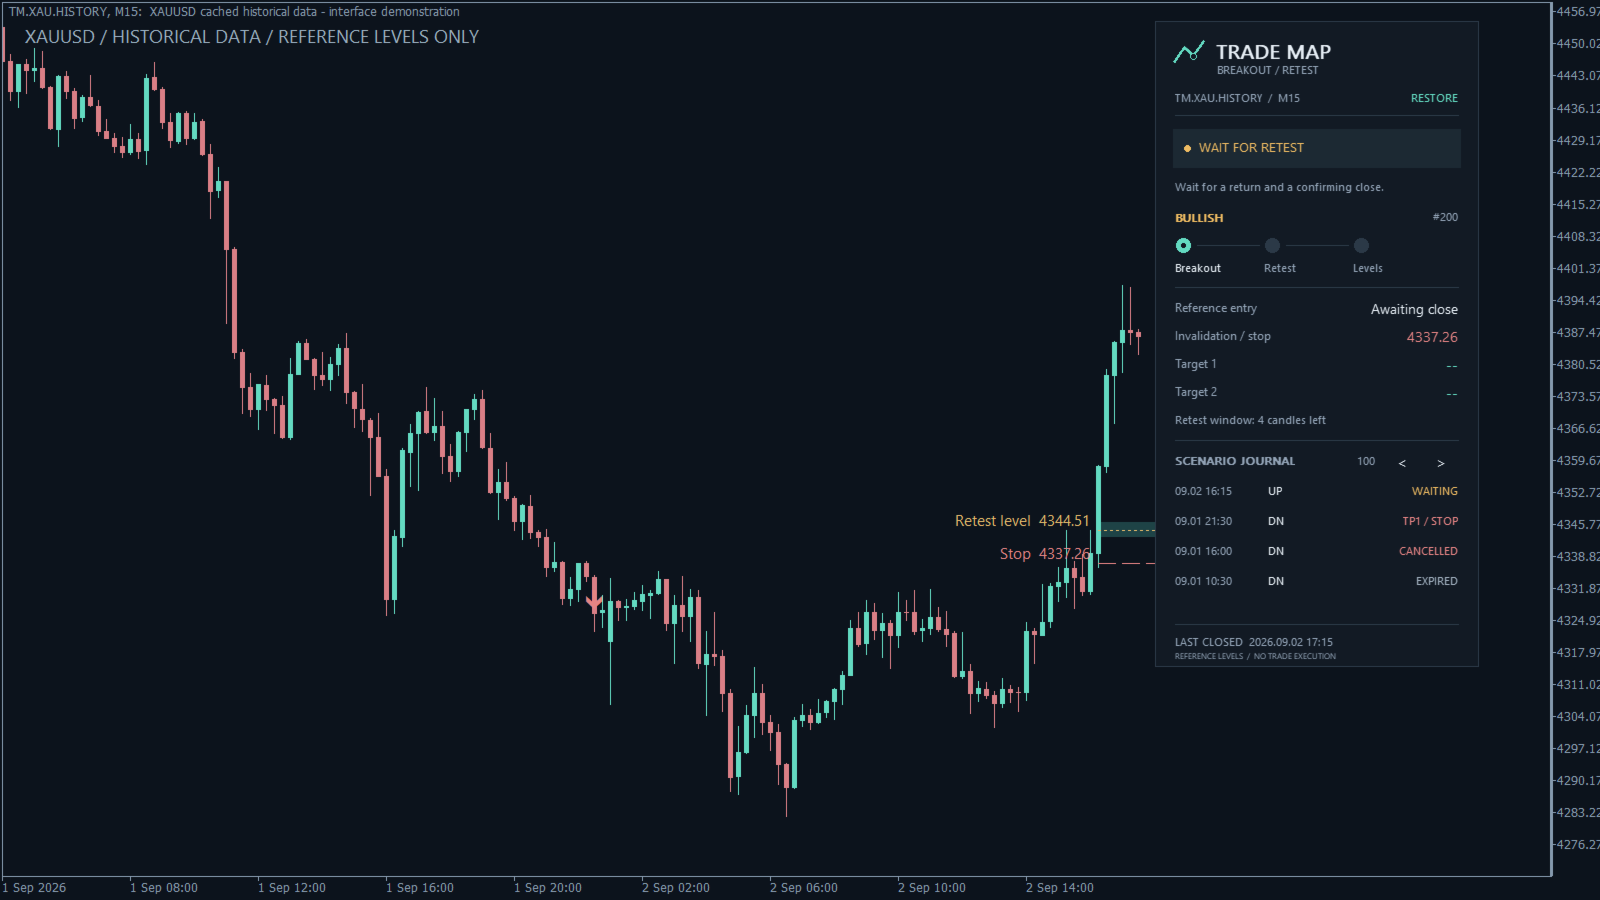
  • A frozen retest zone and an invalidation level after a qualifying breakout.
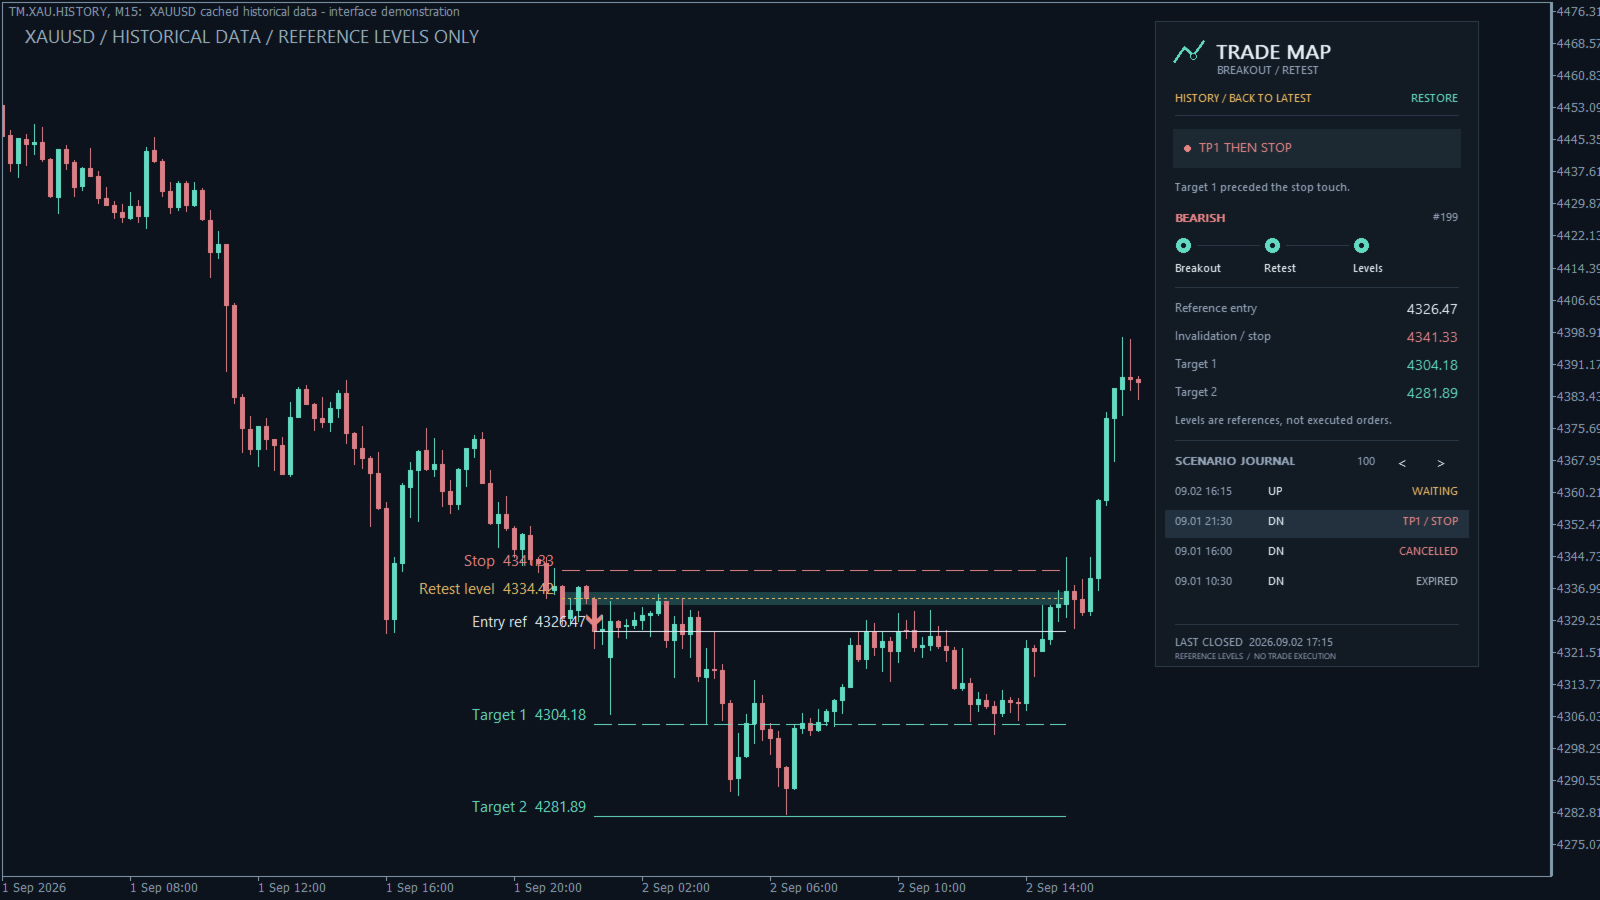
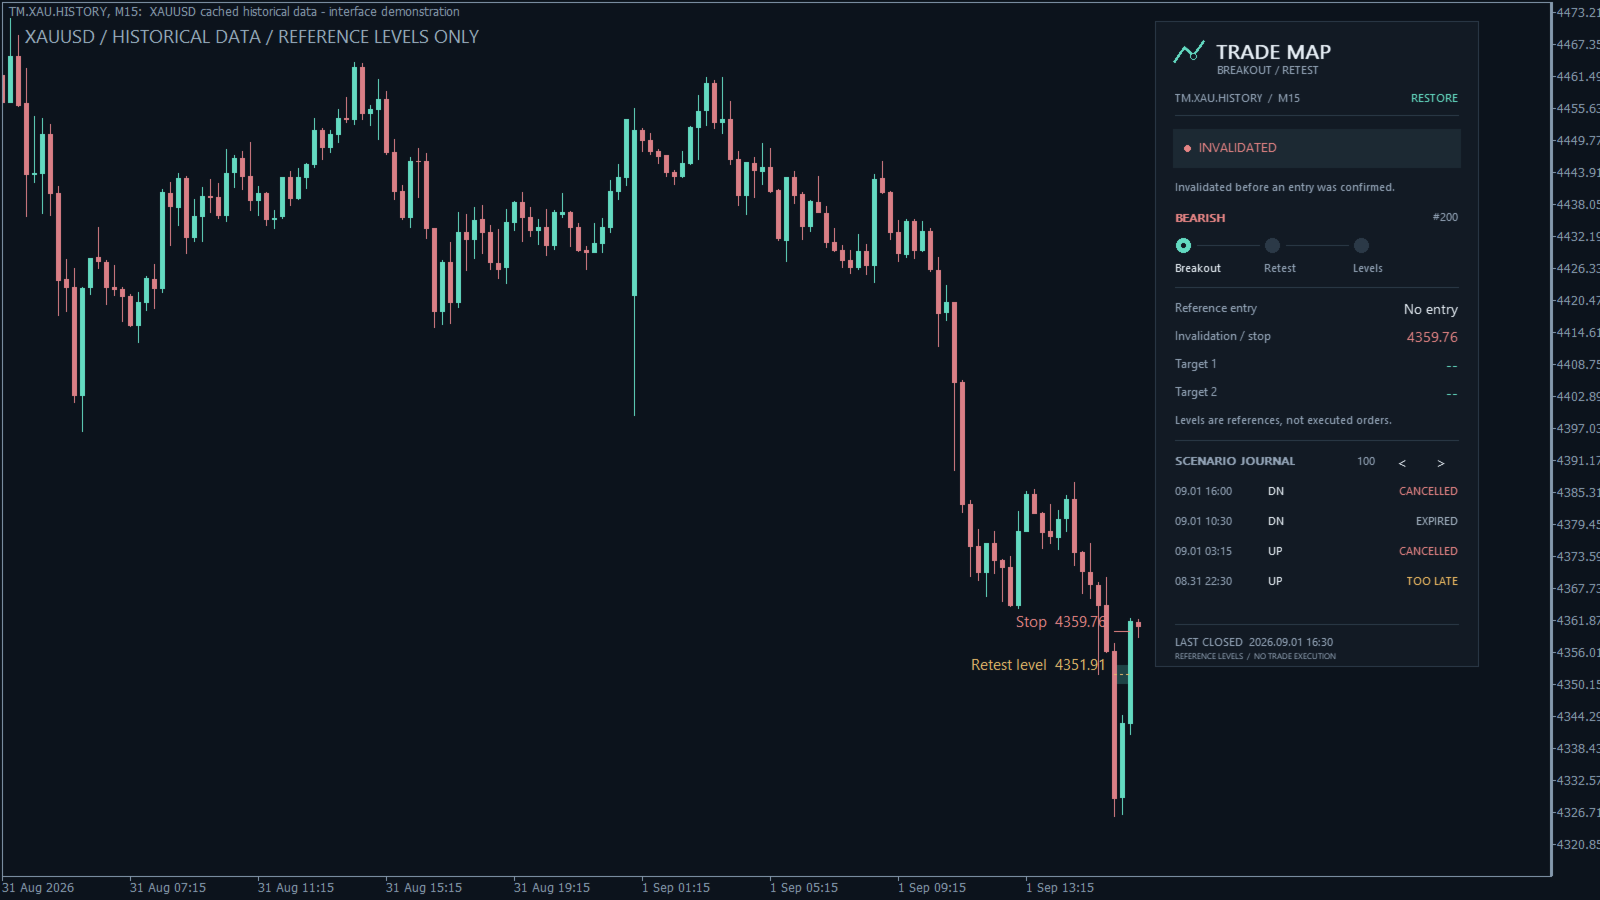
  • A clear waiting, confirmed, expired or invalidated state.
  • A reference entry at the confirmation candle's close, followed by two fixed risk-based targets.
  • Fit Map to bring the scenario's levels into view, with a restore action for your previous scale.
  • A warning when the confirmation closes too far from the breakout level.
  • A scenario journal with waiting, cancelled, expired, stopped and target-touched records. Select a record to review its reference levels on the chart.

A workflow you can inspect

Trade Map uses a previous-candle range, arithmetic ATR and an optional SMA direction filter. Confirmation comes from a completed retest candle. Future candles do not move the confirmed entry, stop or target levels.

After the confirmation candle, the panel switches to tracking the existing levels. It distinguishes an earlier confirmation from a new entry event.

The journal also shows unresolved cases. If a candle touches both a stop and a previously unreached target, its sequence is marked unknown. The indicator does not turn an unknown sequence into a winning result.

The most recent 100 scenarios are retained in memory. History is reconstructed from the configured candle window. Changing settings, available broker history or that window can change the reconstruction.

Getting started

Read the setup guide and FAQ for installation, demo testing and a walkthrough of the scenario states.

Attach Trade Map to a desktop MetaTrader 5 chart and allow enough historical candles to load. The default settings use a 20-candle range, a 14-candle ATR and a 50-candle SMA. The retest window is eight candles; the default targets are 1.5R and 3R.

The screenshots illustrate the interface on historical XAUUSD data. The indicator uses the chart's actual symbol and timeframe, including broker suffixes. Defaults are a starting point for evaluation, not a claim of an optimized or profitable trading strategy.

Test the Market demo in the visual Strategy Tester before deciding whether this workflow suits you. The panel adapts to the chart size; enlarge the chart to show the full journal. Popup alerts are optional and disabled by default.

The visual tester has chart-event limitations. Evaluate states and reference levels there; Fit Map and clickable journal navigation are intended for normal desktop charts.

Reference levels, not trading results

The entry is a candle-close reference. Later high/low touches are observations, not fills. Spread, slippage, commission, price gaps and execution are not modeled. Historical examples do not establish future returns.

No DLL or external service is required. For installation and product questions, use this product's MQL5 comments or MQL5 messaging.
おすすめのプロダクト
このインジケーターは実践的なトレードに最適な自動波動分析のインジケーターです! 場合... 注:   Tang Lun (Tang Zhong Shuo Zen) の命名規則の影響で、私は波のグレーディングに西洋の名前を使用することに慣れていません。基本的な波を ペン 、二次波のバンドを セグメント と名付けました。同時に、 セグメント にはトレンドの方向が指定されます (この命名方法は将来のノートで使用されます。最初に言っておきます)。ただし、アルゴリズムは曲がりくねった理論とはほとんど関係がないため、付けるべきではありません。これは、私の市場分析 によって要約された、絶えず変化する複雑な運用ルール を反映しています。 バンドは標準化され、人によって異なることがないよう定義されており、市場参入を厳密に分析する上で重要な役割を果たす人為的な干渉の描画方法が排除されています。 このインジケーターを使用することは、取引インターフェイスの美しさを改善することと同等であり、元の K ライン取引を放棄し、取引の新しいレベルに連れて行きます。また、宣伝の観点から顧客の認識も向上します。 イ
PLASMA STRIKE — High-Energy Neural Structure Engine PLASMA STRIKE is a high-performance analytical suite engineered for professional traders navigating the extreme volatility of XAUUSD (Gold) and major financial indices. By combining advanced Market Structure Shift (MSS) logic with institutional-grade visual clarity, this system transforms raw price action into a strategic battlefield map. Core Analytical Capabilities Neural Structure Mapping: The engine continuously monitors price behavior to i
Caicai L&S Z-Score Monitor Important Notice: This indicator is an integral tool of the automated EA Caicai Long and Short Pair Trading . If you are looking for the complete automation solution for this strategy, visit the EA page! This indicator monitors Long & Short (Pair Trading) operations by calculating the Z-Score of the spread between two defined assets (Asset Y and Asset X). It is an essential visual tool for identifying mean reversion opportunities. Key Features: Two Calculation Metho
Rejection Zone Predictor PRO – MT5 Indicator Identify where price is most likely to react before it gets there. Rejection Zone Predictor PRO is a price-action based MetaTrader 5 indicator designed to automatically locate and rank potential BUY rejection/support zones below the current market price and SELL rejection/resistance zones above price . Instead of relying on a single support or resistance calculation, the indicator analyzes multiple forms of price-action confluence to determine which h
NeuronStructure reads market structure the way a desk does and labels every event on the exact closed bar that confirmed it, so what you see now is what you would have seen then. It is an indicator for chart analysis only: it draws on the chart, it does not place, modify or close trades, it does not send orders, and it does not manage positions or accounts. It is the market-structure companion to NeuronLiquidity, built to sit alongside it: structure tells you the framework and bias, liquidity te
AURUM MID-QUANT PRO v5.60 Quantitative Excellence for Gold (XAU/USD) & Volatility Trading Gain a professional edge over institutional markets with AURUM MID-QUANT PRO , an advanced Price Action Pattern Detection and Breakout Engine designed exclusively for MetaTrader 5 . Built specifically to capture the unique volatility of Gold (XAU/USD) and other major financial instruments, this powerful indicator combines high-precision algorithmic pattern recognition with real-time dynamic accumulation z
Introduction to Fractal Pattern Scanner Fractal Indicator refers to the technical indicator that makes use of the fractal geometry found in the financial market. Fractal Pattern Scanner is the advanced Fractal Indicator that brings the latest trading technology after the extensive research and development work in the fractal geometry in the financial market. The most important feature in Fractal Pattern Scanner is the ability to measure the turning point probability as well as the trend probabil
Liquidity Map  Overview The Liquidity Map indicator is an advanced visualization tool based on ICT Smart Money Concepts . It automatically identifies daily Buy Zones , Sell Zones , and Liquidity Levels , showing where price is likely to reverse or continue based on institutional order flow. It calculates key levels from the daily session — such as the previous day’s high, low, and midpoint — then derives a premium (sell bias) and discount (buy bias) structure. When price trades into these mapped
このマルチタイムフレームとマルチシンボルインジケーターは、ダブルトップ/ボトム、ヘッド&ショルダー、ペナント/トライアングル、フラグパターンを識別します。ネックライン/トライアングル/旗竿のブレイクアウトが発生した場合にのみアラートを設定することもできます(ネックラインブレイクアウト=上下および頭と肩の確認された信号)。     インジケーターはシングルチャートモードでも使用できます。このオプションの詳細については、製品の     ブログ 。独自のルールとテクニックを組み合わせることで、このインジケーターを使用して、独自の強力なシステムを作成(または強化)できます。 特徴 マーケットウォッチウィンドウに表示されているすべてのシンボルを同時に監視できます。インジケーターを1つのチャートに適用し、市場全体を即座に監視します。 M1からMNまでのすべての時間枠を監視でき、パターンが識別されたとき、またはブレイクアウト時にリアルタイムのアラートを送信します。すべてのMetatraderネイティブアラートタイプがサポートされています。 RSIをトレンドフィルターとして使用して、潜在的な反転を適
Orderflow Super Candles - Simple Footprint Chart Indicator Platform: MetaTrader 5 (MT5)  (The last screenshot shows the use of the DOM tool in conjunction with the product.) 1. Product Introduction Orderflow Super Candles is a professional charting tool based on underlying Tick data analysis, designed to provide traders with a deep "X-ray" view of the market. By parsing the buy and sell volume distribution within each candlestick, this indicator visualizes the hidden market microstructure. It
My Point MT5
Claudia Ramona Angerer
Diagnosis of major and minor pivot Trend detection with many signals Can be used in all symbols Can be used in all time frames Settings: Back Show: The number of candles it displays If you need any adjustments, or have any questions or suggestions, message me How to trade: Blue: sell signal Red: buy signal Blue and red at the same time: no signal Exit signal: Opposite signal
Ali Levels Pro is an indicator designed to identify and draw levels of interest including: Opening Range High/Low with seconds precision,  Previous Session High/Low (if you are a Intraday trader who trades Indices or Commodities maybe you want to know yesterday New York Session high and low),  Overnight Session High/Low,  Previous Day High/Low,  Previous Week High/Low, and  Previous Month High/Low. Traders use this levels as support and resistance levels.  By searching for confluences between
強気と弱気のスリーラインストライクフォーメーションを見つけることに加えて、このマルチシンボルとマルチタイムフレームインジケーターは、次のローソク足パターンをスキャンすることもできます(パターンの説明についてはスクリーンショットを参照してください)。 3人の白人兵士(逆転>継続パターン) 3つの黒いカラス(反転>継続パターン) インジケーター設定の厳密なオプションが有効になっている場合、フォーメーションはより高い時間枠ではあまり頻繁に表示されません。しかし、そうする場合、それは非常に確率の高い設定です。 Thomas Bulkowski(国際的に有名な作家であり、ローソク足パターンの第一人者)によると、3ラインストライクはローソク足パターンの中で最高の全体的なパフォーマンスランクを持っています。このインジケーターを独自のルールや手法と組み合わせると、独自の強力なシステムを作成(または強化)できます。 特徴 マーケットウォッチウィンドウに表示されているすべてのシンボルを同時に監視できます。インジケーターを1つのチャートに適用し、市場全体を即座に監視します。 M1からMNまでのすべての時間枠
H4 Structure Entry Dashboard is a professional multi-timeframe trading assistant that combines H4 market structure with H1/M15 entry confirmation , displayed through a clean on-chart dashboard and clear BUY/SELL arrows . It is designed for traders who want fast, structured decision-making: Structure first (H4) → Entry second (H1/M15). Key Features True multi-timeframe logic Higher timeframe bias from H4 Entry confirmation on H1 or M15 Market Structure Tools (H4) Automatically detects and draws
KT Tether Line MT5
KEENBASE SOFTWARE SOLUTIONS
The KT Tether Line is a trend-following tool consisting of three indicators that work together to generate trading signals. It can correctly identify market trends while signaling trade entries. It was first introduced by Bryan Strain in the Stock & Commodities magazine in 2000 in "How to get with the trend and out at the end." The Concept When a market trend is confirmed, the most challenging part is determining the timing of the entries. This indicator alerts you to potential trend reversals
ENGLISH VERSION (for MQL5 Market) Product Description: RSI Trend & Volatility Dashboard (Multi-Timeframe Filter) This professional dashboard provides traders with an ultimate market overview inside a single chart. It continuously monitors the trend direction across 5 timeframes simultaneously: M5, M15, M30, H1, and D1 [MQL5]. No more tedious chart switching or multi-window clutter – see everything from quick scalping moves to global institutional daily trends in real-time [MQL5]. Key Adva
Man Trend uses at its core the process of identifying the rate of change in price growth and allows you to find entry and exit points from the market. The indicator was created on the basis of the original indicators for searching for extreme points, the indicator is well suited for determining a reversal or a large sharp jerk to one of the sides, thanks to it you will know when this happens, it will notify you with the appearance of a blue dot to buy red to sell. This is a fundamental techni
Insight Pro is a comprehensive tool for market analysis. It offers various features such as trend analysis, resistance and support levels, and distribution analysis, suitable for both novice and experienced traders. Features Trend Analysis Detects and visualizes market trends. Suggests potential entry and exit points based on trends. Customizable trend lines for clear market direction. Displays extreme levels based on standard deviation. Positive slope indicates buy orders; negative slope indic
GannNexus :価格と時間の幾何学の究極の融合 市場に隠された幾何学的構造を解き明かします。 GannNexus v3.00  は、単なるサポート/レジスタンス指標ではありません。これは、 ジョン・マーフィー の古典的な市場構造分析と、 W.D.ギャング の高度な「価格-時間角度」理論、9の平方(Square of 9)の数学、および神聖幾何学を融合させた包括的な分析エンジンです。 精度を求めるトレーダーのために設計されたこのツールは、市場の形状(正方形、三角形、六角形)を自動検出し、主要なピボットから動的なギャン角度を計算し、9の平方の公式を使用して将来の価格/時間ターゲットを投影します。 主な機能 1. 高度なサポート&レジスタンスエンジン 動的なS/Rレベル: 最近のピボットのクラスターに基づいて、重要なサポートおよびレジスタンスゾーンを自動的に識別します。 トレンドライン: 主要な高値と安値を接続する自動トレンドラインを描画し、即時の市場方向を可視化します。 ピボットポイント: スイングハイとスイングローをカスタマイズ可能な矢印で明確にマークします。 2. W.D.
Percent Range PRO
Esmelindro Gedeao Rios Jacobsen
Percent Range PRO Professional percentage-based intraday levels for precision Day Trading. Automatically projects key expansion, support, resistance and exhaustion zones from the previous daily close. Designed for traders who use context and confluence with: • VWAP • Moving Averages • Fibonacci • Price Action • Support & Resistance Works across multiple markets: • Indices • Forex • Gold • Crypto • Futures Automatic daily levels Clean professional visualization MT4 & MT5 compatible Precis
Send me a message so I can send you the setfile 複数の構成が可能な堅牢なロボット 以下のスクリーンショットの設定を使用して、10 分間の時間枠で BTC を使用します。 エキスパート ロボットを購入すると、ボットを継続的に改善するために変更を要求する権利があります。 主な特徴 移動平均クロスオーバー戦略: EA は 2 つの移動平均 (MA1 と MA2) を使用して取引シグナルを生成します。 より速い MA (MA1) がより遅い MA (MA2) より上または下にクロスオーバーすると、取引がトリガーされます。 マーチンゲール戦略: 取引で損失が発生した場合、次の取引のロット サイズは乗数 (martingaleMultiplier) によって増加されます。 マーチンゲール シーケンスは、トレードが成功した後、またはマーチンゲール ステップの最大数 (maxMartingale) に達したときにリセットされます。 リスク管理: ストップロス(SL)とテイクプロフィット(TP)のレベルは設定可能です。 利益を確定し
The  OBV MTF  is an Enterprise-grade On-Balance Volume indicator that transforms standard OBV into a complete trading system. It combines gradient-aware momentum analysis, divergence detection, multi-timeframe alignment, and dynamic customisable midpoint-filtering in a single intuitive professional volume analysis tool. Core Features 1. 5-State Momentum Engine Aqua (Strong Bullish) : OBV slope rising with positive acceleration SteelBlue (Weak Bullish) : OBV rising but losing momentum Gray (Neutr
MACDmaxmin
Carlos Andrés Moya Erazo
3 (2)
The indicator shows when there are overpricing and divergences over a normalized MACD Plus, it displays signals with configurable alerts, self-regulating dynamic overprice levels, and a simple setup and interface. The indicator that automatically calculates overprices ranges! MACDmaxmin is an indicator based on the MACD oscillator that effectively identifies trend changes in price, as it is a momentum indicator that captures the trend and shows the relationship between two moving averages of th
N/B: All our product purchase comes with our free ‘’DAILY   SCALPER EA’’ -   bit.ly/4qlFLNh Whatsapp Developer for yours after successful purchase PROFESSIONAL DOUBLE TOP/BOTTOM PATTERN SCANNER The Ultimate Reversal Trading System for Forex & Crypto Traders  TRANSFORM YOUR TRADING WITH INSTANT PATTERN RECOGNITION Are you tired of missing profitable reversal setups? Exhausted from staring at charts for hours, trying to spot double tops and bottoms? Frustrated with false breakouts and misse
I  recommend you to read the   product's blog  (manual) from start to end so that it is clear from the beginning what the indicator offers. This multi time frame and multi symbol indicator scans for engulfing and tweezer formations.  The indicator can also be used in single chart mode. Combined with your own rules and techniques, this indicator will allow you to create (or enhance) your own powerful system. Features Can monitor all symbols visible in your Market Watch window at the same time. A
This multi time frame and multi symbol indicator scans for pin bars. Combined with your own rules and techniques, this indicator will allow you to create (or enhance) your own powerful system. Features Can monitor all symbols visible in your Market Watch window at the same time. Apply the indicator to just one chart and instantly monitor the entire market. Can monitors every time frame, from M1 to MN, and sends you a real-time alert when a pin bar is identified. All Metatrader native alert types
TREND HARMONY MT5 – Multi Timeframe Trend and Phase and Pullback Level Visualizer indicator for Metatrader5 The TREND HARMONY indicator automates deep trend analysis and generates visualizations for you. Take control of your trades by eliminating uncertainty! Revolutionize your trading experience with precision and insight through the TREND HARMONY Multi Timeframe indicator – your ultimate MT5 trend visualization indicator. [  Features and Manual   | MT4 version |   All Products   ] Are you tir
is a versatile analytical tool designed for both advanced traders and beginners. It combines classic trend line analysis with automatic Fibonacci level plotting to deliver precise market entries and structural clarity. Built as an intuitive and clean on-screen dashboard, this indicator simplifies multi-timeframe analysis without cluttering your main workspace. Technical Analysis and Entry Points The indicator automates the most critical aspects of price action and structural trading: Trend L
KT Fisher Transform is an advanced version of the original Fisher Transform oscillator equipped with divergence detection, crossover alerts, and many more features. Originally it was developed by John F. Ehlers. It converts the asset's price into a Gaussian normal distribution to find the local extremes in a price wave.  Features A light-weighted oscillator that efficiently identifies the upward and downward crossovers and marks them using vertical lines. It also finds regular and hidden diverg
Adaptive SR Zones – Breakout Edition Adaptive SR Zones is a next-generation MetaTrader 5 indicator that automatically maps support and resistance zones and tracks breakout activity in real time. Designed for traders who rely on market structure and zone confluence, it combines multi-timeframe analysis , breakout confirmation logic , and customizable alerts into one powerful tool. No repainting. Core Features Dynamic Support & Resistance Mapping Detects zones from swing highs/lows and reaction po

このプロダクトを購入した人は以下も購入しています
この製品は 2026 年の市場向けに更新され、最新の MT5 ビルドに最適化されています。 価格更新のお知らせ: Smart Trend Trading System は現在 $99 で提供されています。 次の 30 件の購入 後、価格は $199 に上がります。 特別オファー: Smart Trend Trading System を購入後、私にプライベートメッセージを送ることで、 Smart Universal EA を無料 で受け取り、Smart Trend のシグナルを自動売買に変えることができます。 Smart Trend Trading System は、リペイントなし、再描画なし、遅延なしの完全なトレーディングシステムです。よりクリーンなシグナル、より明確なトレンド方向、そしてより整理された取引方法を求めるトレーダー向けに作られています。 Learn Smart Trend Trading System Everything you need to learn, install, and use the product is available here: Online
Trend Sniper X
Sarvarbek Abduvoxobov
4.84 (25)
Trend Sniper X は、トレードの方向性と潜在的な反転ポイントを明確かつ正確に特定するのに役立つ、MetaTrader 5 用のマルチタイムフレーム・トレンドフォロー指標です。 MT4用: https://www.mql5.com/en/market/product/193245 価格情報: 現在の価格はプロモーション価格であり、今後のアップデートや新機能のリリースに伴い変更される場合があります。 ボーナス特典: このインジケーター用の無料自動売買アシスタントEAを入手するには、購入後に an 著者(開発者)へメッセージをお送りください。 Code2Profit チャンネル マルチタイムフレーム分析で相場をマスターしよう! Trend Sniper X で勝率を最大化する方法:重要なルールとセッションのコツ 技術仕様 プラットフォーム MetaTrader 5 インジケータータイプ マルチタイムフレーム・トレンドインジケーター 操作タイムフレーム あらゆるチャートタイムフレームに対応。個別に選択可能な上位タイムフレーム (M1–MN1) を搭載 主要銘柄 FX、ゴールド (X
Neuro Poseidon is a new indicator by Daria Rezueva. It combines precise trading signals with adaptive TP/SL levels - creating best possible trades as a result! Message me and get  Neuro Poseidon Assistant  as a gift to automize your trading process! What makes it stand out? 1. Proven profitability on all assets and timeframes 2. Only confirmed BUY and SELL signals present on the chart 3. Adaptive TP & SL levels generated by the software for each trade 4. Easy to understand - suitable for al
UNIX Scalper — Gold Scalping Indicator for MetaTrader 5 UNIX Scalper is a focused Gold scalping indicator designed primarily for XAUUSD on M1, M2, M3, M5, M10 and M15. It gives the trader a clear BUY, SELL or WAIT decision together with the complete trade plan: Entry, Stop Loss, TP1 and TP2 . PRICE UPDATE NOTICE: Currently available for $199. The price will   increase to $399   after the next   30 purchases . The concept is simple: wait for the signal, follow the levels, move the Stop Loss to
M1 SNIPER は使いやすいトレーディングインジケーターシステムです。M1時間足向けに設計された矢印インジケーターです。M1時間足でのスキャルピングのためのスタンドアロンシステムとして、また既存のトレーディングシステムの一部としても使用できます。このトレーディングシステムはM1時間足での取引に特化して設計されていますが、他の時間足でも使用できます。元々、この手法はXAUUSDとBTCUSDの取引用に設計しましたが、他の市場においても役立つと考えています。 インジケーターのシグナルは、トレンドの方向と逆方向に取引できます。インジケーターのシグナルを利用して両方向に取引するのに役立つ特別な取引テクニックをご紹介します。この手法は、特別な動的なサポートとレジスタンスの価格帯を利用することに基づいています。 ご購入後、M1 SNIPER矢印インジケーターをすぐにダウンロードできます。さらに、M1 SNIPERツールのすべてのユーザーに、以下のスクリーンショットに表示されているApollo Dynamic SRインジケーターを無料で提供しています。この2つのインジケーターを組み合わせることで
この製品は 2026 年の市場向けに更新され、最新の MT5 ビルドに最適化されています。 価格更新のお知らせ: Atomic Analyst は現在 $99 で提供されています。 次の 30 件の購入 後、価格は $199 に上がります。 特別オファー: Atomic Analyst を購入後、私にプライベートメッセージを送ることで、 Smart Universal EA を無料 で受け取り、Atomic Analyst のシグナルを自動売買に変えることができます。 Atomic Analyst は、リペイントなし、再描画なし、遅延なしの Price Action トレーディングインジケーターで、手動取引、シグナルの明確化、EA 自動化のために設計されています。 User manual: settings, inputs and strategy.   &   User Manual PDF . 価格行動、強さ、モメンタム、マルチタイムフレーム方向、高度なフィルターを分析し、トレーダーがノイズを減らし、弱いセットアップを避け、より構造化された取引判断を行えるようにします。 このイ
SUPERHEROインジケーターは、「オールインワン」方式に基づいて設計された多通貨対応の取引システムです。このインジケーターは市場を独自に分析し、取引の開始および終了のタイミングに関するシグナルを提供します。ストップロス注文とテイクプロフィット注文を使用します。R:R比率は1:1です。 私は時折、このシステムのシグナルに基づいて自ら取引を行いますが、その結果は以下の通りです— ライブシグナル このシステムはスマートフォンにプッシュ通知を送信できるため、PCに縛られることなく「外出先」からでも取引を行うことができます。自己勘定取引を行う企業に最適です。 すべてのお客様への特典: このインジケーターをご購入いただいたすべてのお客様に、私から特別なユーティリティをプレゼントいたします。その内容は以下の通りです: 自動的にストップロス注文とテイクプロフィット注文を発注します 価格が目標水準に達すると、自動的に取引を決済します 指値注文による取引に対応しています 平均化取引モードに対応しています この優れた、しかも非常に便利なユーティリティをプレゼントとして受け取りたい場合は、SUPERHER
時折、私自身もこのシステムを使って取引を行っています。 実口座での私の手動による「BOMBER」トレードをぜひご評価ください - LIVE SIGNAL このインジケーターを購入された方には、以下の特典を 無料 で提供しています: 各トレードを自動で管理し、ストップロスとテイクプロフィットを設定し、戦略ルールに基づいてポジションを決済する補助ツール 「Bomber Utility」 様々な銘柄に合わせたインジケーターの設定ファイル(セットファイル) 「最小リスク」、「バランスリスク」、「待機戦略」 の3つのモードで使用できる Bomber Utility 用の設定ファイル このトレーディング戦略をすぐに導入・設定・開始できる ステップバイステップのビデオマニュアル ご注意: 上記の特典を受け取るには、MQL5のプライベートメッセージシステムを通じて販売者にご連絡ください。 オリジナルのカスタムインジケーター 「Divergence Bomber(ダイバージェンス・ボンバー)」 をご紹介します。これは、MACDのダイバージェンス(乖離)戦略に基づいた 「オールインワン」型のトレーディン
伝説が帰ってきました:Entry Points Pro 10。 MQL5 Marketのトップ3に3年間入り続けた伝説的インジケーターの再始動です。 2つのバージョンで合計589件の高評価レビュー、毎日数千人のトレーダーが実際のトレードに使用し、デモのダウンロードは31,000件以上   MT4+MT5 。 私はこの5年間に寄せられたレビューをすべて読み、約束を並べる代わりに、その答えをバージョン10に組み込みました。1999年から相場に携わり、 誠実さ、自らの評判、そして顧客を大切にする 作者による製品です。 Entry Points Proのエントリーシグナルは、リペイント(再描画)を一切行いません。 そして今回初めて、これは作者の言葉ではなく検証可能な事実になりました。確定シグナルはローソク足の終値確定後にのみ表示され、自動テストで リペイントはゼロ と確認されています(EURUSD、XAUUSD、BTCUSDで2,486,568回の不変条件チェック、違反0件)。検証方法は公開されており、ストラテジーテスターでご自身で再現できます。 ご購入後は、必ずすぐにダイレクトメッセージでご
UZFX {SSS} スキャルピング・スマートシグナル v5.0 MT5は、変動の激しい市場において正確かつリアルタイムのシグナルを求めるスキャルパー、デイトレーダー、スイングトレーダー向けに設計された、リペイントのない高性能な取引インジケーターです。(UZFX-LABS)によって開発されたこのインジケーターは、価格行動分析、トレンド確認、スマートフィルタリングを組み合わせることで、すべての通貨ペアおよび時間枠において、高確率の売買シグナル、警告シグナル、トレンド継続の機会を生成します。 トレードの判断に迷うのはもうやめましょう。明確さ、正確さ、そして規律ある市場執行を求めるトレーダーのために設計された、体系的なシグナルシステムに従い始めましょう。 間違いなく、MQL5で入手可能な最高のインジケーターの一つです。絶対に見逃さないでください!!「スマートなトレーダーのためのスマートシグナル」 最新バージョン5.0がリリースされました。価格は予告なく最大499.99ドルまで値上がりする可能性がありますので、チャンスを逃さないようお早めにお求めください!! 購入を決める前に!無料トライアル
Azimuth Pro
Ottaviano De Cicco
5 (7)
Azimuth Pro V2:MT5向けシンセティック・フラクタル構造分析と確認済みエントリー 概要 Azimuth Pro は Merkava Labs によるマルチレベルスイング構造インジケーターです。4つのネストされたスイングレイヤー、スイングアンカーVWAP、ABCパターン検出、3タイムフレーム構造フィルタリング、そして確定バーでの確認済みエントリー — 1つのチャートで、ミクロスイングからマクロサイクルまでを網羅するワークフロー。 これはブラインドシグナル製品ではありません。ロケーション、コンテキスト、タイミングを重視するトレーダーのための構造ファーストワークフローです。 ️ サマーセール — 夏至とThe Oracle Proの発売を記念して、Azimuth Proが30%オフ。現在279 USD(通常399 USD)。期間限定の夏季オファー。 1. V2での変更点 シンセティック・マルチタイムフレームエンジン 上位タイムフレーム分析をMeridian Proと同じ独自のシンセティックアーキテクチャで一から再構築。よりクリーンなHTFコンテキスト、安定したライブ動作、
この製品は 2026 年の市場向けに更新され、最新の MT5 ビルドに最適化されています。 価格更新のお知らせ: Smart Price Action Concepts は現在 $200 で提供されています。 次の 30 件の購入 後、価格は $299 に上がります。 特別オファー: 購入後、私にプライベートメッセージを送ることで、 無料ボーナス + ギフト を受け取ることができます。 まず、このトレーディングツールはリペイントなし、再描画なし、遅延なしのインジケーターであり、プロフェッショナルな取引に最適であることを強調しておきます。 [Online course] ,   [User Manual]  ,  [How to Install]  ,   [PDF] Smart Price Action Concepts Indicator は、初心者から経験豊富なトレーダーまで使える非常に強力なツールです。20 種類以上の便利なインジケーターを 1 つにまとめ、Inner Circle Trader Analysis や Smart Money Concepts Trading S
Power Candles V3 - 自己最適化型強弱インジケーター Power Candles V3は 、通貨や銘柄の強さを、適用されたすべてのチャート上で実行可能なトレードプランに変換します。単にローソク足を色分けするだけでなく、バックグラウンドでリアルタイムの自動最適化を実行し、目の前の銘柄に対して最適なストップロス、テイクプロフィット、およびシグナルの閾値を提示します。ワンクリックで実取引に適用でき、エントリーポイント、ストップロス、テイクプロフィットのラインが正確な価格位置にチャート上に表示され、方向性を示すアラートがリアルタイムで発動します。 このツールは、Stein Investmentsのエコシステムの一部です。  18種類以上のツールをすべて閲覧し、AIを活用したセットアップの推奨事項を入手し、  https://stein.investments でコミュニティに参加しましょう クローズしたバーごとに3,000回以上のトレードシミュレーション。9つの強さの状態。2つの戦略を並行してテスト。勝率の高い設定をワンクリックで適用。 なぜこれが必要なのか ほとんどの強
通貨強さウィザードは、取引を成功させるためのオールインワン ソリューションを提供する非常に強力な指標です。このインジケーターは、複数の時間枠のすべての通貨のデータを使用して、このまたはその外国為替ペアのパワーを計算します。このデータは、使いやすい通貨インデックスと通貨パワーラインの形式で表され、特定の通貨のパワーを確認するために使用できます。 必要なのは、取引したいチャートにインジケーターを接続することだけです。インジケーターは、取引する通貨の実際の強さを示します。このインジケーターは、トレンドに合わせて取引するときに有利に利用できる売買高の圧力の極値も示します。このインジケーターには、フィボナッチに基づく可能なターゲットも表示されます。 このインジケーターは、PUSH 通知を含むあらゆるタイプのアラートを提供します。 購入後ご連絡下さい。私の取引のヒントをあなたと共有し、素晴らしいボーナスインジケーターを無料で提供します! 幸せで有益な取引をお祈りします。
AXIOM MATRIX MT5 ローンチ価格:$99 Axiom Matrix はローンチ価格 $99 でご利用いただけます。 最初の30件の購入後、価格は $199 に上がります。 ご購入後、手順のご案内と限定ギフトボーナスの受け取りのために、直接DMをお送りください。 Axiom Matrix は、MetaTrader 5 用のプロフェッショナルなマルチシンボル・マルチタイムフレーム市場スキャナー兼意思決定ダッシュボードです。 Market Watch をスキャンし、複数の時間足を分析し、複数のエビデンスエンジンを読み取り、最も強いチャンスを比較し、1つのクリーンなマトリックスダッシュボード内で最適な BUY、SELL、WAIT、またはブロック状態を表示します。 私が Axiom Matrix を作った理由は、市場スキャンという重い作業を代わりに行ってくれる1つのツールが欲しかったからです。 RSI だけを確認したくありませんでした。 次に MACD だけ。 次に移動平均線。 次に出来高。 次にボラティリティ。 次にサポートとレジスタンス。 そして、1つのトレードアイデアを作るた
note: this indicator is for METATRADER4, if you want the version for METATRADER5 this is the link:  https://www.mql5.com/it/market/product/108106 TRENDMAESTRO ver 2.5 TRENDMAESTRO recognizes a new TREND from the start, he never makes mistakes. The certainty of identifying a new TREND is priceless. DESCRIPTION TRENDMAESTRO identifies a new TREND in the bud, this indicator examines the volatility, volumes and momentum to identify the moment in which there is an explosion of one or more of these da
SR Liquidity は、市場の流動性が集中し、価格が最も強く反応する「隠れたゾーン」を可視化するために設計されたトレーディング指標です。こうした流動性の高いエリアは強力なサポート(支持)およびレジスタンス(抵抗)レベルとして機能し、市場が反転する可能性が最も高いポイントを明確に示してくれます。 単なる一般的なサポートラインやレジスタンスラインを描画するのではなく、「SR Liquidity」は実際の価格変動を分析し、売りと買いの圧力が集中するゾーンを特定します。これらは、市場の真の動きを牽引する「流動性のプール(溜まり場)」そのものです。それらをチャート上に直接可視化することで、価格が実際に反応する前に、その動きを予測することが可能になります。つまり、このインジケーターは価格の方向性が変わる可能性を予測するのです。生のプライスアクションを、市場の重要な水準(転換点となり得るポイント)を示す、明確で実用的なロードマップへと変換してくれます。 このインジケーターは、FX、株価指数、貴金属、仮想通貨など、あらゆる銘柄や時間足で使用可能です。 ご購入後、取引手順や無料の優れた追加インジケ
Smart Market Structure Pro by G-Labs — ICT and Smart Money Concepts toolkit with built-in multi-symbol scanner for MetaTrader 5. Break of structure, change of character, order blocks, fair value gaps, liquidity sweeps, premium and discount zones, ICT sessions, confluence scoring, AI trade ideas, and a traffic-light scanner across up to 30 pairs and four timeframes from one chart. Map SMC and ICT on the active chart while the built-in scanner monitors your full watchlist. Each cell shows BUY, S
現在33%オフ 初心者にもエキスパートトレーダーにも最適なソリューション このインジケーターは独自の機能と新しい公式を多数内蔵しており、ユニークで高品質かつ手頃な取引ツールです。このアップデートでは、2つの時間枠ゾーンを表示できるようになります。より長いTFだけでなく、チャートTFとより長いTF(ネストゾーンを表示)の両方を表示できます。すべてのSupply Demandトレーダーの皆さんのお気に召すはずです。:) 重要情報の公開 Advanced Supply Demandの可能性を最大化するには、 https://www.mql5.com/ja/blogs/post/720245 にアクセスしてください。   エントリーまたはターゲットの正確なトリガーポイントを正確に特定できれば取引がどのように改善されるか想像してみてください。新しい基盤となるアルゴリズムに基づいて構築されているため、買い手と売り手の間の潜在的な不均衡をさらに簡単に特定できます。これは、最も強い需要と供給のゾーンと、過去のパフォーマンス(古いゾーンを表示)がグラフィカルに表現されるためです。これらの機能は、最適な
M1 Quantum MT5
Hamed Dehgani
4.27 (11)
M1 Quantum を使用したライブトレードシグナル : シグナル (取引は 自動的に Quantum Trade Assistant によって実行され、この製品に 無料 で含まれています。) 最新ニュース: バージョン1.64がリリースされました。現在、すべての取引で、関連するサポート/レジスタンスゾーンの後ろにStop Lossが設定されます。今回のバージョンでは、EAのパフォーマンスを向上させるためにSmart Close機能も改善されました。 8月9日から、ライブシグナルはバージョン1.64で稼働しています。 価格プラン: 現在価格: $169 (早期購入者向けオファー) 次回予定価格: $189 予定小売価格: $299 開発者からのお知らせ: ご購入後、 最新の推奨設定ファイル(Set File) 、運用アドバイス、および他の M1 Quantum ユーザーと交流できる VIPサポートグループ への招待をご希望の場合は、お気軽にご連絡ください。 よくある質問 - 設定ファイル - インストールガイド M1 Quantum は、M1専用のプロフェッショナルトレーディング
優れたテクニカルインジケーター「Grabber」をご紹介します。これは、すぐに使える「オールインワン」トレーディング戦略として機能します。 ひとつのコードに、市場のテクニカル分析ツール、取引シグナル(矢印)、アラート機能、プッシュ通知が強力に統合されています。 このインジケーターを購入された方には、以下の特典を無料で提供します: Grabberユーティリティ:オープンポジションを自動で管理するツール ステップバイステップのビデオマニュアル:インジケーターのインストール、設定、取引方法を解説 カスタムセットファイル:インジケーターをすばやく自動設定し、最大限の成果を出すための設定ファイル 他の戦略はもう忘れてください!Grabberだけが、あなたを新たなトレードの高みへと導いてくれるのです。 Grabber戦略の主な特徴: 推奨タイムフレーム:M5〜H4 対応通貨ペア・資産:どれでも使用可能ですが、私が実際に検証した以下を推奨します(GBPUSD、GBPCAD、GBPCHF、AUDCAD、AUDUSD、AUDSGD、AUDCHF、NZDUSD、NZDCAD、EURCAD、EURUSD、E
TPA True Price Action indicator reveals the true price action of the market makers through 100% non-repainting signals strictly at the close of a candle! TPA shows entries and re-entries, every time the bulls are definitely stronger than the bears and vice versa. Not to confuse with red/green candles. The shift of power gets confirmed at the earliest stage and is ONE exit strategy of several. There are available now two free parts of the TPA User Guide for our customers. The first "The Basics"
Boom & Crash & PainX & GainX Ultimate Spike Detector Trade Spikes With Confidence — Not Guesswork Catching spikes should be one of the most profitable strategies in synthetic markets. But for most traders, it becomes one of the most frustrating. You enter too early… price goes against you. You wait for a spike… it never comes. You finally catch one… but don’t know whether to hold or close. You make profit… then give it all back because there’s no exit plan. This is exactly the problem the Ultim
This indicator has a unique support and resistance calculation program, which is a unique trading system. Index characteristics Imagine if you can accurately determine the important trading support and resistance areas and points in advance, how will your trading improve? Based on a unique calculation method, the indicator analyzes the trend, analyzes the current support and resistance, and obtains the current important support resistance and single direction, the calculated stop profit and sto
Introducing Indicator for PainX and GainX Indices Traders on Weltrade Get ready to experience the power of trading with our indicator, specifically designed for Weltrade   broker's PainX and GainX Indices.  Advanced Strategies for Unbeatable Insights Our indicator employs sophisticated strategies to analyze market trends, pinpointing optimal entry and exit points.  Optimized for Maximum Performance To ensure optimal results, our indicator is carefully calibrated for 5-minute timeframe charts on
The SyntheticaFX Scalper Pro Indicator is a versatile and user-friendly tool designed to assist traders in identifying high-accuracy entry points across multiple timeframes and all currency pairs. This indicator provides clear visual signals on the chart, along with recommended Stop Loss (SL) and Take Profit (TP) levels, making it easier for traders to plan their trades with confidence. With its built-in dashboard, the SyntheticaFX Scalper Pro Indicator offers real-time trade statistics, helpin
Gartley Hunter Multi - An indicator for searching for harmonic patterns simultaneously on dozens of trading instruments and on all possible timeframes. Manual (Be sure to read before purchasing) | Version for MT4 Advantages 1. Patterns: Gartley, Butterfly, Shark, Crab. Bat, Alternate Bat, Deep Crab, Cypher 2. Simultaneous search for patterns on dozens of trading instruments and on all possible timeframes 3. Search for patterns of all possible sizes. From the smallest to the largest 4. All fou
SkyHammer Signal Pro Entry、SL、TP レベルを固定表示する、プロ仕様のノーリペイント・トレンドシグナルインジケーター SkyHammer Signal Pro は、明確で固定され、検証可能なシグナルを求めるトレーダー向けに設計された、構造的なトレンド・モメンタム系シグナルインジケーターです。 特に M1 と M5 などの短期時間足で最も効果を発揮します。 このインジケーターは、天井や底を予測するためのものではありません。シグナルを出す前に、確認された市場構造、トレンド方向、モメンタムの強さ、健全なボラティリティ、そしてターゲットまでの十分な値幅を確認します。 主な機能 固定シグナルメカニズム シグナルが確認されると、矢印、Entry、Stop Loss、TP1、TP2 の各レベルはチャート上に永久的に固定されます。 その後のローソク足の動きによって、シグナルが消えたり、移動したり、変更されたりすることはありません。 これにより、トレーダーは各シグナルを明確に確認でき、リアルタイム相場中にシグナルが消えるという一般的な問題を避けることができます。 完全な過去シ
The Oracle Pro
Ottaviano De Cicco
5 (1)
The Oracle Pro:MT5向け合成マルチタイムフレーム・バイアスエンジン ️ サマー・ローンチ・オファー — The Oracle Pro を 199 USD で(早期購入者向け)。価格は普及に応じて上昇します。最終価格 399 USD。 The Oracle Pro は、要求の高いプロのトレーダーのために作られた MetaTrader 5 向けのプレミアム・マルチタイムフレーム バイアスエンジン です。ひとつの問いに規律をもって答えます。すなわち、各タイムフレームの現在の方向バイアスは何か、その強さはどれほどか、そしてタイムフレーム同士はどれだけ一致しているか。すべては確定足のみで計算され、リペイントはありません。 The Oracle Pro はマルチファクター・コンセンサス・システムです。独自のインジケーターと最適化されたアルゴリズムを単一の高度なコンセンサス・ベクトルに統合し、それを単一のインジケーター・インスタンス内で現在足と上位足のスタックにわたって読み取ります。複数のチャートにばらばらのツールを積み重ねる代わりに、です。 これは Oracle コンセンサス手法
フィルタ:
レビューなし
レビューに返信