Buy vs Sell Flow Intensity
- インディケータ
- バージョン: 1.0
- アクティベーション: 5

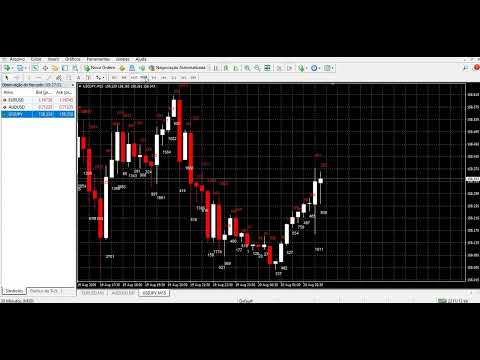
The Buy vs Sell Flow Indicator is a powerful MT4 trading tool designed to help traders visualize estimated buying and selling pressure directly on the chart.
The indicator displays the Buying Force and Selling Force for each candle, allowing you to quickly analyse market activity and understand which side is showing greater strength.
Key Features
Real-time Buying Force and Selling ForceBar-by-bar market flow analysis
Tick Volume analysis
Clear and easy-to-read values
Automatic display above and below candles
Designed for MetaTrader 4
Useful for Forex, Gold, Indices and other markets
Clean and lightweight chart visualization
How It Works
The indicator analyses the relationship between the candle's High, Low, Close and Tick Volume to estimate buying and selling intensity.
Green values represent Buying Force, while red values represent Selling Force, giving traders a quick visual overview of market pressure.
Designed for Traders
Whether you are using price action, technical analysis, scalping or intraday strategies, the Buy vs Sell Flow Indicator can be used as an additional tool to support your market analysis and trading decisions.
Trade with more information. Analyse the market. Find your edge.
Important: This indicator does not guarantee profits. Trading financial markets involves risk. Use proper risk management and test the indicator on a demo account before trading with real funds.