Printer intraday

“I don’t control the market – I move with it.” - Printer intraday

🌊 What if you could stop fighting the market?

Most traders cling. They grip their P&L, their indicators, their hope.
The market flows – they resist. And the tighter they hold, the faster it slips away.

I am Printer intraday! I am not another strategy.
I'm a live market decoder that walks with price, not against it.

🔮 No magic. No random lines. No recycled systems.
🧭 I don’t predict – I leak the market’s next move in real time.⚡ What makes me different?

✅ Session‑Based Trap Move Detection

Every trading session (Sydney, Asia, London, New York) leaves a unique fingerprint.
I listen at the start of each session window.
From there, I track how price behaves using a custom built in sequence analyzer, and hidden accumulation.

I leave visual cues you can see and infer.You see level counts, mini‑levels, micro‑levels (nano counts) – all updated in real time.

Why? Because the market’s hidden structure does not care if you entered or not.
I show you the truth anyway. 

✅ The 3‑Level Truth – With Nano Precision

Every Trap Move has exactly three main levels before it completes.
Each main level may hide mini and micro sub‑levels – I call them nano counts.
Most traders think “level 3 = time to enter” – and in doing so, they fight the reality of the market.
I tell you exactly where they are in the count – main, sub, and nano – so you never guess again.

✅ No Configuration

The default settings work out‑of‑the‑box for most traders. But if you want to fine‑tune Me, every behavior is exposed via input parameters – see the complete list below.

📦 What you get – The Complete Package

  • One MQ5 file – attach to any M15 chart (crypto, forex, metals, indices, stocks).

  • Real‑time visual signals – colored arrows, blue session dots, and slanted range lines connecting signal to trigger.

  • Accumulation boxes – visualizes key trading accumulation

⚙️ Complete Input Parameters – What Each One Does

Below is every input you can adjust. The indicator works perfectly with defaults, but here is your reference guide.


input group "Indicator Settings"

input string // User-configurable list of reference hours


input group "Visual Settings"

input bool   InpShowReferenceHourText = true; // Toggle to show reference hour text label

input   InpReferenceHourTextOffset = 90; // Pixel offset for the reference hour text label

input int    InpReferenceHourTextSize = 10; // Font size for the reference hour text label

input int    InpSeqArrowOffset   = 60; // Pixel offset for arrows from candle high/low

input int    InpFailbreakArrowOffset= 25; // Pixel offset for x arrows from candle high/low

input color  InpAboveSeqArrowColor  = clrRed; // Color for arrow when above at count 1

input color  InpBelowSeqArrowColor  = clrGreen; // Color for arrow when below  at 1

input int    InpAboveSeqArrowCode   = 234; // Arrow code for "Above" (e.g., 234 is down arrow).

input int    InpBelowSeqArrowCode   = 233; // Arrow code for "Below" (e.g., 233 is up arrow).

input int    InpSeqArrowSize        = 24; // Size of the sequence arrow (in pixels, acts like font size)


//--- Reference Dot Parameters

input color  InpReferenceDotColor   = clrBlue;

// Color for the blue dot on the reference candle's high/low

input int    InpReferenceDotSize    = 500;

// Wingdings char 159 for blue dot

input int    InpReferenceDotOffset  = 1;

// Pixel offset for the blue reference dot from candle high


//--- Arrow Drawing Parameters (Failbreak 'X' and Count 1 Failure)

input color  InpFailbreakArrowColor = clrBlack;

// Color for  (black X)

input int    InpFailbreakArrowCode  = 120;


input group "Troubleshooting & History"

input    InpDrawAllHistory    = false; // Set to true to draw all historical arrows/dots for troubleshooting

input     InpHistoryDays       = 200;  // Number of days to display if InpDrawAllHistory is false

input   InpAccumulationLookback = 30;    // Accumulation boxes Lookback history in days 


🌳 A tree does not resist autumn.

It releases its leaves and prepares for renewal.
Let me show you when to flow with the current – and when to quietly step aside.

📩 After purchase

Send a private message to my mother – she will give you the manual.
(Yes, the author who gave birth to me.)
The manual includes:

  • Step‑by‑step installation

  • How to read the level counts

  • Troubleshooting guide

⚠️ One last thing

You don’t need to change anything.
You don’t need to study for weeks.
Just attach me, and I will handle the rest.

👉And finally – stop holding water in your hands.

Printer intraday

Real‑time. Unsettling. Liberating.

 M15 only | Crypto | Forex | Metals | Indices | Stocks


おすすめのプロダクト
Boom & Crash AI Spike Detector MT5 – Advanced Edition + Weltrade Support Unlock the Next Generation of Boom & Crash Trading Experience a smarter way to trade with our Advanced AI Boom & Crash Spike Detector for MT5. Powered by enhanced AI technology and intelligent market filtering, this indicator delivers high-probability Buy and Sell signals with improved accuracy and reduced false entries. Designed for scalpers, day traders, and swing traders, the latest version combines precision, spee
The Second-Level Tick Candlestick Generator is a professional-grade MT5 indicator tool specifically designed for high-frequency trading and short-term scalping. It can convert raw tick data into highly customizable second-level candlestick charts in real-time, helping traders accurately capture micro-market fluctuations and optimize entry and exit timing. This tool provides clear chart displays, allowing you to more intuitively identify price action patterns and improve trading decision efficien
Title:FX-AIEA Supply and Demand Zone Indicator (MT5) — Technical Overview Version: 2.51 | Platform: MetaTrader 5 Introduction Supply and demand zones are considered a core manifestation of institutional order flow, providing a more direct reflection of buying and selling pressure than traditional support/resistance levels. This indicator attempts to automate the identification of high-probability supply and demand zones using an adaptive ZigZag algorithm, reducing the subjectivity and time asso
“I don’t control the market – I too move with it.” - Printer monthlyRun   What if you could stop fighting the market? Most traders cling. They grip their P&L, their indicators, their hope. The market flows – they resist. And the tighter they hold, the faster it slips away. I am  Printer monthlyRun! Like my younger siblings Printer intraday, Printer  dailyRun, and  Printer weeklyRun, I am not  another strategy! I'm a   live market decoder   that walks with price, not against it. No magic.
“I don’t control the market – I too move with it.” - Printer weeklyRun   What if you could stop fighting the market? Most traders cling. They grip their P&L, their indicators, their hope. The market flows – they resist. And the tighter they hold, the faster it slips away. I am  Printer weeklyRun! Like my younger siblings Printer intraday, and Printer dailyRun, I am not  another strategy! I'm a   live market decoder   that walks with price, not against it. No magic. No random lines. No re
“I don’t control the market – I too move with it.” - Printer dailyRun   What if you could stop fighting the market? Most traders cling. They grip their P&L, their indicators, their hope. The market flows – they resist. And the tighter they hold, the faster it slips away. I am  Printer dailyRun! Like my younger sibling Printer intraday, I am not  another strategy! I'm a   live market decoder   that walks with price, not against it. No magic. No random lines. No recycled systems. I don
Rtc ML Ai | Predictor CORE MACHINE LEARNING ENGINE Adaptive ML Market Predictor – Multi-Bar Trend & Candle Forecast What This Indicator Does This indicator is a  real-time market prediction engine  designed to analyze price behavior and estimate  future market tendencies . Unlike conventional indicators, this system  does not rely on static parameters or historical curve-fitting , but adapts its internal state dynamically during live market operation. Instead of using static rules, the indic
LiquiditySweepEngineAutoTargets Advanced Liquidity, Market Structure & Precision Signal Indicator for MetaTrader 4 LiquiditySweepEngineAutoTargets is an advanced multi-layer market analysis indicator designed to identify high-probability trading opportunities by combining market structure, liquidity behavior, order blocks, breakout confirmation, retests, dynamic support and resistance, higher-timeframe bias, and a weighted confluence scoring system into one unified MT4 trading tool. The system
THE QUANTUM UNIFIED BRAIN FOR MT5 The indicator that thinks, adapts, remembers, and dominates across 9 timeframes simultaneously. Most indicators show you one signal. GRID PACMAN TITAN X ESTEROIDES v2.0 runs 17 interconnected intelligence modules in real time — and they vote together before a single arrow appears on your chart. This is not a crossover indicator. This is not a repackaged RSI. This is a complete autonomous analysis engine built for traders who are tired of chasing the market and
[b]Titan Pro V7 Institutional Dashboard[/b] is an advanced quantitative HUD terminal engineered for MetaTrader 5, designed for institutional market analysis, quantitative prop-firm verification, and disciplined intraday execution. Unlike conventional single-formula indicators that suffer from lag and market regime shifts, Titan Pro V7 synthesizes a multi-strategy quantitative consensus model combining Trend Momentum, Volatility Breakout, Intraday VWAP, and Smart Money Concepts (SMC) into a sin
Limitless MT5 is a universal indicator suitable for every beginner and experienced trader. works on all currency pairs, cryptocurrencies, raw stocks Limitless MT5 - already configured and does not require additional configuration And now the main thing Why Limitless MT5? 1 complete lack of redrawing 2 two years of testing by the best specialists in trading 3 the accuracy of correct signals exceeds 80% 4 performed well in trading during news releases Trading rules 1 buy signal - the ap
SignalArrows - Trading Signal Indicator SignalArrows is a MetaTrader 5 indicator designed to identify potential BUY and SELL signal conditions using moving-average crossover logic with additional confirmation filters. The indicator processes a signal through several stages before plotting an arrow on the chart: How It Works 1. Raw MA Cross Detection The indicator first detects a crossover between the fast and slow moving averages. 2. Gap Confirmation After a crossover, the indicator checks whe
KingTrend — Price Action Trend Analysis Tool KingTrend is a trend-following indicator based on long-standing price action principles involving Highs, Lows, Open, and Close. The logic behind this tool comes from concepts passed on to me by my mentor and translated into code for consistent structure recognition. Features: Identifies market structure using price action logic Detects trend direction and key turning points Marks Higher Highs, Lower Lows, and extensions Suitable for discretionary or
TOPTICK SMC 高度なスマートマネーコンセプト(SMC)トレーディングインジケーター TOPTICK SMC は、市場構造、機関投資家の注文フロー、流動性ゾーン、高確率の取引機会を1つのチャート上で分析できるよう設計された、プロフェッショナル向け Smart Money Concepts(SMC) インジケーターです。 このインジケーターは複数のSMCツールを1つの分析環境に統合し、市場構造の変化、Order Blocks、Fair Value Gaps(FVG)、Premium/Discountゾーン、上位時間足の重要レベル、およびフィボナッチ・リトレースメントを簡単に確認できます。 主な機能 市場構造分析     •    内部 Break of Structure(BoS)     •    内部 Change of Character(CHoCH)     •    外部 Break of Structure     •    外部 Change of Character Smart Money Concepts     •    Order Block の自動検出  
TPO Profile MT5
Kyra Nickaline Watson-gordon
Definition : TPO is a Time Price Opportunity. Instead of using bars or candles with an Open, High, Low, and Close price, each "bar" in a Market Profile is represented by horizontal bars against the price It is called Market Profile terminology. In other words time-price-opportunity (TPO) profiles are histograms of how much time was spent at each price within the span of the profile. By using a TPO chart, you are able to analyze the amount of trading activity, based on time, for each price level
This indicator is based on  a certain algorithm and acts as a market scanner. All you need to do is fill in the selected currency pairs in the settings and that’s it. Next, the indicator itself will view all these currency pairs and time frames from M5 to D1 simultaneously. When a new signal appears, the indicator will give you an Alert and also draw the letter N where this new signal will be.
TDI Pro Quantum — Where Legend Meets Multi-Dimensional Analysis The first time Trader's Dynamic Index has been upgraded to think in multiple dimensions simultaneously. If you're already a TDI fan, you know it's one of the most powerful indicators in the game — direction, momentum, market strength, and sentiment in a single panel. But for today's markets, TDI alone isn't enough. TDI Pro Quantum elevates TDI to the next level by seamlessly fusing four analytical disciplines that professional trad
ジュリック・アドバンストMA(JurMA)は、マーク・ジュリックが考案した オリジナルのJMAをベースに開発されたノンリペイントのテクニカル 指標です。 従来の移動平均線に見られるラグを減らし、平滑性を向上させ、ノイズを減らすように設計されています。JurMAは市場のボラティリティに適応し、ユーザーが感度を微調整できるため、金融市場のトレンドや反転を見極めるのに役立ちます。この適応性と効率性により、トレーダーやアナリストの間で人気があります。 他のテクニカル・インディケータの広い文脈では、「感度」とは、価格データの変 化に対してインディケータがどれだけ速く反応するかを意味します。ローソク足の本数ではなく、インジケータが一定期間の値動きをどのように解釈するか(反応性の大小)を意味します。JurMAは、このインジケータの動作、特に「移行プロセスの質」を調整するために、PHASE機能パラメータを提供しています。PHASEは線の "滑らかさ "とは関係なく、平均計算におけるJarikの公式と直接相互作用する方法であることを理解することが重要です(ノイズをフィルタリングするのに適しています
ENG-GOLD Scalper It is an auxiliary indicator that identifies potential targets and determines the place of entry with a stop loss that works on Heiken Ashi candles  The green lines are usually the targets, the red lines are the stop loss, and the yellow lines are the entry location.  This file is recognized on small and medium frames, usually less than the watch frame I highly recommend using XAUUSD Nasdaq100 Dow30 USOIL 
Manyal trading system, CovEchoTrend Robot, focuses on reliability and flexibility. By employing statistical analysis methods to study the relationships between the base indicator and market patterns, the system enables a deeper understanding of market processes. Intelligent pattern analysis: The application of statistical data processing helps identify key trend reversal points more accurately, signaling significant market shifts. Informed decision-making is based on the intersection of indicato
BTC Master Pro
Farzad Saadatinia
4.64 (14)
BTC Master Pro — 規律あるビットコイントレードのための信頼できるパートナー。 最新バージョンでは OpenAI の人工知能 を統合し、高ボラティリティな暗号資産市場において、より高度な執行判断と取引フィルタリングを実現します。 本プロフェッショナル向けエキスパートアドバイザーは、 MetaTrader 5 上での Bitcoin(BTCUSD) 取引専用に設計されており、構造化された執行ロジック、エクスポージャー管理、そして高度なリスクマネジメントに重点を置いています。 価格: $699  →  次段階: $999  →  最終価格: $999 LIVE SIGNAL HERE OpenAI搭載・執行フィルター 最新バージョンでは OpenAI 技術を活用し、リアルタイムで市場環境を分析し、質の低いエントリーや不利なセットアップをフィルタリングします。 AIセーフティレイヤー: AIモジュールは取引実行前の第二承認レイヤーとして機能します。これは予測ツールではなく、あくまで執行フィルターとして設計されています。すべての取引は構造化ロジックとインテリジェントな検証プ
Tenos Ea
Sachin Nagar Shyamendra Nagar
TENOS EA   is a fully automated, multi-strategy Expert Advisor designed for MetaTrader 5, engineered to operate across major Forex pairs and precious metals. Built on a foundation of adaptive trend-following combined with intelligent hedging mechanics, TENOS EA aims to deliver consistent performance in both trending and ranging market conditions. its consistent profit maker and long term profit maker. Our website: https://easouq.shop/ Contact US on telegram: @OfficialEaSouq
SAIKO – Smart Buy & Sell Indicator SAIKO is an advanced intelligent trading indicator engineered with exceptional precision and designed to simplify professional market analysis. Built upon a sophisticated multi-layered trading system, SAIKO combines several powerful analytical methods into one seamless solution. Instead of relying on a single indicator, SAIKO continuously analyzes and combines data from multiple technical indicators, moving averages, market momentum, trend strength, liquidity b
Mac Rider Gold
Ignacio Agustin Mene Franco
MacRider GOLD is a professional grid-based Expert Advisor (EA) specifically designed for XAUUSD (Gold). It combines MACD signal filtering with dynamic trailing stops and advanced money management. The EA uses the MACD indicator to detect trend direction before placing pending orders, filtering out low-quality entries and focusing on high-probability setups. The grid system places BUY STOP and SELL STOP orders at configurable distances, while automatic profit closing and dynamic trailing stops
Goldfortune
Paphangkon Luangsanit
SUGGESTED PRODUCT NAME Gold Fortune Buy Sell Stop RUN TF5m. SHORT DESCRIPTION An XAUUSD Expert Advisor combining adaptive automatic entries, basket recovery, and manual order controls in one chart panel. FULL PRODUCT DESCRIPTION Gold Fortune Buy Sell Stop is an Expert Advisor designed for XAUUSD trading on MetaTrader 5. It combines an automatic M1 pattern model, multi-timeframe direction analysis, recovery basket management, and a complete manual trading panel. The EA operates on the sym
SMC Alpha Engine SMC Alpha Engine is a Smart Money Concepts indicator for MetaTrader 5 designed to identify Order Blocks, Fair Value Gaps, Liquidity Sweeps, and market structure changes directly on the chart. The indicator focuses on displaying the most recent valid Order Block together with automatically calculated TP and SL levels for simplified chart analysis. Main Features Automatic Order Block detection Buy and Sell zone visualization Automatic TP and SL calculation Fair Value Gap (FVG) det
Larry Connors TPS – PercentB - (Bollinger Band %) A professional implementation of Larry Connors' Percent B strategy, designed to systematically capture high-probability short-term reversals in equity markets. This system uses the Bollinger Band %b indicator to identify when price has moved to a statistical extreme relative to its recent volatility envelope. When %b drops near zero, price is at or below the lower Bollinger Band — a quantified oversold condition that this EA captures with discipl
Quantum SMT Zones Pro Overview Quantum SMT Zones Pro is a Smart Money Technique (SMT) divergence indicator for MetaTrader 5 that compares the price action of two correlated instruments and highlights situations where one market fails to confirm the movement of the other. By identifying SMT divergences and market inefficiencies, the indicator helps traders analyze intermarket relationships, monitor potential shifts in market structure, and identify developing trading opportunities. The indicator
The indicator is designed to close positions on the market in time. For example: to take profits ahead of schedule if the price has not reached TakeProfit, and the market is turning around. The indicator analyzes the momentum, not the trend. He does not give any information about the trend. The indicator is well suited for finding divergence. The Ershov 38 Parrots indicator dynamically adjusts to the market and detects price movement impulses of medium and high amplitude. It almost does not rea
Trend Breakout Arrows Indicator The Trend Breakout Arrows Indicator is a momentum-based signal tool designed to identify potential bullish and bearish breakout opportunities. It displays clear arrow signals directly on the price chart, helping traders quickly recognize possible trend changes and continuation setups. Up Arrow (Buy Signal) A magenta up arrow appears below a candle when bullish momentum begins to strengthen. This signal indicates that buying pressure may be overtaking selling press
このプロダクトを購入した人は以下も購入しています
Boba Analysis Suite
Trade Ready Solutions LLC
5 (2)
Boba Analysis Suite Boba Analysis Suite は、MetaTrader 5 向けの分析インジケーターです。市場構造、重要な価格帯、相場全体の状況を、一つのチャート画面にまとめて表示します。 トレーダーおよびトレーディング指導者としての実務経験をもとに開発され、市場の方向性の評価、重要な価格水準の特定、複数の時間足を組み合わせた分析など、体系的な分析プロセスを支援します。 相場の背景を踏まえた分析 個々のシグナルの意味は、相場の状況によって変わります。Boba Analysis Suite は、現在のチャート状況をより大きな市場構造と関連付け、あらかじめ定めたルールに沿って取引アイデアを検討するための分析を支援します。 主な分析機能: トレンドと市場構造: 市場の方向性と、その背景にある構造を評価します。 重要な価格帯と価格水準: さらに分析すべき重要な領域を視覚的に表示します。 複数の時間足: 異なる時間足の情報を組み合わせ、相場全体の状況を評価します。 視覚的な分析プロセス: 分析情報をチャート上で直接確認できます。 自主的な取引判断を支援 Boba
ARICoin is a powerful trading companion designed to generate high-probability entry signals with dynamic TP/SL/DP levels based on volatility. Built-in performance tracking shows win/loss stats, PP1/PP2 hits, and success rates all updated live. Key Features: Buy/Sell signals with adaptive volatility bands Real-time TP/SL/DP levels based on ATR Built-in MA Filter with optional ATR/StdDev volatility Performance stats panel (Success, Profit/Loss, PP1/PP2) Alerts via popup, sound, push, or email Cust
ScalpPoint is a powerful trading companion designed to generate high-probability entry signals with dynamic TP/SL/DP levels based on volatility. Built-in performance tracking shows win/loss stats, PP1/PP2 hits, and success rates — all updated live. Key Features: Buy/Sell signals with adaptive volatility bands Real-time TP/SL/DP levels based on ATR Built-in MA Filter with optional ATR/StdDev volatility Performance stats panel (Success, Profit/Loss, PP1/PP2) Alerts via popup, sound, push, or emai
AriFocus - Non-Repainting Buy/Sell Signals AriFocus - one clear signal. AriFocus marks buy and sell signals directly on the chart and suggests a stop-loss level for each one. Every signal is confirmed on bar close and never repaints. - Buy/sell arrows, confirmed on bar close - Suggested stop-loss level for every signal - Trend band and candle coloring to show direction at a glance - 10 ready-made presets, or your own settings (14 calculation methods) - Pop-up, push and email alerts with entr
ARIPoint
Temirlan Kdyrkhan
1 (4)
ARIPoint is a powerful trading companion designed to generate high-probability entry signals with dynamic TP/SL/DP levels based on volatility. Built-in performance tracking shows win/loss stats, PP1/PP2 hits, and success rates all updated live. Key Features: Buy/Sell signals with adaptive volatility bands Real-time TP/SL/DP levels based on ATR Built-in MA Filter with optional ATR/StdDev volatility Performance stats panel (Success, Profit/Loss, PP1/PP2) Alerts via popup, sound, push, or email Cu
SMC Sniper Pro MT5 SMC Sniper Pro by QuantFlow Labs is a chart indicator for liquidity-based intraday analysis. It combines session ranges, tracked liquidity sweeps and three selectable entry models in one configurable workspace. It displays setup context and entry references; it does not open, manage or close trades. Three selectable entry models Model 1 - Inverse Fair Value Gap breakout: after an eligible liquidity sweep, the indicator waits for a confirmed close through the relevant fair valu
VTrende Pro
Andrii Diachenko
5 (1)
VTrende Pro - MTF indicator for trend trading with a display panel for MT5 *** Videos can be translated into any language using subtitles (video language - Russian) Although the signals of the VTrende Pro indicator can be used as signals of a full-fledged trading system, it is recommended to use them in conjunction with the Bill Williams TS. VTrende Pro is an extended version of the VTrende indicator. Difference between Pro version and VTrende: - Time zones - Signal V - signal 1-2 waves -    S
QNC Scalper
Yordiana Enggelina Seko
Here is a professional and engaging description for the Indikator QNC Scalper tool in English, tailored for traders and platforms: Indikator QNC Scalper Unlock precision trading in fast-paced markets with the Indikator QNC Scalper —an advanced technical analysis tool engineered specifically for scalpers and day traders. Whether you are trading forex, crypto, or indices, this indicator cuts through market noise to deliver clear, high-probability entry and exit signals. Key Features Real-Time M
note: this indicator is for METATRADER4, if you want the version for METATRADER5 this is the link:  https://www.mql5.com/it/market/product/108106 TRENDMAESTRO ver 2.5 TRENDMAESTRO recognizes a new TREND from the start, he never makes mistakes. The certainty of identifying a new TREND is priceless. DESCRIPTION TRENDMAESTRO identifies a new TREND in the bud, this indicator examines the volatility, volumes and momentum to identify the moment in which there is an explosion of one or more of these da
AriX
Temirlan Kdyrkhan
1 (4)
AriX Indicator for MT5 A powerful trend-following and signal-evaluation tool AriX is a custom MT5 indicator that combines Moving Averages and ATR-based risk/reward logic to generate clear buy/sell signals. It visualizes dynamic SL/TP levels, evaluates past trade outcomes, and displays win/loss statistics in a clean on-chart panel. Key features include: Buy/Sell signals based on MA crossovers ATR-based SL/TP1/TP2/TP3 levels with visual lines and labels Signal outcome tracking with real-time stat
MERAVITH SCANNERは、MetaTrader 5用のプロフェッショナルな金融市場インジケーターで、複数の分析ツールを一つの統合システムにまとめています。独自の出来高加重平均価格(VWAP)手法を使用してすべての計算を自動で行い、主観的な解釈を完全に排除します。 このインジケーターは、すべての資産クラス(FX、株式、指数、商品、暗号通貨)およびM1から月足までのすべての時間軸で動作します。基本原理は「価格は出来高に従う」というものです。MERAVITHは機関投資家の出来高が集中するポイントを特定し、その集中から数学的に正確な価格レベルを導き出します。予測や投機は行わず、計算のみを行います。 MERAVITH SCANNERを使用すると、28の主要FX通貨ペアをすべての時間軸でわずか2~3分でスキャンできます。また、任意の市場をスキャンすることも可能です。例えば、約100銘柄の株式を約10分でスキャンできます。 インジケーターは、消耗レベル、均衡線、偏差、統計レベル、およびターゲット予測を算出します。 チャート要素 Origin Point :すべての計算が始まる起点です。イン
一言でいうと このインジケーターは RSI と MACD という2人の専門家を1つにまとめたもの です。2つのチャートを別々に見て判断する代わりに、両方が同意したときだけ「買い」または「売り」の矢印を表示します。 矢印は再描画されません 。一度出現すれば、そのまま固定されます。 「コンボ」の意味 通常、トレーダーは RSI(値動きの勢い)と MACD(トレンドの方向)を別々に見ます。しかし両者が矛盾することも多いです。 このインジケーターでは、 両方が同時に同意したときのみシグナル を出します。これにより、多くの偽シグナルが排除されます。 画面で見えるもの 価格チャートとは別のインジケーターウィンドウ 青と赤の矢印 —— そのまま使えるシグナル 拡大表示された MACD ヒストグラム(見やすく強調されている) RSI と MACD のラインも表示されるが、注目すべきは矢印 こんな人におすすめ 初心者 —— 2つのインジケーターを別々に解釈し、矛盾に対処する必要がない 経験者 —— シグナルの高速フィルタリングと、再描画しないクリアなロジック 迷いたくない人 —— 「買い」「売り」「待て
Volume Arrow Signal Product Description Volume Arrow Signal is a smart trading indicator designed to help traders identify potential buy and sell opportunities using price action, volume behavior, and directional arrow signals. The indicator places clear arrows directly on the chart, making it easy to spot possible market reversals, trend continuations, and entry opportunities without spending hours analyzing charts manually. Whether you are trading Gold (XAUUSD) , Forex pairs, Indices, or Crypt
MasterTrend Indicator for MT5 A powerful trend-following and signal-evaluation tool MasterTrend   is a custom MT5 indicator that combines Moving Averages and ATR-based risk/reward logic to generate clear buy/sell signals. It visualizes dynamic SL/TP levels, evaluates past trade outcomes, and displays win/loss statistics in a clean on-chart panel. Key features include: Buy/Sell signals based on MA crossovers ATR-based SL/TP1/TP2/TP3 levels with visual lines and labels Signal outcome tracking wit
SMC Sweep Fvg MT5 — スマートマネーと同じ目線で、チャート上に市場を映す こんな経験はありませんか。価格がストップを巻き取り、反転し、まさに想定どおりの方向へ進む。方向は正しかった。間違えたのはエントリーだけです。 このインジケーターは、そうした場面を減らすために作られています。分析で最も重い部分——チャートのマークアップ——を引き受け、本当に重要な「判断」をあなたに残します。 チャートに表示されるもの マーケットストラクチャー — 実際の構造的高値・安値に HH / HL / LH / LL ラベルとレベルライン。トレンドが一目で分かり、推測は不要です。 インバランスゾーン(FVG) — 価格が急ぎ過ぎて通過し、後で戻りやすい領域。未埋めと既埋めのゾーンは別色で表示されます。 流動性の動き — 反転前に市場がレベルを巻き取る瞬間を追跡します。 トレード設計の完成形 — エントリー矢印、ストップロス、利益目標。すべて描画済みで、頭の中で計算する必要はありません。 トレンドフィルター — 上位足のラインで、主戦場の動きの側に立ち続けられます。 インジケーターは
KenKem Master Volume Profiler - Brief Introduction A Display-only volume-profile cockpit for XAUUSD, BTCUSD and other liquid symbols. Draws profile structure, multi-timeframe flow, EMA trend and study-only setup markers. Places no orders. Not a signal service.  It maps where the market has actually traded and reads recent order flow, so you can see structure and lean at a glance.  What it shows: Master and local volume profiles (POC and value-area high/low) - the price shelves that matter. A liv
The Expert Advisor and the video are attached in the Discussion tab . The robot applies only one order and strictly follows the signals to evaluate the indicator efficiency. Pan PrizMA CD Phase is an option based on the Pan PrizMA indicator. Details (in Russian). Averaging by a quadric-quartic polynomial increases the smoothness of lines, adds momentum and rhythm. Extrapolation by the sinusoid function near a constant allows adjusting the delay or lead of signals. The value of the phase - wave s
Классификатор силы тренда. Показания на истории не меняет. Изменяется классификация только незакрытого бара. По идее подобен полной системе ASCTrend, сигнальный модуль которой, точнее его аппроксимация в несколько "урезанном" виде, есть в свободном доступе, а также в терминале как сигнальный индикатор SilverTrend . Точной копией системы ASCTrend не является. Работает на всех инструментах и всех временных диапазонах. Индикатор использует несколько некоррелируемых между собой алгоритмов для класси
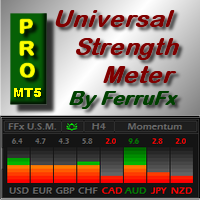
FFx Universal Strength Meter PRO is more than a basic strength meter. Instead of limiting the calculation to price, it can be based on any of the 19 integrated strength modes + 9 timeframes. With the FFx USM, you are able to define any period for any combination of timeframes. For example, you can set the dashboard for the last 10 candles for M15-H1-H4… Full flexibility! Very easy to interpret... It gives a great idea about which currency is weak and which is strong, so you can find the best pai
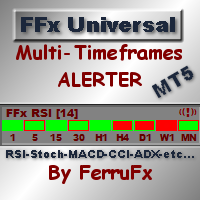
The FFx Universal MTF alerter shows on a single chart all the timeframes (M1 to Monthly) with their own status for the chosen indicator. 9 indicators mode (MACD-RSI-Stochastic-MA-ADX-Ichimoku-Candles-CCI-PSAR). Each can be applied multiple times on the same chart with different settings. Very easy to interpret. Confirm your BUY entries when most of the timeframes are showing green color. And confirm your SELL entries when most of the timeframes are showing red color. 2 Alert Options : input to s
The FFx Watcher PRO is a dashboard displaying on a single chart the current direction of up to 15 standard indicators and up to 21 timeframes. It has 2 different modes: Watcher mode: Multi Indicators User is able to select up to 15 indicators to be displayed User is able to select up to 21 timeframes to be displayed Watcher mode: Multi Pairs User is able to select any number of pairs/symbols User is able to select up to 21 timeframes to be displayed This mode uses one of the standard indicators
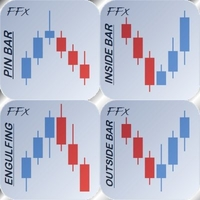
FFx Patterns Alerter gives trade suggestions with Entry, Target 1, Target 2 and StopLoss .... for any of the selected patterns (PinBar, Engulfing, InsideBar, OutsideBar) Below are the different options available: Multiple instances can be applied on the same chart to monitor different patterns Entry suggestion - pips to be added over the break for the entry 3 different options to calculate the SL - by pips, by ATR multiplier or at the pattern High/Low 3 different options to calculate the 2 TPs -
MetaTrader 4 version available here : https://www.mql5.com/en/market/product/24881 FFx Basket Scanner is a global tool scanning all pairs and all timeframes over up to five indicators among the 16 available. You will clearly see which currencies to avoid trading and which ones to focus on. Once a currency goes into an extreme zone (e.g. 20/80%), you can trade the whole basket with great confidence. Another way to use it is to look at two currencies (weak vs strong) to find the best single pairs
MetaTrader 4 version available here: https://www.mql5.com/en/market/product/25793 FFx Pivot SR Suite PRO is a complete suite for support and resistance levels. Support and Resistance are the most used levels in all kinds of trading. Can be used to find reversal trend, to set targets and stop, etc. The indicator is fully flexible directly from the chart 4 periods to choose for the calculation: 4Hours, Daily, Weekly and Monthly 4 formulas to choose for the calculation: Classic, Camarilla, Fibonac
ClassicSBA
Umri Azkia Zulkarnaen
this indicator very simple and easy if you understand and agree with setup and rule basic teknical sba you can cek in link : please cek my youtube channel for detail chanel : an for detail info  contact me  basicly setup buy (long) for this indicator is Magenta- blue and green candle or magenta - green  and green candlestik and for setup sell (short) is Black - yellow - and red candle or black - red  and red candlestik
A scalping indicator based on mathematical patterns, which on average gives signals with relatively small SL, and also occasionally helps to catch big moves in the markets (more information in the video) This indicator has three main types of notifications: The first type warns of a possible/upcoming signal on the next bar The second type indicates the presence of a ready signal to enter the market/open a position The third type is for SL and TP levels - you will be notified every time price re
Индикатор Coefficient Of Determination (COD) представляет собой значение коэффициента детерминации или квадрат коэффициента корреляции между зависимой переменной — ценой и объясняющей переменной — тиковым объемом. Что это дает нам на практике? COD отлично распознает кульминацию трендовых движений, что позволяет подбирать оптимальные точки и ловить развороты рынка. Как использовать индикатор: Наиболее популярная торговая стратегия строится совместно с трендовым индикатором Moving Average (MA), пе
Recommended TimeFrame >= H1. 100% Non Repainted at any moment.  Use it carefully, only with Trend Direction. Trading Usage: 2 Variants: as Range System or as BreakOut System (Both Only With Trend Direction)::: (Always use StopLoss for minimise Risk); [1] as Range System: (Recommended) in UP TREND:  - BUY in Blue Line , then if price goes down by 50 points (on H1) open Second BUY.   Close in any Profit you wish: TrailingStop(45 points) or Close when Price touches upper Gold Line. in DOWN TREND
this indicator is a Spike detector indicator, it is specially designed to trade Boom 1000, Boom 500, Crash 1000 and Crash 500 We recommend using it on Deriv Boom and Crash indices only Its setting is intuitive, familiar, easy to use it has notification functions; audible notifications and push notifications. this tool is simple to use, easy to handle This update is based on different strategies for spikes
QuantXSTocks Trading Range Indicator for MT5: INSTRUCTIONS TO USE OUR INDICATOR:- User needs to take trade on Arrow or after an Arrow CandleStick, You can achieve up-to 35-125 pips target by this Indicator. Best Timeframes for Stocks and Indices are M30 and H1: AMAZON M30 (50 pips) TESLA M30 (50 pips) APPLE M30 (50 pips) ADOBE M30 (50 pips) NASDAQ100 H1 (125 pips) The above are the approximate amount of pips you can achieve by this Indicator, Green arrow appears to be buy arrow while the Red ar
作者のその他のプロダクト
“I don’t control the market – I too move with it.” - Printer dailyRun   What if you could stop fighting the market? Most traders cling. They grip their P&L, their indicators, their hope. The market flows – they resist. And the tighter they hold, the faster it slips away. I am  Printer dailyRun! Like my younger sibling Printer intraday, I am not  another strategy! I'm a   live market decoder   that walks with price, not against it. No magic. No random lines. No recycled systems. I don

“I don’t control the market – I too move with it.” - Printer weeklyRun   What if you could stop fighting the market? Most traders cling. They grip their P&L, their indicators, their hope. The market flows – they resist. And the tighter they hold, the faster it slips away. I am  Printer weeklyRun! Like my younger siblings Printer intraday, and Printer dailyRun, I am not  another strategy! I'm a   live market decoder   that walks with price, not against it. No magic. No random lines. No re
“I don’t control the market – I too move with it.” - Printer monthlyRun   What if you could stop fighting the market? Most traders cling. They grip their P&L, their indicators, their hope. The market flows – they resist. And the tighter they hold, the faster it slips away. I am  Printer monthlyRun! Like my younger siblings Printer intraday, Printer  dailyRun, and  Printer weeklyRun, I am not  another strategy! I'm a   live market decoder   that walks with price, not against it. No magic.
フィルタ:
レビューなし
レビューに返信