MTF High Low Marker
- インディケータ
- バージョン: 1.0

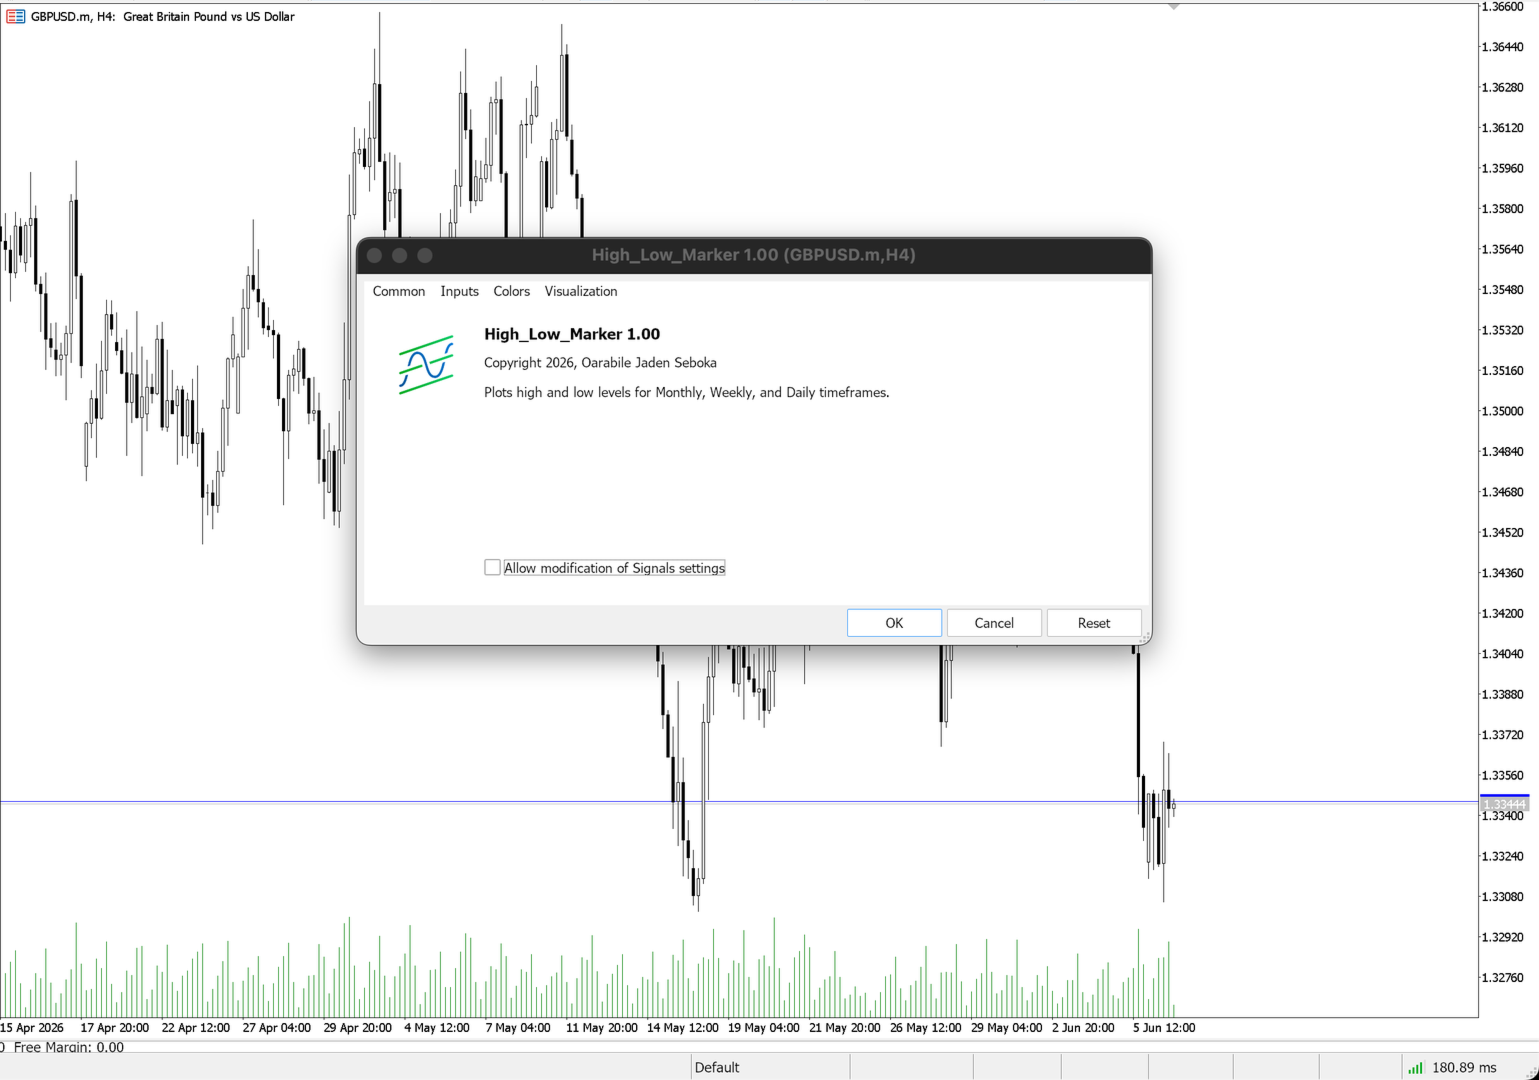
Multi-Timeframe High Low Marker - Key Level Projection Utility
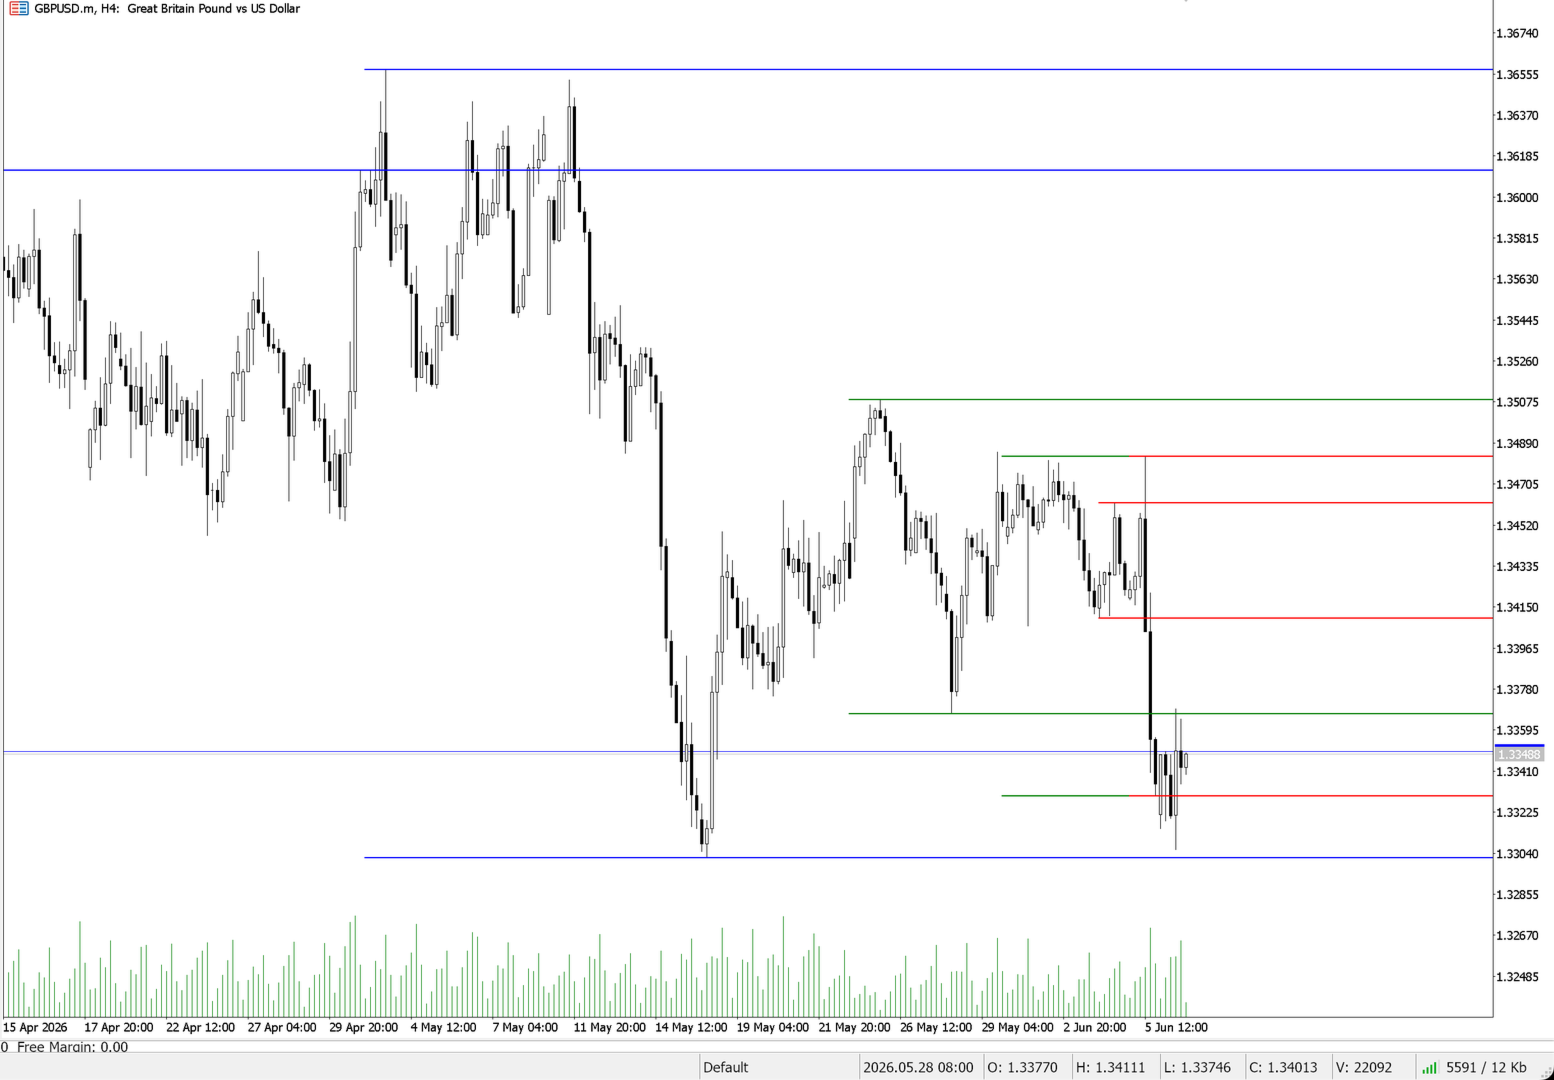
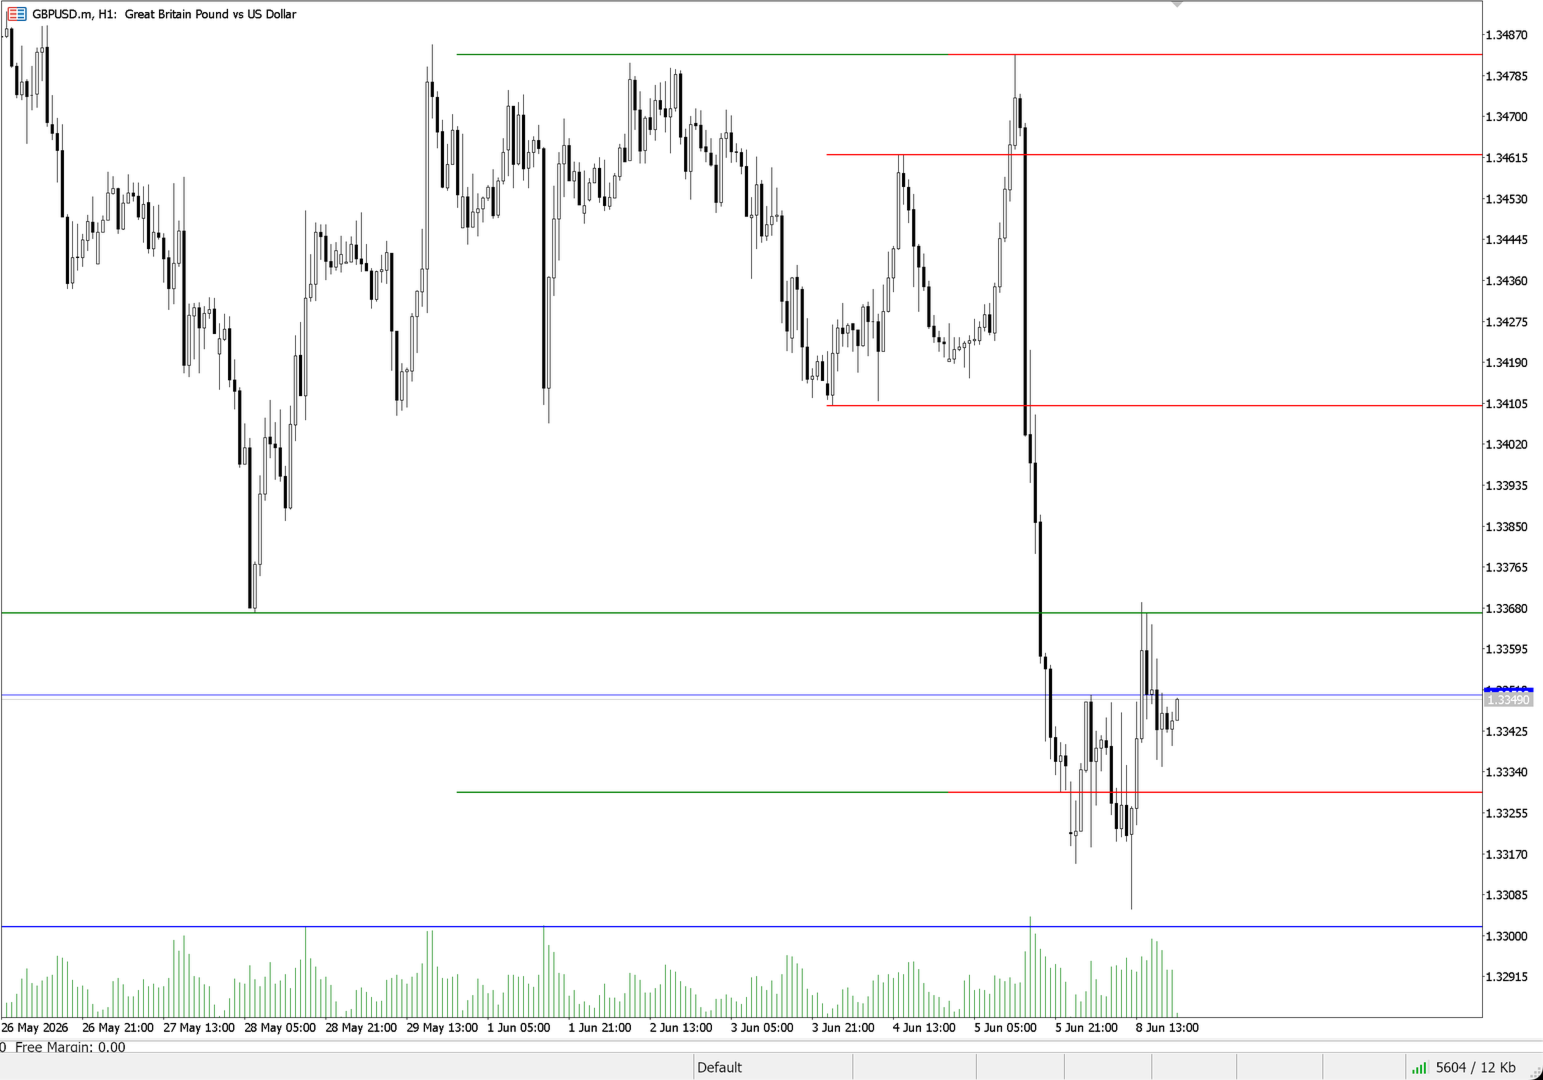
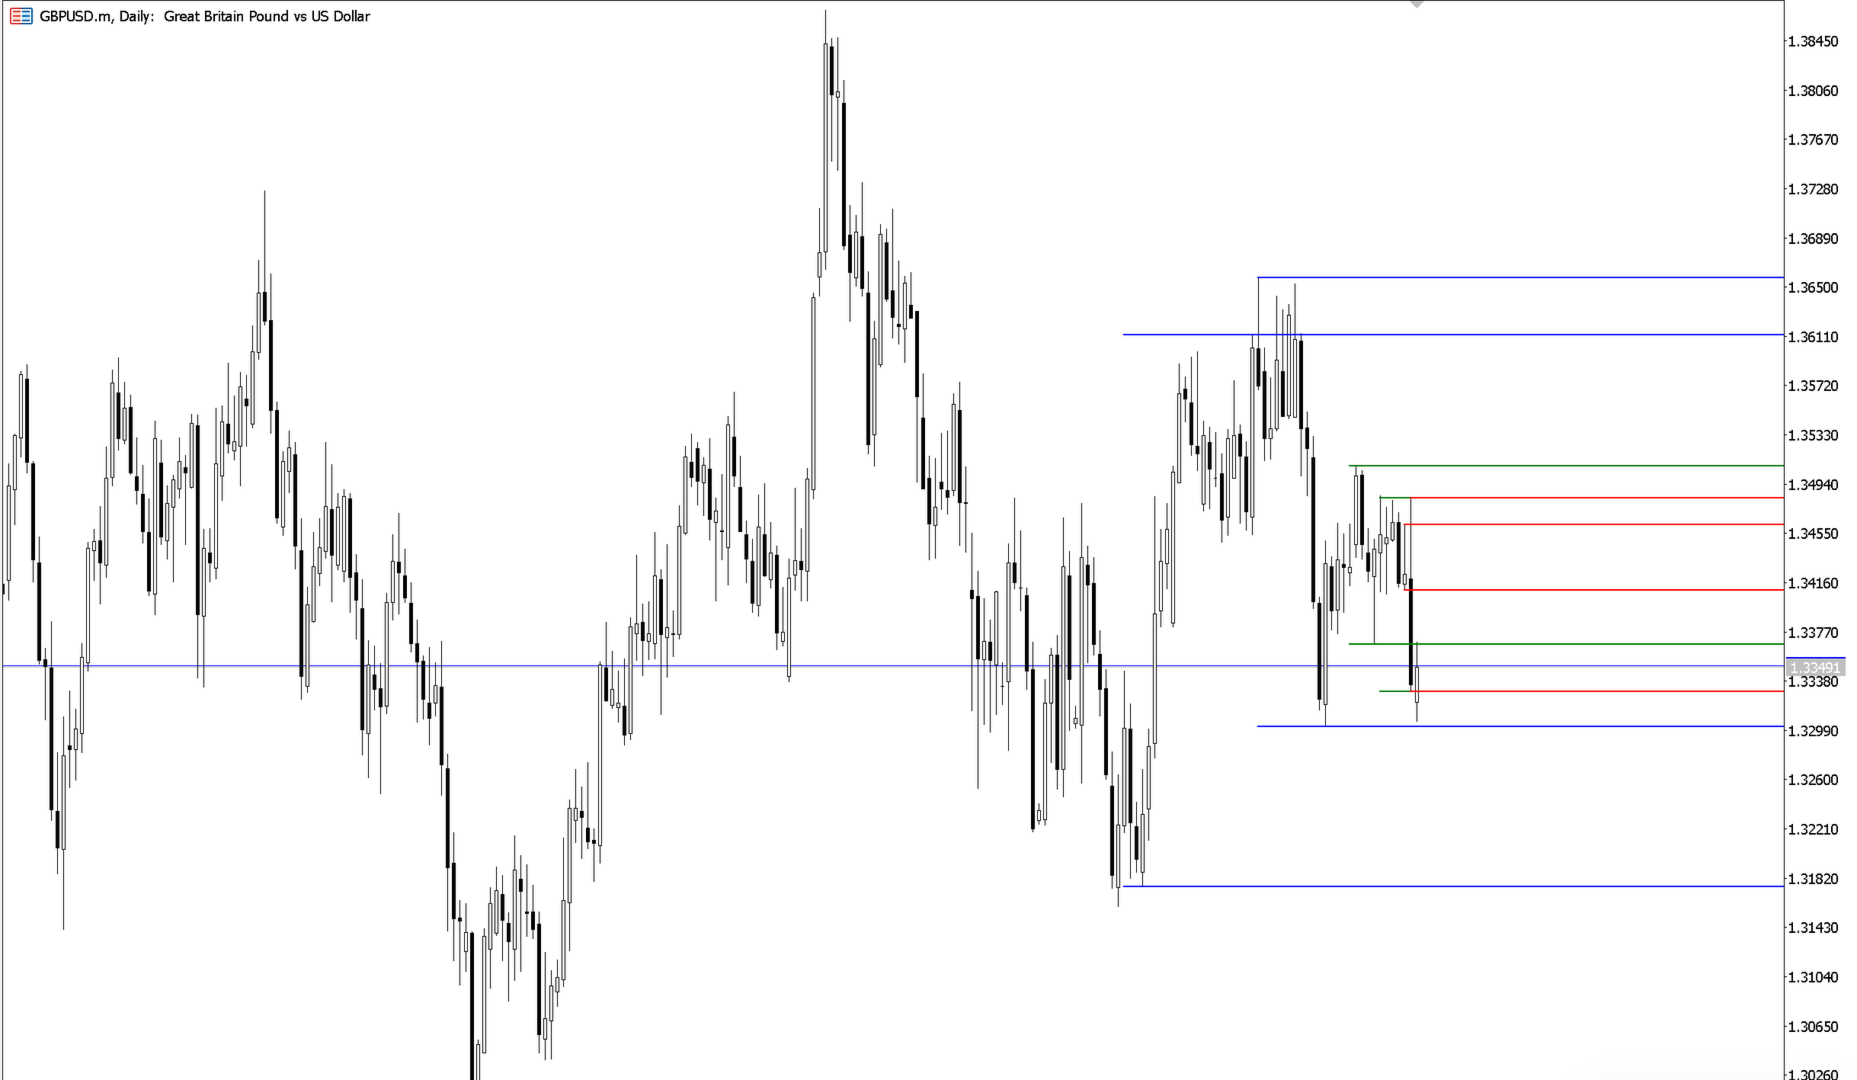
Multi-Timeframe High Low Marker is an essential utility indicator for MetaTrader 5 that automatically identifies and projects the historical high and low levels of previous Daily, Weekly, and Monthly candles onto your current chart.
In financial markets, historical highs and lows represent key structural points where institutional orders, retail breakout triggers, and liquidity pools cluster. This indicator acts as an automated support and resistance mapper, extending these critical levels into the future so you can monitor them in real-time.
Key Features:
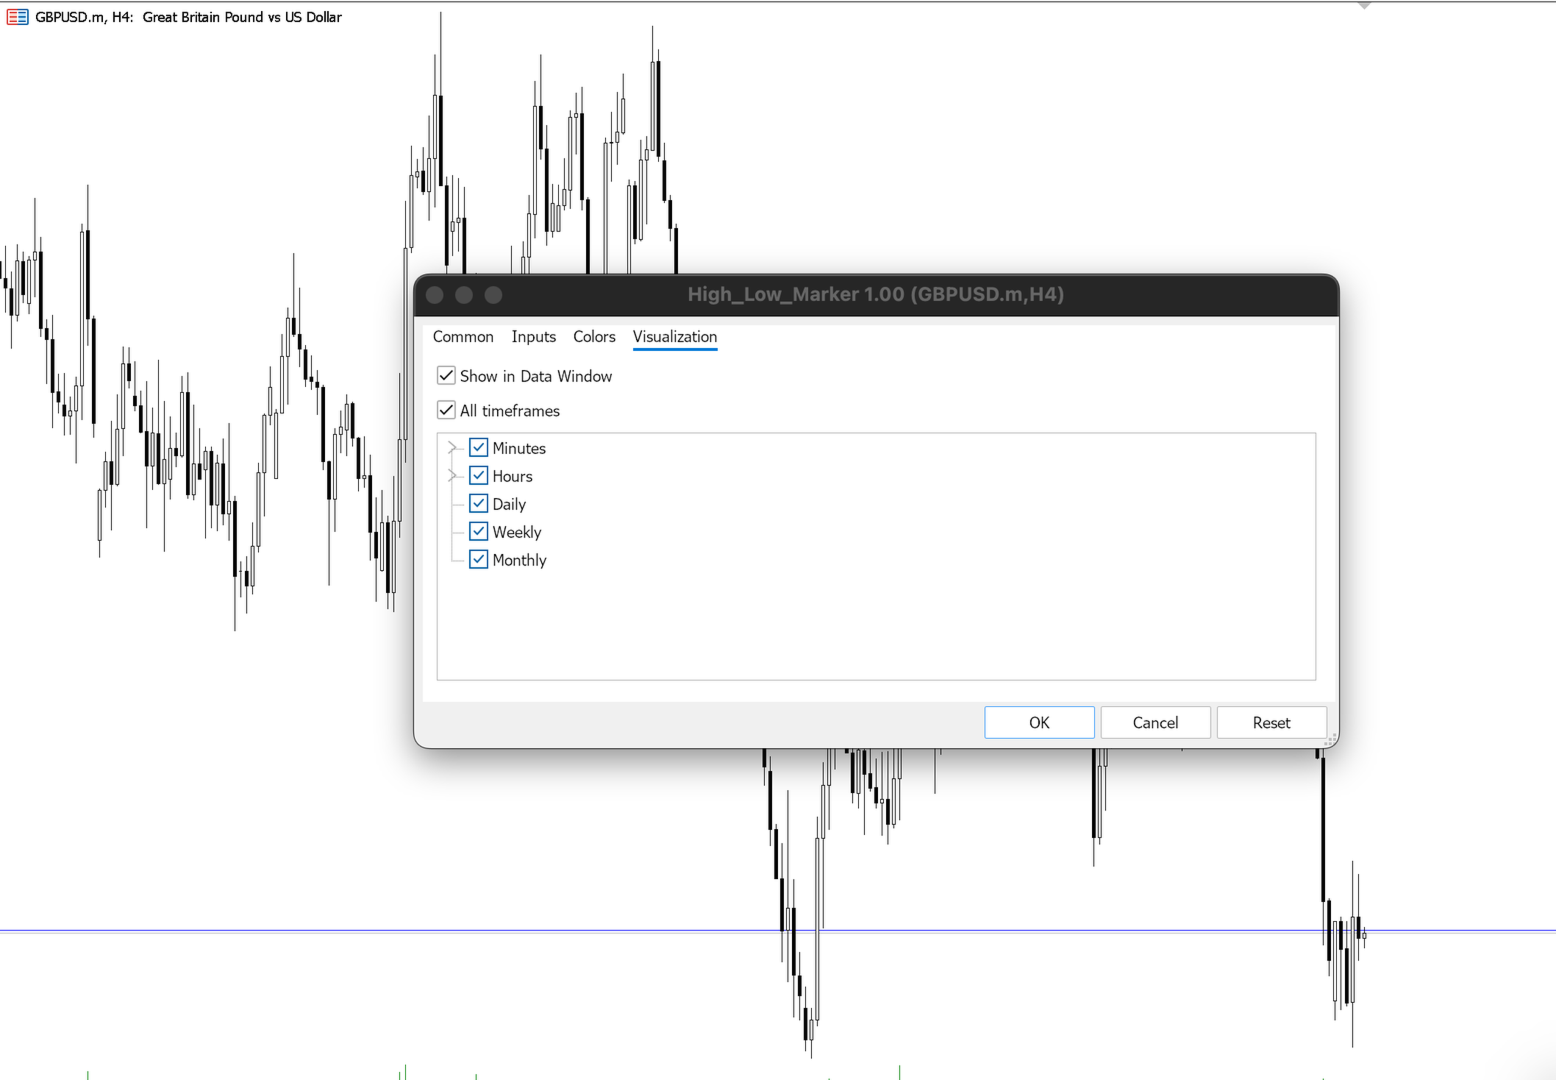
- Multi-Timeframe Coverage: Mark Monthly (MN1), Weekly (W1), and Daily (D1) high and low boundaries simultaneously.
- Non-Destructive Code: Built with strict namespace constraints, the indicator only modifies its own trendlines and will never delete your manually drawn lines, Fibonacci tools, or other chart objects.
- Right-Side Ray Projection: Automatically projects historical levels to the right side of the chart, allowing you to visually anticipate retests and breakouts.
- Configurable History Depth: Adjust exactly how many previous periods back to trace (e.g. show the last 2 months, 3 weeks, or 2 days).
- System Resource Optimized: Runs calculations on a 4-hour cycle to conserve CPU power while maintaining accurate intraday levels.
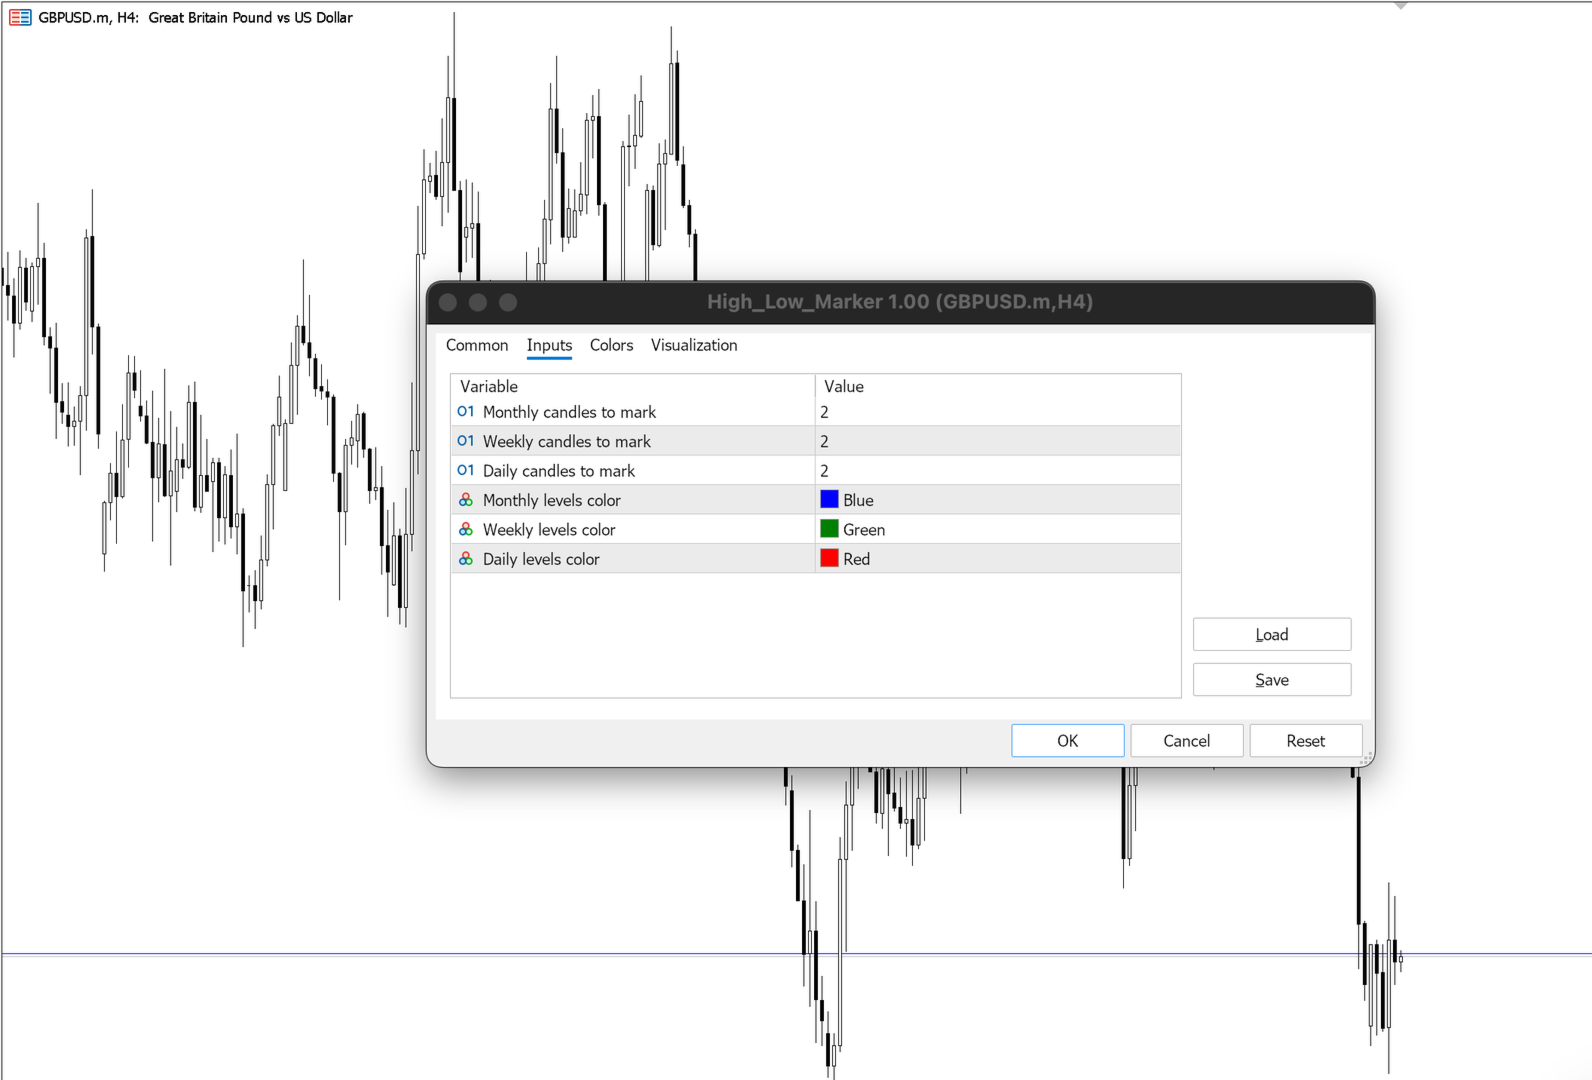
Indicator Inputs and Parameters:
- NumCandlesMN1: The number of previous Monthly candles to track (Default: 2).
- NumCandlesW1: The number of previous Weekly candles to track (Default: 2).
- NumCandlesD1: The number of previous Daily candles to track (Default: 2).
- ColorMonthly: Customize the color of the Monthly high/low lines (Default: Blue).
- ColorWeekly: Customize the color of the Weekly high/low lines (Default: Green).
- ColorDaily: Customize the color of the Daily high/low lines (Default: Red).

ユーザーは評価に対して何もコメントを残しませんでした