Adaptive Alpha EMA

Adaptive Alpha EMA is a next-generation trend indicator that revolutionizes the classic EMA crossover by introducing real-time volatility responsiveness. Unlike traditional EMAs that rely on static periods, Adaptive Alpha EMA measures volatility speed through ATR (Average True Range) and automatically scales the alpha (smoothing factor) of both fast and slow EMAs. The result is an indicator that tightens during low-volatility consolidation and expands during explosive trend moves — delivering earlier entries, fewer whipsaws, and a clearer read on regime changes.

How It Works

The indicator operates on two layers:
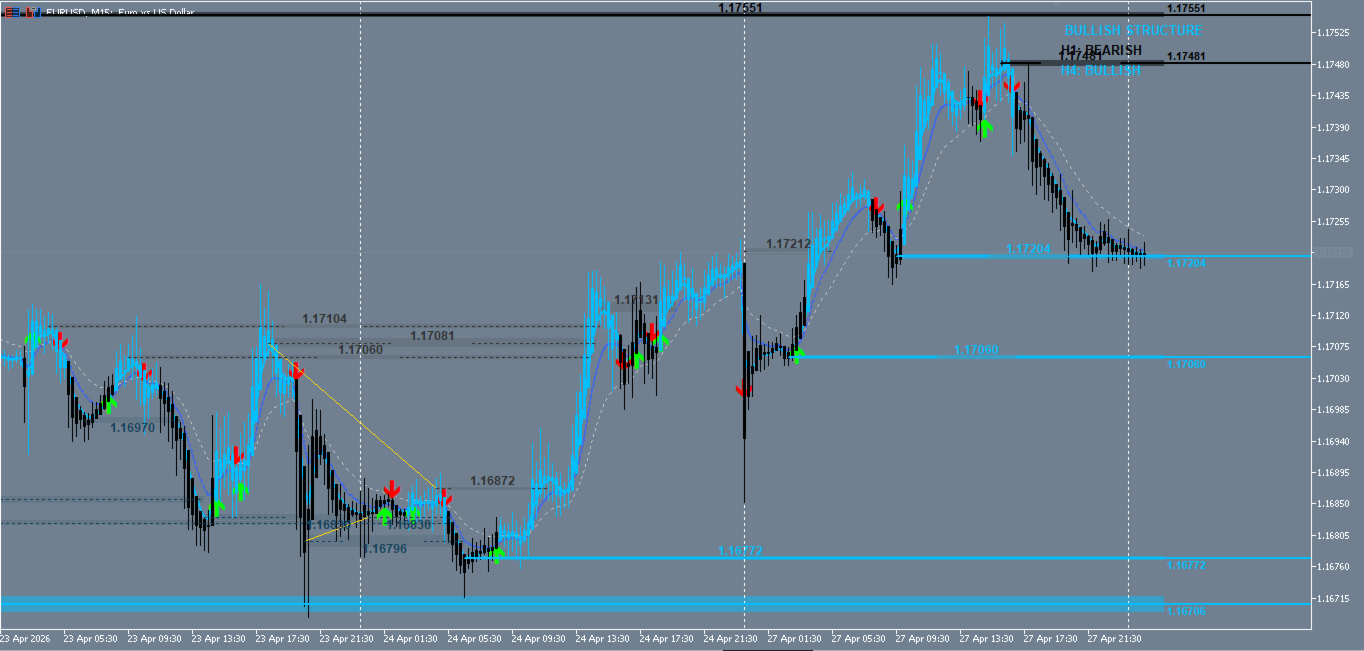
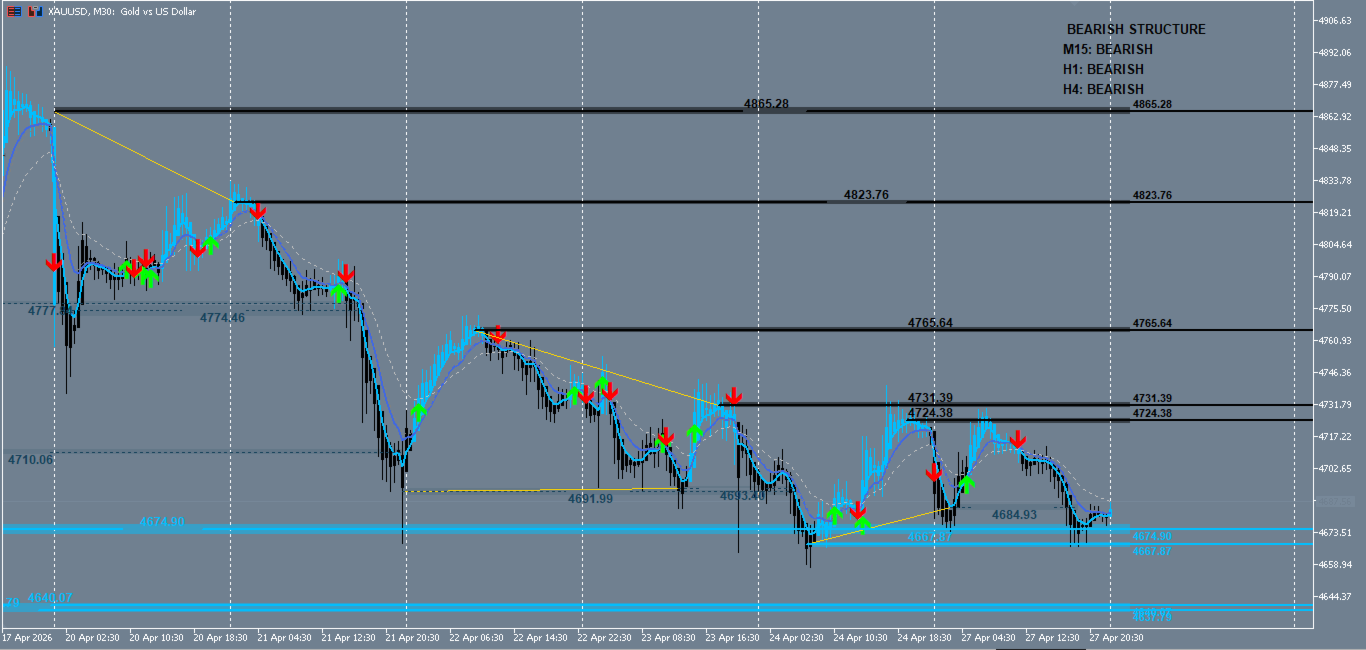
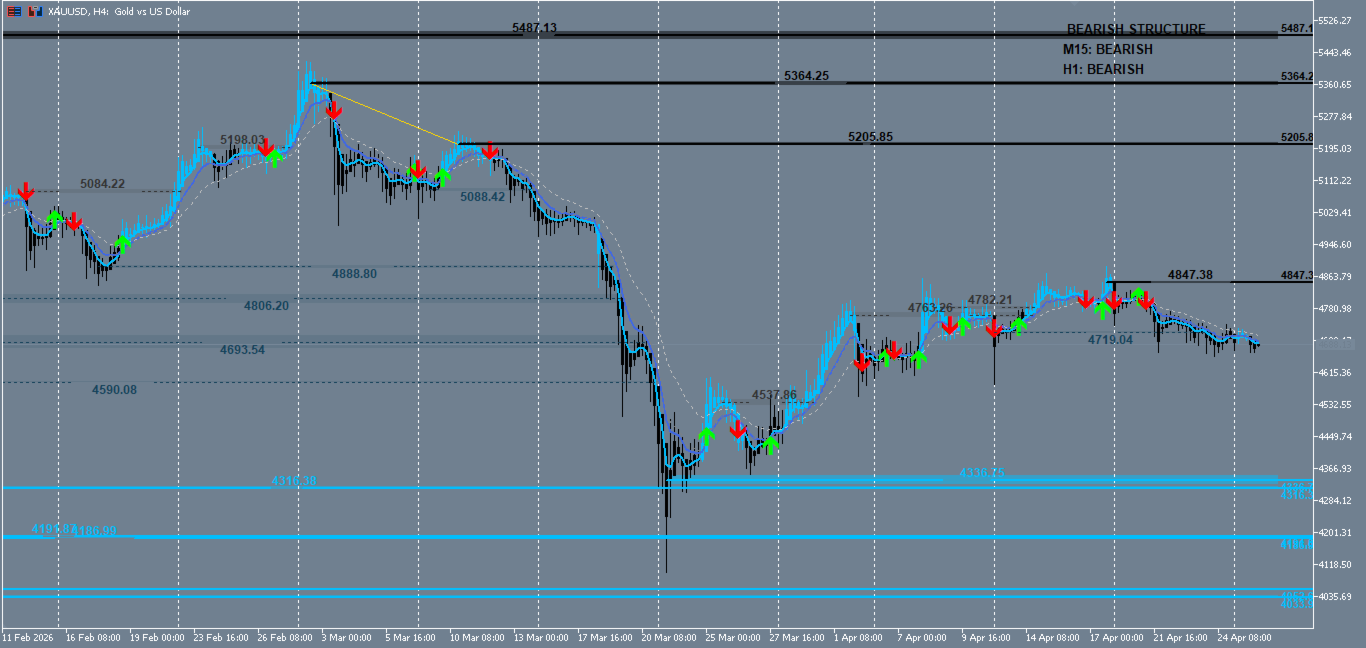
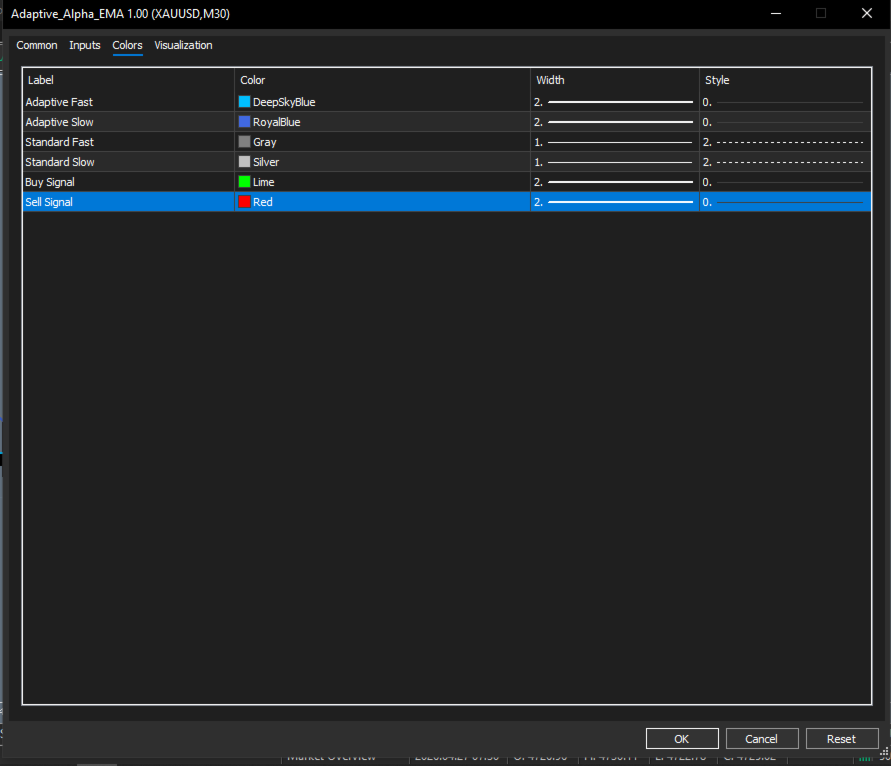
  1. Standard EMAs (dotted gray/silver lines) — Traditional fixed-period EMAs that serve as a visual benchmark. These show you what a normal crossover would look like under static conditions.
  2. Adaptive EMAs (solid blue lines) — Dynamic EMAs whose alpha values scale with the ATR Speed Ratio. This ratio compares the current bar's ATR to the previous bar's ATR. When volatility accelerates (ATR expands), the adaptive alpha increases, making the EMAs more responsive to price. When volatility contracts, alpha decreases, filtering out market noise.
The adaptive alpha is calculated as:
Adaptive Alpha = MIN(MaxAlpha, BaseAlpha × ATR_Speed × Multiplier)
This creates an intelligent smoothing system that breathes with the market.

Key Features

  • Volatility-Adaptive Smoothing — Alpha dynamically scales with ATR speed. No lag in fast markets, no noise in slow markets.
  • Dual Reference System — Standard EMAs plotted alongside Adaptive EMAs so you can visually measure the improvement in real time.
  • 7 Price Sources — Close, Open, High, Low, HL2, HLC3, OHLC4.
  • Crossover Signals — Buy/Sell arrows generated only on adaptive line crosses.
  • Smart Alert Engine — Popup and Push notifications fire once per bar only (no spam on every tick).
  • Robust Input Validation — Invalid parameter combinations are caught on initialization with clear error messages.
  • Show/Hide Standard EMAs — Keep your chart clean when you only want the adaptive lines.
  • Lightweight & Optimized — Minimal CPU overhead with efficient loop structure.
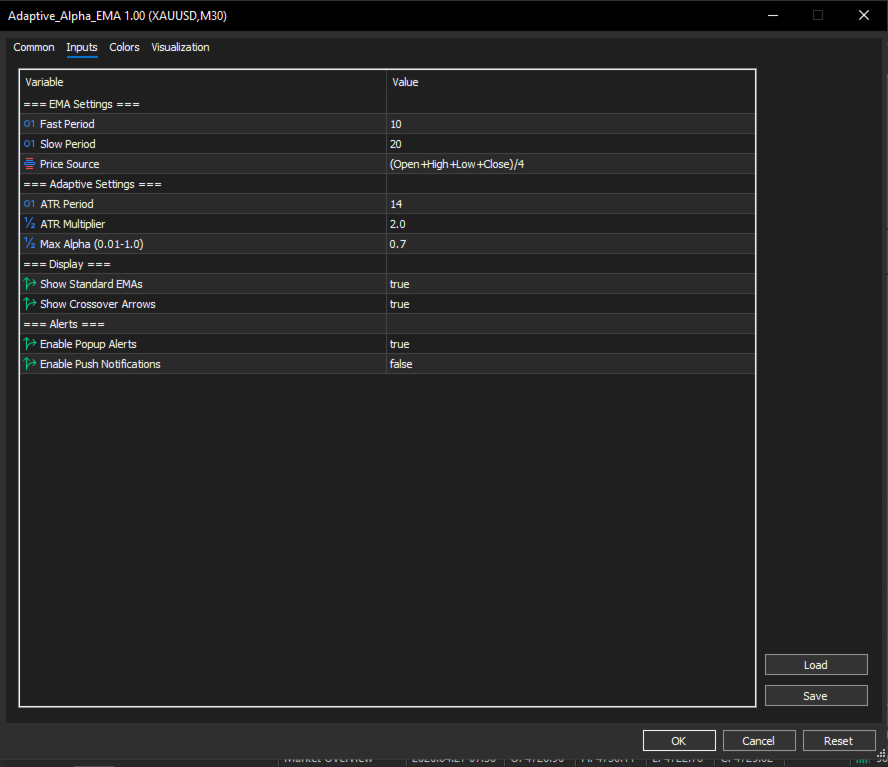
Input Parameters

Table 
Parameter Default Description
Fast Period 10 Base period for the fast EMA
Slow Period 20 Base period for the slow EMA
Price Source OHLC4 Price calculation method (Close, Open, High, Low, HL2, HLC3, OHLC4)
ATR Period 14 Lookback period for ATR calculation
ATR Multiplier 2.0 Scales the magnitude of the adaptive effect
Max Alpha 0.7 Hard ceiling for adaptive alpha (prevents instability)
Show Standard EMAs true Toggle standard reference lines on/off
Show Arrows true Toggle crossover arrows on/off
Enable Alerts true Popup terminal alerts on cross
Enable Push false Mobile push notifications

Interpretation Guide

Table
Condition Meaning
Adaptive Fast crosses above Adaptive Slow Bullish momentum is accelerating; volatility is likely expanding in the direction of the trend
Adaptive Fast crosses below Adaptive Slow Bearish momentum is accelerating
Adaptive lines diverge sharply from Standard EMAs Volatility regime shift — expect stronger directional moves
Adaptive lines hug Standard EMAs closely Low-volatility regime — range-bound or consolidating market
Arrow appears below a candle Confirmed adaptive bullish cross
Arrow appears above a candle Confirmed adaptive bearish cross

Recommended Usage

  • Best Timeframes: H1 and higher for highest signal quality. Works on M15+ for scalping with adjusted periods.
  • Confluence: Combine with horizontal support/resistance, volume analysis, or higher timeframe trend alignment.
  • Avoid: Trading adaptive crosses against the dominant higher timeframe trend.
  • Asset Classes: Forex, Indices, Commodities, Crypto.

Buffers

Table
Index Label Type
0 Adaptive Fast Line
1 Adaptive Slow Line
2 Standard Fast Line (dotted)
3 Standard Slow Line (dotted)
4 Buy Signal Arrow
5 Sell Signal Arrow

Why Traders Need This

Static indicators fail because markets are not static. Volatility regimes change, yet most EMAs are frozen with fixed periods. Adaptive Alpha EMA solves this by letting the indicator breathe with volatility. You get the responsiveness of a short EMA during trends and the stability of a long EMA during chop — automatically, in real time, on every single bar.

おすすめのプロダクト
Caicai L&S Yield Histogram Important Notice: This indicator is an integral tool of the automated EA Caicai Long and Short Pair Trading . This indicator visually displays the percentage deviation (Yield %) of a pair's current spread relative to its own historical mean. It is an excellent tool for quickly visualizing the gross financial potential of a market distortion in Long & Short operations. Main Features: Percentage Visualization: Understand the size of the distortion in palpable percentage
CosmiCLab SMC FIBO CosmiCLab SMC FIBO is a professional trading indicator designed for traders who use Smart Money Concepts (SMC), market structure analysis and Fibonacci retracement levels. The indicator automatically detects market swings and builds Fibonacci levels based on the latest impulse movement. It also identifies market structure changes such as BOS (Break of Structure) and CHOCH (Change of Character), helping traders understand the current market direction. CosmiCLab SMC FIBO also pr
Follow The Line MT5
Oliver Gideon Amofa Appiah
4.6 (35)
This indicator obeys the popular maxim that: "THE TREND IS YOUR FRIEND" It paints a GREEN line for BUY and also paints a RED line for SELL. (you can change the colors). It gives alarms and alerts of all kinds. IT DOES NOT REPAINT and can be used for all currency pairs and timeframes. Yes, as easy and simple as that. Even a newbie can use it to make great and reliable trades. NB: For best results, get my other premium indicators for more powerful and reliable signals. Get them here: https://www.m
FREE
概要 このインジケーターは、クラシックな ドンチャンチャネル を強化したバージョンで、実践的なトレード機能を追加しています。 標準の3本線(上限、下限、中央線)に加え、 ブレイクアウト を検出し、チャート上に矢印で視覚的に表示します。また、チャートを見やすくするために、 現在のトレンド方向と逆側のラインのみを表示 します。 インジケーターの機能: 視覚的シグナル :ブレイクアウト時にカラフルな矢印を表示 自動通知 :ポップアップ、プッシュ通知、Eメール RSIフィルター :市場の相対的な強弱に基づいてシグナルを検証 カスタマイズ可能 :色、ラインの太さ、矢印コード、RSI閾値など 動作原理 ドンチャンチャネルは次のように計算します: 上限線 :直近N本のクローズ済みローソク足の最高値 下限線 :直近N本のクローズ済みローソク足の最安値 中央線 :最高値と最安値の平均値 上方ブレイクアウト は終値が上限線を超えたときに発生し、 下方ブレイクアウト は終値が下限線を下回ったときに発生します。 インジケーターは以下を行います: 3本のドンチャンラインを描画 方向転換後の最初のブレイクアウト
FREE
SMC Venom Model BPR インジケーターは、スマート マネー (SMC) コンセプトで取引するトレーダー向けのプロフェッショナル ツールです。価格チャート上の 2 つの主要なパターンを自動的に識別します。 FVG   (フェアバリューギャップ) は、3 本のローソク足の組み合わせで、最初のローソク足と 3 番目のローソク足の間にギャップがあります。ボリュームサポートのないレベル間のゾーンを形成し、価格修正につながることがよくあります。 BPR   (バランス価格範囲) は、2 つの FVG パターンの組み合わせで、「ブリッジ」を形成します。これは、価格がボリュームアクティビティの少ない動きで動くときに、ブレイクアウトしてレベルに戻るゾーンで、ローソク足の間にギャップを作成します。 これらのパターンは、大規模な市場プレーヤーと一般参加者の相互作用が発生するチャート上のボリュームと価格動向の分析に基づいて、トレーダーが主要なサポート/レジスタンス レベル、ブレイクアウト ゾーン、エントリ ポイントを識別するのに役立ちます。 インジケーターは、長方形と矢印の形でパターンを視覚
Free automatic Fibonacci is an indicator that automatically plots a Fibonacci retracement based on the number of bars you select on the BarsToScan setting in the indicator. The Fibonacci is automatically updated in real time as new highest and lowest values appears amongst the selected bars. You can select which level values to be displayed in the indicator settings. You can also select the color of the levels thus enabling the trader to be able to attach the indicator several times with differe
FREE
Several techniques use volume as an important point in the trade. Whether to indicate strength, exhaustion, pullback weakness, among others. In chief I quote Richard Wyckoff's theory, which said about the importance of looking price and volume. However, there are several possibilities to filter what is volume that should be noticed. PVRSA/PVA users use an indicator with specific colors, which assist in identifying the volume and type of movement that the price has made. Will the high volume
Let us introduce the Heikin Ashi RSI Oscillator! This indicator combines the concepts of Heikin Ashi candles with the RSI (Relative Strength Index) to produce an oscillator-like format that can be used to filter out some of the noise associated with standard RSI readings. This provides traders with a smoother representation of market conditions. Here are some articles to read more about the RSI and Heikin Ashi candles: https://www.investopedia.com/terms/r/rsi.asp https://www.investopedia.com/ter
MACD Enhanced
Nikita Berdnikov
4 (4)
Introducing the MACD  Enhanced – an advanced MACD (Moving Average Convergence Divergence) indicator that provides traders with extended capabilities for trend and momentum analysis in financial markets. The indicator uses the difference between the fast and slow exponential moving averages to determine momentum, direction, and strength of the trend, creating clear visual signals for potential entry and exit points. Attention! To achieve the best results, it is recommended to adapt the indicator
FREE
BREAK RETEST NON-REPAINT. WORKS BEST AT M15 AND ABOVE.  Benefits Fewer false breakouts . Combining close confirmation + retest + previous-close filter greatly reduces noise vs. raw high/low breaks. Tighter execution plans . The drawn level line gives an objective spot for entries, stop placement (just beyond the level), and partial-take-profit structure. Non-repainting confidence . Signals are placed on current bar. Flexible across markets . Works on FX, indices, metals, crypto; scalping on M15
Donchian Pro
Paulo Henrique Faquineli Garcia
4.75 (4)
The Donchian Channel Channels are among the most popular tools of technical analysis, as they visually convey to the analyst the limits within which most price movement tends to occur. Channel users know that valuable information can be obtained at any time, whether prices are in the central region of a band or close to one of the border lines. One of the best known techniques to explore these concepts is Bollinger Bands. However, John Bollinger was not the only one to research the application
FREE
This indicator is a zero-lag indicator and displays  strength of trend change . True Trend  Oscillator Pro works best in combination with True Trend Moving Average Pro that displays exact trend as is. Oscillator value is exact price change in given direction of the trend. True Trend Moving Average Pro: https://www.mql5.com/en/market/product/103586 If you set PERIOD input parameter to 1 this indicator becomes a sharpshooter for binary options. Developers can use True Trend Oscillator in Exper
FREE
Price Magnet — Price Density and Attraction Levels Indicator Price Magnet is a professional analytical tool designed to identify key support and resistance levels based on statistical Price Density. The indicator analyzes a specified historical period and detects price levels where the market spent the most time. These zones act as “magnets,” attracting price action or forming a structural base for potential reversals. Unlike traditional Volume Profile tools, Price Magnet focuses on price-time d
Indicator Description 4 Hull MA Color + Envelopes is a powerful trend-following indicator for MetaTrader 5 that combines four Hull Moving Averages (HMA) with Moving Average Envelopes to clearly identify market direction, trend strength, and potential reversal or pullback zones. This indicator is designed to reduce noise, react quickly to price movement, and provide a clean visual structure for professional trading.   Key Features   4 Hull Moving Averages (20, 50, 100, 200) Automatic color change
FREE
This EA finds Fair Value Liquidity (FVL) on the chart, tracks when they get mitigated , and then looks for an inversion signal (price “fails” through the zone). When that inversion happens, it places a trade in the opposite direction of the original Liquidity gap (an Inverse FVG approach). It also lets you control when it trades using market sessions , and it can auto-close positions at New York open (all positions or profitable-only). Key advantages Clear, rule-based entries (no guessing): trad
FREE
High Low Open Close
Alexandre Borela
4.98 (44)
このプロジェクトが好きなら、5つ星レビューを残してください。 このインジケータは、指定されたためのオープン、ハイ、ロー、クローズ価格を描画します 特定のタイムゾーンの期間と調整が可能です。 これらは、多くの機関や専門家によって見られた重要なレベルです トレーダーは、彼らがより多くのかもしれない場所を知るために有用であり、 アクティブ。 利用可能な期間は次のとおりです。 前の日。 前週。 前の月。 前の四半期。 前年。 または: 現在の日。 現在の週。 現在の月。 現在の四半期。 現年。
FREE
This indicator is especially for the binary trading. Time frame is 1 minutes and exp time 5 or 3 minutes only. You must be use martingale 3 step. So you must put lots size is 10 % at most. You should use Mt2 trading platform to connect with my indicator to get more signal without human working. This indicator wining rate is over 80% but you may get 100% of profit by using martingale 3 step. You should use MT2 Trading Platform to connect meta trader platform and binary platform . You can get mt2
FREE
Description : Rainbow MT5 is a technical indicator based on Moving Average with period 34 and very easy to use. When price crosses above MA and MA changes color to green, then this is a signal to buy. When price crosses below MA and MA changes color to red, then this is a signal to sell. The Expert advisor ( Rainbow EA MT5 ) based on Rainbow MT5 indicator is now available here . MT4 version is available here .
FREE
PROMETHEUS TECHNICAN VERSION Free | By THE SONS A gift from The Sons — no strings, no trial, no expiry. Every trader deserves access to professional-grade market intelligence. That belief is why Prometheus Technical Version exists, and why it costs nothing. Consider it our handshake to the trading community. What You're Getting This is not a simplified tool dressed up as a gift. Prometheus Technican Version is a fully built, institutional-quality technical analysis indicator running a dual-model
FREE
ADVANCED FUNCTIONALITIES: Trend Score (0-100) with visual bar Intelligent signals with adjustable strength (1-10) Risk management with automatic TP/SL Audible and visual alerts Price zones with smooth filling Multi-indicator analysis (RSI, ATR, BB, EMAs) DESIGN FEATURES Modern Visual: Smooth and well-spaced lines (EMA with 2-3px width) Vibrant and professional colors (Sky Blue, Orange, Gold) Modern arrows (code 233/234) for buy/sell signals Configurable dark/light theme Adjustable transparency f
YOU CAN NOW DOWNLOAD FREE VERSIONS OF OUR PAID INDICATORS . IT'S OUR WAY OF GIVING BACK TO THE COMMUNITY ! >>>    GO HERE TO DOWNLOAD The   Volatility Ratio   was developed by Jack D. Schwager to identify trading range and signal potential breakouts. The volatility ratio is defined as the current day's true range divided by the true range over a certain number of days N (i.e. N periods).  How to Use Volatility Ratio The use of a volatility ratio helps to identify situations where the price of
FREE
Candle Countdown — MT5用 正確なローソク足カウントダウン Candle Countdown は、 現在のローソク足が閉じるまでの残り時間 をチャート上に表示するシンプルで正確なツールです。 エントリーがローソク足のクローズに依存する場合、数秒の違いが重要になります。 このインジケーターは正確な時間を表示し、焦らずに判断できるようサポートします。 ローソク足のクローズ時間を正確に把握するためのインジケーターです。 表示内容: ローソク足が閉じるまでの残り時間 サーバー現在時刻 スプレッド ストップレベル(Stop Level) タイマーはティックに依存せず、プラットフォームの内部タイマーによって更新されるため、市場の動きが少ない場合でも安定した表示を維持します。 これにより、低ボラティリティの環境でも滑らかで安定したカウントダウンを実現します。 情報は背景付きのブロック内に表示されるため、どのチャートカラーでも見やすく、分析の妨げになりません。 ローソク足のクローズが近づくと、タイマーの色が変化し、視覚的に状況を把握しやすくなります。 MT4版はこちら: Cand
FREE
RBreaker Gold Indicatorsは、金先物の短期日内取引戦略であり、トレンドフォローと日内反転の2つの取引手法を組み合わせたものです。トレンド相場での利益を捉えるだけでなく、相場が反転した際には迅速に利確し、その流れに沿ってポジションを反転させることができます。 この戦略は、アメリカの雑誌『Futures Truth』において、15年連続で最も収益性の高い取引戦略トップ10に選ばれた実績を持ち、非常に長いライフサイクルを誇り、現在も国内外で広く使用・研究されています。 本インディケーターは、2026年の金先物の値動きに対応し、14日間のATR指標に基づいて、ブレイクアウト係数A、観察係数B、リバーサル係数Rをより合理的な値で定義しています。非常に優れたインディケーターであり、安定的な年間収益を実現しています。ぜひおすすめします〜
Are you tired of drawing trendlines every time you're analyzing charts? Or perhaps you would like more consistency in your technical analysis. Then this is for you. This indicator will draw trend lines automatically when dropped on a chart. How it works Works similar to standard deviation channel found on mt4 and mt5. It has 2 parameters: 1. Starting Bar 2. Number of bars for calculation The   starting bar   is the bar which drawing of the trend lines will begin, while the   number of bars for c
FREE
Donchian Channel is an indicator created by Richard Donchian. It is formed by taking the highest high and the lowest low of the last specified period in candles. The area between high and low is the channel for the chosen period. Its configuration is simple. It is possible to have the average between the upper and lower lines, plus you have alerts when price hits one side. If you have any questions or find any bugs, please contact me. Enjoy!
FREE
Noize Absorption Index - is the manual trading system that measures the difference of pressure between bears forces and bulls forces. Green line - is a noize free index that showing curent situation. Zero value of index shows totally choppy/flat market.Values above zero level shows how powerfull bullish wave is and values below zero measures bearish forces.Up arrow appears on bearish market when it's ready to reverse, dn arrow appears on weak bullish market, as a result of reverse expectation.
== LT RAINBOW TREND - 36本の移動平均線を持つトレンドインジケーター == 概要 LT Rainbow Trendは、36本の移動平均線を同時に処理し、スマートなカラーシステム(レインボー)を搭載した先進的なトレンド分析テクニカルインジケーターです。主力のトレンド方向へ最大の視覚的明瞭さをもって取引したいトレーダーのために開発され、マルチタイムフレーム分析の複雑さを、シンプルでカラフル、かつ非常に直感的なビジュアルへと変換します。 「トレンドは友達(The trend is your friend)」であることを理解しているトレーダーに最適です。このインジケーターは、トレンドの強さ、方向、そして潜在的な反転を常に事前に見極めることを可能にします。 仕組み インジケーターは、4つのトレンドゾーンに分散された36本の移動平均線を監視します: 赤(トレンド転換ゾーン) 31〜20番目の移動平均線 トレンドが反転する可能性を示す強いサイン オレンジ(トレンド減速ゾーン) 19〜10番目の移動平均線 トレンドの勢いが失われつつあるが、継続の可能性もあるサ
Fvg Edge
Ahmad Meftah Abdulsalam Alawwami
5 (3)
FVG Smart Zones – 無料版 MetaTrader 5 (MT5)用 公正価値ギャップ(FVG)検出インジケーター ただのランダムなインジケーターではなく、 本格的なトレーディングツール をお探しですか? FVG Smart Zones – 無料版 は、公正価値ギャップ(FVG)を自動で検出し、チャート上に 高確率トレーディングゾーン をハイライトして、プロフェッショナルな市場の洞察を提供します。 以下のトレーダー向けに設計されています: スマートマネーコンセプト (SMC) ICTトレーディングコンセプト プライスアクション (Price Action) 需給分析 (Supply & Demand) 機関投資家向けトレーディング戦略 このインジケーターは、 価格が反応しやすいゾーン に集中するのを助けます。 主な機能 スマートゾーン検出 上昇・下降FVGの自動検出 クリーンでプロフェッショナルなビジュアルゾーン 弱い、または関連性の低いギャップを除去するインテリジェントフィルター 高度な確認機能 上位時間軸(HTF)
FREE
HAS RSI Signal — SL/TP自動計算機能付き プロフェッショナル・トレンドインジケーター HAS RSI Signal は、信頼性の高いクラシックな手法と最新のノイズ除去アルゴリズムを融合させた強力なトレーディングツールです。 平均足スムーズド(Heiken Ashi Smoothed) と RSI を組み合わせることで、トレンドの転換点や買われすぎ・売られすぎ圏からの脱出タイミングを正確に捉え、明確なエントリーシグナルを提示します。 主な特徴: 二重のフィルタリング: 平均足スムーズドで市場の「ノイズ」を除去し、RSIで勢い(モメンタム)の強さを確認します。 損切り・利確ラインの自動計算: 単にシグナルを出すだけでなく、ボラティリティ( ATR )に基づいた最適なストップロス(SL) と テイクプロフィット(TP)を自動で算出します。 視覚的な分かりやすさ: シグナルはチャート上にカラーキャンドルとして表示されるため、一目でトレンドを把握でき、取引画面をスッキリと保てます。 充実の通知機能: アラート、音声、スマートフォンへのプッシュ通知機能を搭載。チャンスを逃すこと
Important Lines
Terence Gronowski
4.88 (24)
This indicator displays Pivot-Lines, preday high and low, preday close and the minimum and maximum of the previous hour. You just have to put this single indicator to the chart to have all these important lines, no need to setup many single indicators. Why certain lines are important Preday high and low : These are watched by traders who trade in a daily chart. Very often, if price climbs over or falls under a preday low/high there is an acceleration in buying/selling. It is a breakout out of a
FREE
このプロダクトを購入した人は以下も購入しています
Neuro Poseidon is a new indicator by Daria Rezueva. It combines precise trading signals with adaptive TP/SL levels - creating best possible trades as a result! Message me and get  Neuro Poseidon Assistant  as a gift to automize your trading process! What makes it stand out? 1. Proven profitability on all assets and timeframes 2. Only confirmed BUY and SELL signals present on the chart 3. Adaptive TP & SL levels generated by the software for each trade 4. Easy to understand - suitable for al
SuperScalp Pro
Van Minh Nguyen
4.67 (27)
SuperScalp Pro – 高度なマルチフィルタースキャルピングインジケーターシステム SuperScalp Pro は、クラシックな Supertrend と複数のインテリジェント確認フィルターを組み合わせた高度なスキャルピングインジケーターです。M1 から H4 まで複数の時間足で効率的に動作し、XAUUSD、BTCUSD、主要 Forex 通貨ペア向けに最適化されています。 このインジケーターは明確な Buy / Sell シグナルを提供し、ATR に基づいてエントリー価格、Stop Loss、Take Profit を自動計算します。Fibonacci Take Profit 機能により、重要な価格帯で早期決済し、到達時に通知を送信します。 初期設定では Fibonacci Take Profit が有効化されており、より安定した取引体験を重視しています。チャートに適用するだけですぐ利用可能です。上級者向けに、すべてのパラメータは自由にカスタマイズできます。 完全なドキュメントは製品ブログにあります: [User Guide] SuperScalp Pro Auto T
まず正直に言いましょう。 どんなインジケーターも、それ単体であなたを利益化させることはできません。もしそう言う人がいるなら、それは夢を売っているだけです。完璧な売買シグナル(矢印)を表示するインジケーターは、いくらでも“完璧に見せる”ことができます。正しい過去の区間を拡大して、勝ちトレードだけを切り取ればいいだけです。私たちはそれをしません。 SMC Intraday Formula はツールです。 市場構造を読み取り、最も高い確率の価格ゾーンを特定し、今この瞬間のスマートマネーの痕跡をシンプルな言葉で正確に示します。最終判断はあなたが行います。トレードを実行するのもあなたです。しかし今は「希望」ではなく「精度」でエントリーできます。 私たちはこのインジケーターを、ゴールド(XAUUSD)および主要FX通貨ペアで約3年間、日々のスキャルピングに使用してきました。M1、M5、M15、M30の主要ツールです。これは未来を予測しようとするのではなく、今まさに形成されている高確率セットアップを示し、その理由を説明します。 他のすべてのインジケーターと何が違うのか? ほとんどのトレーディングイ
Gold Entry Sniper – ゴールドスキャルピング&スイングトレード用プロフェッショナル多時間足ATRダッシュボード Gold Entry Sniper は、XAUUSDや他の銘柄向けに正確な 売買シグナル を提供する、MetaTrader 5用の高度なインジケーターです。 ATRトレーリングストップロジック と 多時間足分析ダッシュボード を搭載し、スキャルピングからスイングトレードまで対応します。 主な特徴と利点 多時間足シグナル分析 – M1、M5、M15 のトレンドを同時表示。 ATRベースのトレーリングストップ – ボラティリティに応じて動的に調整。 プロ仕様のチャートダッシュボード – シグナル状況、ATRレベル、回帰線、売買方向を表示。 明確な売買マーカー – 自動矢印とテキストラベル。 エグジットアラートとトレード管理 – 利益確定のための自動検出。 完全カスタマイズ可能 – パネル位置、色、フォント、ATR/回帰設定を調整可能。 ゴールド(XAUUSD)に最適化 – M1〜M15のスキャルピングに最適、FXや指数、暗号資産にも対応。 Gold Entry
Quantum TrendPulse を ご紹介します。これは、   SuperTrend   、   RSI   、および Stochastic のパワーを 1 つの包括的なインジケーターに組み合わせて、取引の可能性を最大限に引き出す究極の取引ツールです。精度と効率を求めるトレーダー向けに設計されたこのインジケーターは、市場のトレンド、勢いの変化、最適なエントリー ポイントとエグジット ポイントを自信を持って特定するのに役立ちます。 主な特徴: SuperTrend 統合: 現在の市場動向に簡単に追従し、収益性の波に乗ることができます。 RSI精度: 買われすぎと売られすぎのレベルを検出し、市場の反転のタイミングに最適で、SuperTrendのフィルターとして使用されます。 確率的精度: 確率的振動を活用して、変動の激しい市場で隠れたチャンスを見つけます。SuperTrend のフィルターとして使用されます。 マルチタイムフレーム分析:   M5 から H1 または H4 まで、さまざまなタイムフレームで市場を常に把握します。 カスタマイズ可能なアラート: カスタム取引条件が満たされ
Entry In The Zone and SMC Multi Timeframe is a real-time 2-in-1 market analysis tool that combines market structure analysis and a No Repaint BUY / SELL signal system into a single indicator, built on Smart Money Concepts (SMC) — a widely adopted framework used by professional traders to understand market structure. This indicator helps you see the market more clearly, make decisions based on structure rather than guesswork, and focus on high-probability zones where price is more likely to react
このインジケーターを購入された方には、以下の特典を 無料 で提供しています: 各トレードを自動で管理し、ストップロスとテイクプロフィットを設定し、戦略ルールに基づいてポジションを決済する補助ツール 「Bomber Utility」 様々な銘柄に合わせたインジケーターの設定ファイル(セットファイル) 「最小リスク」、「バランスリスク」、「待機戦略」 の3つのモードで使用できる Bomber Utility 用の設定ファイル このトレーディング戦略をすぐに導入・設定・開始できる ステップバイステップのビデオマニュアル ご注意: 上記の特典を受け取るには、MQL5のプライベートメッセージシステムを通じて販売者にご連絡ください。 オリジナルのカスタムインジケーター 「Divergence Bomber(ダイバージェンス・ボンバー)」 をご紹介します。これは、MACDのダイバージェンス(乖離)戦略に基づいた 「オールインワン」型のトレーディングシステム です。 このテクニカルインジケーターの主な目的は、価格とMACDインジケーターの間に発生するダイバージェンスを検出 し、将来の価格の動きを示す
この製品は 2026 年の市場向けに更新され、最新の MT5 ビルドに最適化されています。 価格更新のお知らせ: Smart Trend Trading System は現在 $99 で提供されています。 次の 30 件の購入 後、価格は $199 に上がります。 特別オファー: Smart Trend Trading System を購入後、私にプライベートメッセージを送ることで、 Smart Universal EA を無料 で受け取り、Smart Trend のシグナルを自動売買に変えることができます。 Smart Trend Trading System は、リペイントなし、再描画なし、遅延なしの完全なトレーディングシステムです。よりクリーンなシグナル、より明確なトレンド方向、そしてより整理された取引方法を求めるトレーダー向けに作られています。 Online course , manual and download presets . このシステムは、トレンド検出、反転ゾーン、Smart Cloud、トレーリングストップロジック、サポートとレジスタンス、ローソク足の色分け、ア
M1 Quantum は、M1専用のプロフェッショナルトレーディングシステムであり、ストップロス、テイクプロフィット、スマートな資金管理を内蔵した、迅速かつ正確な取引シグナルを提供します。 M1 Quantum は、 連続勝利 に重点を置いて口座を素早く成長させるために設計されたプロフェッショナルな資金管理を備えています。 M1 Quantum インジケーター の主な特徴 M1時間足 およびすべての 主要通貨ペア 向けに設計 すべての取引にストップロスとテイクプロフィットを設定 資金管理 を実装し、トレーダーが簡単に取引できるようサポート 高い勝率と高い 連続勝利 リペイントなし、遅延なし あらゆるトレーダーにとって理解しやすい M1 Quantum を使用するには、 M1 Quantum Assistant が必要です。この強力なツールは、M1 Quantum をご購入いただいたすべてのお客様に 無料 で提供されています。 M1 Quantum Assistant をダウンロード 私のMQL5 チャンネルに参加して、最新のアップデートや新製品のリリース情報を入手してください。 価格は
トレンドキャッチャーインジケーター トレンドキャッチャーインジケーターは、開発者独自の適応型トレンド分析指標を組み合わせることで、市場価格の動きを分析します。短期的なノイズを除去し、根底にあるモメンタムの強さ、ボラティリティの拡大、価格構造の挙動に焦点を当てることで、真の市場方向性を特定します。また、移動平均線、RSI、ボラティリティフィルターなどの平滑化およびトレンドフィルタリング機能を備えたカスタマイズ指標も使用します。 実際の運用状況のモニタリングやその他の製品については、こちらをご覧ください: https://www.mql5.com/en/users/mechanic/seller ご注意ください。私はTelegramでEAや設定を販売していません。詐欺です。すべての設定はブログで無料で公開しています。 重要!ご購入後すぐにご連絡ください。手順とボーナスをお送りします!
SignalTech is an unique fully rule based trading system delivers an Institutional approach for both Independent Traders and Prop Firm Challengers. Never Repaint. Push Notification available. No over-optimization. All the winning trades with chart setups are published on the comments page. 2026-05 4107 Pips (Until 05-29 NY Closed) 2026-04 2243 Pips 2026-03 2165 Pips 2026-02 2937 Pips 2026-01 2624 Pips 2025-12 1174 Pips It can generate signals with Buy/Sell Arrows, Push Notification (To Mobile) an
PrimeScalping is a powerful trading companion designed to generate high-probability entry signals with dynamic TP/SL/DP levels based on volatility. Built-in performance tracking shows win/loss stats, PP1/PP2 hits, and success rates — all updated live. Key Features: Buy/Sell signals with adaptive volatility bands Real-time TP/SL/DP levels based on ATR Built-in MA Filter with optional ATR/StdDev volatility Performance stats panel (Success, Profit/Loss, PP1/PP2) Alerts via popup, sound, push, or e
FX Trend NG:次世代マルチマーケット・トレンドインテリジェンス 概要 FX Trend NG は、複数の時間足に対応したプロフェッショナル向けトレンド分析およびマーケット監視ツールです。 市場全体の構造を数秒で把握することができます。 複数のチャートを切り替える必要はありません。どの銘柄がトレンド中なのか、どこでモメンタムが弱まっているのか、そしてどの時間足で強い整合性があるのかを瞬時に確認できます。 ローンチ特別オファー – FX Trend NG を $30(6ヶ月) または $80 永久ライセンス でご利用いただけます。 すでに Stein Investments のユーザーですか? -> メッセージを送信 して、プライベートグループへアクセスしてください。 セットアップや詳細情報が必要ですか? -> Stein Investments 公式ページ をご覧ください。 1. FX Trend NG が他と異なる理由 3ステート・トレンドロジック ― Buy と Sell だけではない • 多くのインジケーターは Buy または Sell の2状態のみを表示します。
Power Candles V3 - 自己最適化型強弱インジケーター Power Candles V3は 、通貨や銘柄の強さを、適用されたすべてのチャート上で実行可能なトレードプランに変換します。単にローソク足を色分けするだけでなく、バックグラウンドでリアルタイムの自動最適化を実行し、目の前の銘柄に対して最適なストップロス、テイクプロフィット、およびシグナルの閾値を提示します。ワンクリックで実取引に適用でき、エントリーポイント、ストップロス、テイクプロフィットのラインが正確な価格位置にチャート上に表示され、方向性を示すアラートがリアルタイムで発動します。 このツールは、Stein Investmentsのエコシステムの一部です。  18種類以上のツールをすべて閲覧し、AIを活用したセットアップの推奨事項を入手し、  https://stein.investments でコミュニティに参加しましょう クローズしたバーごとに3,000回以上のトレードシミュレーション。9つの強さの状態。2つの戦略を並行してテスト。勝率の高い設定をワンクリックで適用。 なぜこれが必要なのか ほとんどの強
この製品は 2026 年の市場向けに更新され、最新の MT5 ビルドに最適化されています。 価格更新のお知らせ: Atomic Analyst は現在 $99 で提供されています。 次の 30 件の購入 後、価格は $199 に上がります。 特別オファー: Atomic Analyst を購入後、私にプライベートメッセージを送ることで、 Smart Universal EA を無料 で受け取り、Atomic Analyst のシグナルを自動売買に変えることができます。 Atomic Analyst は、リペイントなし、再描画なし、遅延なしの Price Action トレーディングインジケーターで、手動取引、シグナルの明確化、EA 自動化のために設計されています。 User manual: settings, inputs and strategy. 価格行動、強さ、モメンタム、マルチタイムフレーム方向、高度なフィルターを分析し、トレーダーがノイズを減らし、弱いセットアップを避け、より構造化された取引判断を行えるようにします。 このインジケーターは、複雑な市場計算をシンプルな視覚シ
GoldenX Entryは、MT5向けのインジケーターであり、適応型Smart Entry Trendアルゴリズム、シグナルスコアリングシステム、マーケットレジーム検出機能、およびボラティリティフィルターを備えています。各シグナルには、計算されたエントリーレベル、3つのテイクプロフィット(TP1、TP2、TP3)、およびストップロスレベルが含まれます。本インジケーターは、異なる市場環境に適応するために設計された複数の分析レイヤー上に構築されており、マルチレイヤー分析システムと内蔵オプティマイザーおよび統計トラッキングシステムを組み合わせています。リスク・リワード(RR)指標および過去のトレード履歴に基づく定量分析を提供します。 使い始めは簡単です — 選択した時間足でオプティマイザーを実行し、そのままチャート上でインジケーターを使用します。 コア機能 GoldenX Entryは、シグナルエンジンとトレード管理機能、そして過去統計トラッキングを1つのチャートに統合しています: - 内蔵オプティマイザー: オプティマイザーはチャート上でワンクリックで実行できます。200通りのパラメー
UZFX {SSS} スキャルピング・スマートシグナル MT5は、変動の激しい市場において正確かつリアルタイムのシグナルを求めるスキャルパー、デイトレーダー、スイングトレーダー向けに設計された、リペイントしない高性能な取引インジケーターです。(UZFX-LABS)によって開発されたこのインジケーターは、価格行動分析、トレンド確認、スマートフィルタリングを組み合わせることで、すべての通貨ペアおよび時間軸において、高確率の売買シグナルを生成します。 推奨* 最適な時間足:15分足以上。 {1時間足}が私のお気に入りです。そして、その成果は驚くべきものです...! 注:{ LTL 164343 }インジケーターと組み合わせることで、シグナルの勝率を高めることができます。 LTLシグナルでトレンドを判断し、SSSシグナルをエントリーシグナルとして活用してください。 このアプローチにより勝率が最大化され、誤ったシグナルの発生を防ぐことができます。 主な機能 スマートシグナル検出 – 強力なトレンド反転や継続パターンを正確に特定します。 マルチタイムフレーム・スキャルピング – すべての時間
Gann Made Easy   は、ミスター・ギャンの理論を使用した取引の最良の原則に基づいた、プロフェッショナルで使いやすい外国為替取引システムです。 W・D・ガン。このインジケーターは、ストップロスとテイクプロフィットレベルを含む正確な買いと売りのシグナルを提供します。 PUSH通知を利用して外出先でも取引可能です。 ご購入後、取引方法の説明と優れた追加インジケーターを無料で入手するには、私にご連絡ください! おそらく、ギャンの取引手法についてはすでに何度も聞いたことがあるでしょう。通常、ギャンの理論は初心者のトレーダーだけでなく、すでにある程度の取引経験がある人にとっても非常に複雑なものです。なぜなら、ギャンの取引手法は理論的にはそれほど簡単に適用できるものではないからです。私はその知識を磨き、最良の原則を私の外国為替インジケーターに組み込むために数年を費やしました。 このインジケーターは非常に簡単に適用できます。必要なのは、それをチャートに添付し、簡単な取引推奨事項に従うだけです。このインジケーターは常に市場分析の仕事を行い、取引の機会を探します。適切なエントリーポイントを検
SmartScalping is a powerful trading companion designed to generate high-probability entry signals with dynamic TP/SL/DP levels based on volatility. Built-in performance tracking shows win/loss stats, PP1/PP2 hits, and success rates — all updated live. Key Features: Buy/Sell signals with adaptive volatility bands Real-time TP/SL/DP levels based on ATR Built-in MA Filter with optional ATR/StdDev volatility Performance stats panel (Success, Profit/Loss, PP1/PP2) Alerts via popup, sound, push, or e
GEM Signal Pro GEM Signal Pro は、MetaTrader 5 向けのトレンドフォロー型インジケーターです。より明確なシグナル、より整理されたトレードセットアップ、そして実用的なリスク管理をチャート上で確認したいトレーダーのために設計されています。 単純な矢印だけを表示するのではなく、GEM Signal Pro はトレード全体の考え方を、より見やすく分かりやすい形で表示します。条件が確認されると、インジケーターはエントリー価格、ストップロス、利確目標をチャート上に表示し、トレードセットアップをより効率的に確認できるようにします。 動作の仕組み このインジケーターは、まず内部ロジックに基づいて有効なシードシグナルを検出します。 確認条件が満たされると、GEM Signal Pro はチャート上に完全なセットアップを表示します。これにより、トレーダーはトレード構造をより明確に把握し、手作業による分析を減らすことができます。 チャート上のトレードレベル 確認済みシグナルに対して、GEM Signal Pro は以下を表示できます。 エントリー価格 ストップロス テ
ARIPoint
Temirlan Kdyrkhan
1 (1)
ARIPoint is a powerful trading companion designed to generate high-probability entry signals with dynamic TP/SL/DP levels based on volatility. Built-in performance tracking shows win/loss stats, PP1/PP2 hits, and success rates all updated live. Key Features: Buy/Sell signals with adaptive volatility bands Real-time TP/SL/DP levels based on ATR Built-in MA Filter with optional ATR/StdDev volatility Performance stats panel (Success, Profit/Loss, PP1/PP2) Alerts via popup, sound, push, or email Cu
MasterTrend Indicator for MT5 A powerful trend-following and signal-evaluation tool MasterTrend   is a custom MT5 indicator that combines Moving Averages and ATR-based risk/reward logic to generate clear buy/sell signals. It visualizes dynamic SL/TP levels, evaluates past trade outcomes, and displays win/loss statistics in a clean on-chart panel. Key features include: Buy/Sell signals based on MA crossovers ATR-based SL/TP1/TP2/TP3 levels with visual lines and labels Signal outcome tracking wit
Crystal Heikin Ashi Signals - Professional Trend & Signal Detection Indicator Advanced Heikin Ashi Visualization with Intelligent Signal System for Manual & Automated Trading Final Price: $149 ---------> Price goes up $10 after every 10 sales . Limited slots available — act fast . Overview Crystal Heikin Ashi Signals is a professional-grade MetaTrader 5 indicator that combines pure Heikin Ashi candle visualization with an advanced momentum-shift detection system. Designed for both manual traders
Azimuth Pro
Ottaviano De Cicco
5 (7)
Azimuth Pro V2:MT5向けシンセティック・フラクタル構造分析と確認済みエントリー 概要 Azimuth Pro は Merkava Labs によるマルチレベルスイング構造インジケーターです。4つのネストされたスイングレイヤー、スイングアンカーVWAP、ABCパターン検出、3タイムフレーム構造フィルタリング、そして確定バーでの確認済みエントリー — 1つのチャートで、ミクロスイングからマクロサイクルまでを網羅するワークフロー。 これはブラインドシグナル製品ではありません。ロケーション、コンテキスト、タイミングを重視するトレーダーのための構造ファーストワークフローです。 V2発売記念オファー — Azimuth Pro V2をUSD 399で(次の100本)。最終価格:USD 499。 1. V2での変更点 シンセティック・マルチタイムフレームエンジン 上位タイムフレーム分析をMeridian Proと同じ独自のシンセティックアーキテクチャで一から再構築。よりクリーンなHTFコンテキスト、安定したライブ動作、従来のMTF同期問題なし。シンセティックエンジンは 固定比率タ
ScalpPoint is a powerful trading companion designed to generate high-probability entry signals with dynamic TP/SL/DP levels based on volatility. Built-in performance tracking shows win/loss stats, PP1/PP2 hits, and success rates — all updated live. Key Features: Buy/Sell signals with adaptive volatility bands Real-time TP/SL/DP levels based on ATR Built-in MA Filter with optional ATR/StdDev volatility Performance stats panel (Success, Profit/Loss, PP1/PP2) Alerts via popup, sound, push, or emai
Reversion King Indicator
Eugen-alexandru Zibileanu
5 (4)
新たな王者が登場 - インジケーター + 注文管理表示(TP1 + TP2 + TP3)+ オプションのTelegramシグナル送信機能付き(無料) (完全なトレード&シグナルシステム) ゴールド向け最高のEA: Gold Slayer このインジケーターには、高度な戦略、カスタマイズ可能な注文管理システム、そしてエンベロープ拡張を組み合わせた平均回帰システムが搭載されています。さらに、RSIなど複数のインテリジェントな確認フィルターによって、高確率の反転エントリーをBUY・SELLシグナルとして検出します。 単にトレードを学ぶだけでなく、複数ポジションを効果的に管理し、過去に利益を出しているオープンポジションで損失トレードをカバーする方法も学べます。 M5向けに構築・最適化されており、流動性が高くシグナルの精度が安定しているBTCUSDとXAUUSDで優れたパフォーマンスを発揮します。 このインジケーターは、ATRを基に自動計算されたエントリー、ストップロス、テイクプロフィットレベルを備えた明確なLong・Shortシグナルを提供するため、リスク管理が最初から組み込まれています。 マ
MT4版もご用意しています https://www.mql5.com/ja/market/product/170617  M30/H1/H4スイング版もあります M5/M15では取りきれない大きな波を狙いたい方へ。 Gold Signal Swing Pro(M30/H1/H4対応)を販売中。 1トレードで$20〜$80+の値幅を狙う。 https://www.mql5.com/en/market/product/177643 KURAMA GOLD SIGNAL PRO(MT5版)— 7層フィルター搭載 XAUUSD完全トレードシステム リペイントなし。リドローなし。ラグなし。すべてのサインは確定後に変わりません。 購入者限定特典:買い切りライセンスをご購入いただいた方に、AI Zone Radar($59相当)+PDFマニュアルを無料プレゼント。購入後にMQL5でメッセージをお送りください。 AI Zone Radar:
Quant Direction は、3次元の市場分析ツールです。完全に客観的なアルゴリズムベースの市場分析を提供し、様々なパラメータにわたる正確なパーセンテージ偏差を同時に算出します。高度なAI搭載モデリングツールで開発され、厳密なテストを経て開発されたこのアルゴリズムは、かつてない精度で市場を分析するように設計されています。プラットフォーム上では、あらゆる通貨ペアや金融商品を分析できます。 短期取引、デイトレード、スイングトレードなど、どのような取引スタイルに も、Quant Directionは最適な選択肢です。 オペレーターの本当の利点 Quant Directionの真の利点は、感情、眼精疲労、過剰分析を完全に排除できる点にあります。方向性を探るために何十ものチャートを手作業で精査したり、自分の好みを常に疑ったりする必要がなくなります。このシステムは、8つの時間間隔(5ヶ月から月単位まで)をミリ秒単位で処理します。あらゆる瞬間に市場を支配している主体を正確に明らかにし、常に成功確率が最も高い方向で取引できるようにします。 市場分析の3つの側面 このアルゴリズムは市場を3つの
Meridian Pro
Ottaviano De Cicco
5 (2)
Meridian Pro 2.00:MT5向けプロ仕様マルチタイムフレーム・トレンドマトリクス Meridian Pro 2.00 は、MetaTrader 5 向けのプロ仕様の適応型トレンドマトリクスです。オリジナルの Meridian トレンドエンジン、クリーンなチャート ribbon、確定足ベースのシグナル矢印、8時間足 dashboard、Fuel momentum、weighted consensus、synthetic HTF processing、そしてチャート上に直接表示される上位足コンテキストラインを統合します。 目的はシンプルです。現在のトレンド、マルチタイムフレーム構造、強度、momentum、EA-ready 状態を、複数チャートに無関係なインジケータを重ねるのではなく、1つの整理された workflow で読むことです。 Meridian Pro の違い 1つの適応型エンジン - 同じ volatility-aware Meridian ロジックを M1 から W1 まで適用します。 Synthetic HTF architecture - 上位足行は下位足デ
この製品は 2026 年の市場向けに更新され、最新の MT5 ビルドに最適化されています。 価格更新のお知らせ: MENA Trend Scanner Pro は現在 $99 で提供されています。 次の 30 件の購入 後、価格は $199 に上がります。 特別オファー: MENA Trend Scanner Pro を購入後、私にプライベートメッセージを送ることで、 Smart Universal EA を無料 で受け取り、MENA Trend のシグナルを自動売買に変えることができます。 まず、このトレーディングシステムはリペイントなし、再描画なし、遅延なしのインジケーターであり、手動取引とロボット取引の両方に理想的であることを強調しておきます。 Online course, user manual, and downloadable presets included. MENA Trend Scanner Pro は、複数のシンボルと複数の時間足を同時に分析する完全な multi-pair scanner dashboard として機能します。手動で何度もチャートを切り替える代
作者のその他のプロダクト
SmartFlow Kalman Consensus SmartFlow Kalman Consensus is an advanced market structure and trend analysis tool designed to deliver a clean, noise-free view of price behavior. Built for traders who focus on structure, flow, and precision, it simplifies complex market movement into clear, actionable insight. What It Does Filters out market noise to reveal true directional bias Identifies key reaction zones where price is likely to respond Tracks real-time trend shifts with high clarity Aligns stru
VWAP Anchor Tool
Jackson Mukurani Wanguthi
Anchored VWAP is a lightweight, interactive volume-weighted average price indicator designed for traders who need precision without clutter. Unlike standard VWAP that resets every session, this tool lets you drop up to five custom anchors directly on any candle. Each anchor calculates VWAP from that exact point forward, complete with standard deviation bands to highlight where price may find support or resistance relative to volume. Key Features: • Up to 5 simultaneous anchors — compare multi
FREE
UniversalLevelAlert is a free, lightweight MT5 chart indicator that combines price-level alerts with multi-timeframe candle-close alerts — all in one tool. What it does: Price Alerts: Set up to 5 horizontal alert lines directly on the chart. Drag them visually to adjust levels. Get notified when price comes within a trigger distance. Candle-Close Alerts: Monitor up to 5 timeframes simultaneously. Get alerted the moment a candle closes on any chosen timeframe, with bullish/bearish classification
FREE
A clean, information-dense dashboard that sits on your chart and answers the five questions every trader should ask before pulling the trigger: 1) What am I looking at? — Symbol, timeframe, live spread in points and pips. 2) When am I trading? — Active forex session with overlap detection, candle countdown timer, broker server time (auto-detected UTC offset, DST-proof), and your local time. 3) How much should this move? — 5 configurable ATR multiplier rows for quick SL/TP sizing, plus Daily,
FREE
TimePeriodLabels – See where new periods start on any chart A clean indicator that draws vertical lines and labels when a new year, month, week or day begins. No more squinting at dates or placing manual lines every time you open a chart. Each period type has its own colour and style so you instantly know what changed. What it does Detects when the day, week, month or year flips on the current timeframe. Draws a vertical line at the first bar of the new period. Adds a text label (for day, month
FREE
SmartFlow Consensus is a chart overlay indicator designed for traders who need a clean, structural view of price action without clutter. It filters market noise through an internal consensus engine and renders the result directly onto the chart as intuitive color-coded candles, price zones, and trend structure lines. Built for traders who make decisions from structure rather than guesswork, it combines fractal-based zone detection, multi-layer consensus filtering, and market structure tracking
ACE Signals
Jackson Mukurani Wanguthi
ACE Signals Adaptive Confluence Engine — Precision Entry Signals Through Multi-Layer Validation Tired of repainting arrow indicators that fire late, whipsaw in chop, and leave you holding the bag? Most signal indicators rely on a single condition — a moving average cross, an RSI spike, or a price pattern. In volatile markets, that is not enough. ACE Signals was engineered from the ground up to eliminate false entries by requiring three independent layers of market intelligence to align before a
Manually drawing support and resistance levels takes time, and no two traders mark the same spots. Institutional Zones Pro solves this by automatically calculating and displaying key levels as zones on your chart. Instead of thin lines, it draws areas where price has historically reacted. Active zones remain visible and extend forward. When price moves through a zone, it updates to show the level is no longer active. This keeps your chart clean and tells you at a glance which areas still matter
フィルタ:
レビューなし
レビューに返信