SquatBarMarker

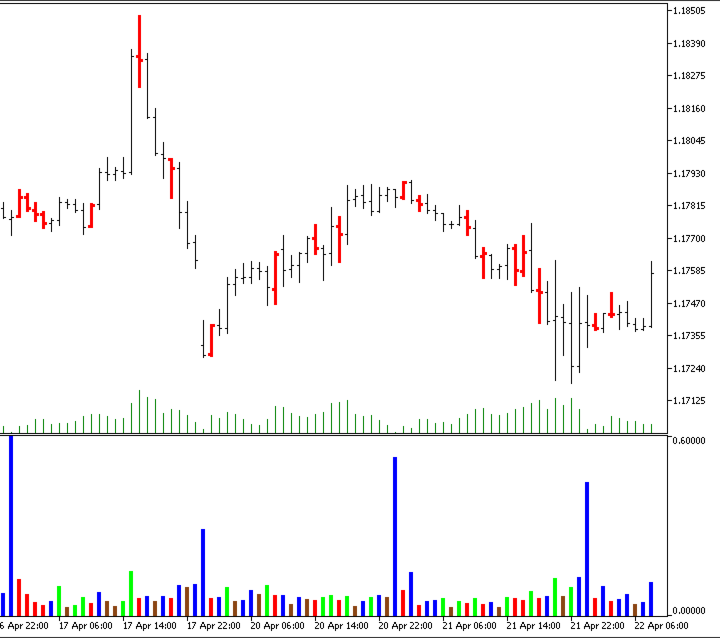
Squat Bar Marker is an indicator for MetaTrader 5 that detects Bill Williams MFI bar types and displays them directly on the price chart.

Supported bar types:

  • Green Bar — MFI and volume are rising;
  • Fade Bar — MFI and volume are falling;
  • Fake Bar — MFI rises while volume falls;
  • Squat Bar — MFI falls while volume rises.

Chart display:

  • green bars — Green Bar;
  • brown bars — Fade Bar;
  • blue bars — Fake Bar;
  • pink bars — Squat Bar.

Display modes:

  • no coloring;
  • only Squat bars;
  • all bar types.

The indicator can display signal arrows on Squat bars:

  • up arrow — below bullish candles;
  • down arrow — above bearish candles.

Indicator features:

  • automatic MFI bar detection;
  • Squat bar highlighting;
  • tick volume and real volume support;
  • built-in time filter for H1 and lower timeframes;
  • server time and local time support;
  • sound alerts for new Squat bars;
  • calculation limit by number of bars;
  • configurable display and signal settings.

Main inputs:

  • Color Mode;
  • Show Arrows;
  • Max Bars;
  • Use Real Volume;
  • Time Filter Settings;
  • Alert Settings.

The indicator works directly on the price chart and supports multiple trading instruments and timeframes.


Разворотный бар фрактал Вильямса фрактал БВ фракталы Вильямса пробой фрактала пробитый фрактал Торговый хаос broken fractal unbroken fractal Williams fractal Trading Haos Bill Williams Bullish/bearish divergent bar Squat bar Приседающий бар Money Flow Index

おすすめのプロダクト
Waves Sizer
Flavio Javier Jarabeck
3.86 (7)
Wyckoff fans, enjoy! Ideally to be used with the Weis Waves indicator, but it can be easily used alone, the Waves Sizer puts the range (in resulting Price movement) done by the Price on its market swings. You can control how accurate or loose will be the swings. This tool is very helpful for visually know how much the Price has traveled in your Timeframe. This way you can confront this level of effort with the resulting Volume, etc... Weis Waves indicator: https://www.mql5.com/en/market/produc
FREE
Main purpose:   "Pin Bars"   is designed to automatically detect pin bars on financial market charts. A pin bar is a candle with a characteristic body and a long tail, which can signal a trend reversal or correction. How it works:   The indicator analyzes each candle on the chart, determining the size of the body, tail and nose of the candle. When a pin bar corresponding to predefined parameters is detected, the indicator marks it on the chart with an up or down arrow, depending on the directi
FREE
Here   our more valuable tools SMC Trend Trading   ,  Easy SMC Trading  ,  Institutional SMC Architect Volume Analysis Tools  ,  Volume flow Profile  ,  Market volume profile  , FVG with Volume  , Liquidity Heatmap Profile  ,  Volume Spread Analysis A professional spike pattern indicator built for synthetic traders who scalp and swing Crash 500/300/1000 with precision.  This indicator: Detects powerful 3-candle spike formations (Spike → Pullback → Spike) Automatically draws a clean box a
FREE
HTF Candles Nikaは、MetaTrader 5の現在のチャートに、任意の上位時間足のローソク足をフルサイズで直接オーバーレイ表示します。チャートを切り替えることなく、マルチタイムフレームの視点を提供します。 主な機能 - 上位時間足のローソク足を、ヒゲ付きの塗りつぶし矩形として現在のチャートに描画 - 標準ローソク足とHeiken Ashiの両表示モードに対応 - 現在のHTFローソク足が閉じるまでの残り時間をリアルタイムでカウントダウン表示 - 陽線・陰線のカラーをカスタマイズ可能 - ローソク幅の自動または手動制御 - ヒゲの幅、フォント、フォントサイズ、テキスト位置オフセットを設定可能 - あらゆるシンボルと時間足の組み合わせに対応 - セッションのギャップを自動検出してレンダリングを調整 - 軽量設計 — チャートオブジェクトのみ使用、インジケーターバッファなし 入力パラメーター 表示設定 - Max Lookback — 描画するHTFバー数(デフォルト:500) - Timeframe — 表示する上位時間足(デフォルト:H1) - Bars Mode
FREE
This indicator marks the 50% mark of each candle. It will help you make profitable scalping trades. If the next candle opens above the 50% mark of the previous candle, you should open a BUY position, and if the next candle opens below the 50% mark of the previous candle, you should open a SELL position. This strategy is very profitable. To make the most of it, keep an eye on the candle contexts on the left. Good luck!
FREE
Simple Vwap with the daily, weekly and monthly VWAP is the abbreviation for   volume-weighted average price , which is a technical analysis tool that shows the ratio of an asset's price to its total trade volume. It provides traders and investors with a measure of the average price at which a stock is traded over a given period of time. How it's used Identify entry and exit points:   Traders can use VWAP to determine when to buy or sell an asset.   Understand price trends :  Traders can use V
FREE
Thread indicator is calculating possible values for the upcoming periods. It is built by author’s system, with ability to learn. Input data   ( recommended interval ): Sensitivity to oscillatory motion (integer value, 0 - 8) increase of value shifts priority of calculation towards high-frequency vibrations (increase loads the system) Shift of diagram (integer value, 0 - 8) shifts output of indicator to the right Diagram forecast (integer value, maximum 10) defies the number of periods calculated
FREE
Here   our more valuable tools SMC Trend Trading   ,  Easy SMC Trading  ,  Institutional SMC Architect Volume Analysis Tools  ,  Volume flow Profile  ,  Market volume profile  , FVG with Volume  , Liquidity Heatmap Profile  ,  Volume Spread Analysis Automatic Professional Theme:   Instantly applies a high-contrast "Color on White" theme with DeepSkyBlue bull candles and Black bear candles for maximum clarity. Interactive Timeframe Panel:   21 vertical buttons on the left side allow for one-clic
FREE
AvgVolumes
Marco Montemari
5 (1)
This indicator is based on Volumes standard indicator, calculates the average of Volumes based on the last N bars set by users, and if the value of the volume is bigger then a set % respect the average a different color will be used. The indicator is shown in a separate indicator window. This version has now a limitation in setting the % about the threshold. If you are interested to set threshold consider to buy the PRO version ( https://www.mql5.com/en/market/product/35925 ) If you want to use
FREE
Here   our more valuable tools SMC Trend Trading   ,  Easy SMC Trading  ,  Institutional SMC Architect Volume Analysis Tools  ,  Volume flow Profile  ,  Market volume profile  , FVG with Volume  , Liquidity Heatmap Profile  ,  Volume Spread Analysis Professional trend-following indicator with comprehensive visualization and control panel Key Features: Advanced Trend Detection Reliable Half Trend algorithm for precise trend identification Color-coded trend lines (Blue for bullish, Orange for
FREE
Here   our more valuable tools SMC Trend Trading   ,  Easy SMC Trading  ,  Institutional SMC Architect Volume Analysis Tools  ,  Volume flow Profile  ,  Market volume profile  , FVG with Volume  , Liquidity Heatmap Profile  ,  Volume Spread Analysis Automatically detects major swing points not internal noise Generates buy/sell signals at key Fibonacci levels Displays professional GUI panel with real-time analysis Marks major swings with visual indicators Trading Strategy BUY at 38.2%-61.8% Fib
FREE
Mouse Calculation は、マウスで指した価格で決済した場合の各注文の損益を素早く計算します。 グリッド、マーチン、分割エントリーなど、複数注文の運用で素早い判断に最適です。回本価格(損益分岐)や目標価格がひと目で分かります。 主な機能 Mouse PnL (M) :注文ごとの損益と合計損益を表示(swap を含む)。 Break even Price (B) :全体の回本価格/損益分岐ラインを表示。 Time_Sync_Lines (T) :直近 N 日の同時刻を揃えて比較;ドラッグで重要局面を振り返り。 Panel (P) :操作パネルの表示/非表示。 About (A) :使い方と情報。 チャート上の表示 B / S :注文の現在損益 M :マウス価格で決済した場合の「決済損益」推定 T :合計損益 おすすめの場面 グリッド :全体の利確水準を素早く決定。 マーチン :どこまで戻れば回本/プラスになるかを素早く確認。 複数注文 :部分決済や調整が直感的に。 パラメータ sync_lines :Time_Sync_Lines の縦線本数(初期値 8) (その他は色/表
FREE
Market Profile 3 ForexArby com
Hussien Abdeltwab Hussien Ryad
4 (15)
Market Profile 3 MetaTrader 5 indicator  version 4.70— is a classic Market Profile implementation that can show the price density over time, outlining the most important price levels, value area, and control value of a given trading session. This indicator can be attached to timeframes between M1 and D1 and will show the Market Profile for daily, weekly, monthly, or even intraday sessions. Lower timeframes offer higher precision. Higher timeframes are recommended for better visibility. It is als
FREE
This indicator looks for 3 rather strong patterns: Spinning Top pattern Hammer or Hanging Man Inverted Hammer or Shooting Star These patterns may indicate a trend continuation or its reversal, depending on the location of the patterns. Input parameters Distance - distance between the signal and the formed signal Note: the higher the timeframe, the greater the value should be used in Distance to display the signal correctly Indicator Features Suitable for any currency pair Operating timeframe:
FREE
The indicator draws a normal chart by coloring it in colors based on prices calculated by the Heiken Ashi indicator algorithm. That is, the shape of the candles does not change. In fact, this is the same Heiken Ashi that does not distort the price chart. Then there will be a drawing of a cat, because there is nothing more to write about the indicator. .                                                       
FREE
Weis Waves(ワイス・ウェーブ) は、デビッド・ワイスが開発し、リチャード・ワイコフの理論に基づいたテクニカル指標です。 従来の出来高がバーごとに表示されるのとは異なり、Weis Waves は出来高を上昇または下降の「波」として蓄積し、価格の方向が変わると新しいカウントを開始します。 この方法により、トレーダーは市場の動きの 本当の強さ を明確に把握することができます。 主な特徴: 出来高を買いと売りの波にまとめる。 支配的な圧力(買い手または売り手)を強調。 トレンドの継続 または 反転の可能性 を識別。 ワイコフ理論に基づき、出来高・フロー分析で広く使用される。 Weis Waves は、価格と出来高のバランスを評価するために、多くのプロトレーダーによって利用され、市場ダイナミクスの詳細な視点を提供します。
FREE
マルチタイムフレーム対応、カスタマイズ可能なビジュアル信号、設定可能なアラートシステムを備えた相対力指数(RSI)インジケーター。 フリーランスプログラミングサービス、アップデート、その他のTrueTL製品は私の MQL5プロフィール からご利用いただけます。 フィードバックとレビューを心よりお待ちしております! RSIとは? 相対力指数(RSI)は、価格変化の速度と大きさを測定するモメンタムオシレーターです。このインジケーターは0から100の間で振動し、指定された期間にわたって最近の上昇幅と最近の下落幅の大きさを比較します。 RSIは主に買われすぎと売られすぎの状態を識別するために使用されます。高い値は買われすぎ状態を示し、低い値は売られすぎ状態を示します。トレーダーはまた、RSIと価格動作の間のダイバージェンスにも注目しており、これは潜在的なトレンド転換を示す可能性があります。 機能: 矢印と垂直線を使用したビジュアルシグナルマーカー 設定可能なトリガー付きの3つの独立したシグナルバッファ(方向変化、レベル交差、ピーク/谷、極端ゾーン) 時間帯フィルタリング付きの設定可能なア
FREE
Candle Direction Edge — Similarity & Streak Edge Indicator Candle Direction Edge is a statistical analysis indicator that breaks down every candle into a measurable fingerprint and searches history to find the closest matches — giving you data-driven insight into what has tended to happen next. How it works Every candle is reduced to five measurable characteristics: body ratio, upper and lower wick size, close position within the range, and volatility relative to ATR. This creates a unique finge
FREE
Volume Candlestick Bars
Henrique Helmuth Kreutz Pfeifer
Indicator that show candlestick bars with an different sampling method than time fixed. Real time data is sourced to the indicator and it may be used as substitute of the default graph. Each bar is formed when a predefined volume of assets was dealt, showing in the graph the OHLC of this clustering. The amount of bars is proportional to the amount of negotiations instead of a sample in a fixed amount of time. If the broker doesn't show the real volume of the trades, this indicator won't work. Th
FREE
The indicator plots a curve of the difference between the values ​​of two trading instruments (currency pairs). The purpose of the indicator is to observe the processes of divergence and convergence of the values ​​of two trading instruments. The results obtained can be used for trading strategies of statistical arbitrage, pair trading, correlation, and others. Trading strategy The indicator is attached to the chart of any trading instrument. In the input parameters, the names of trading instr
FREE
The Penta-O is a 6-point retracement harmonacci pattern which usually precedes big market movements. Penta-O patterns can expand and repaint quite a bit. To make things easier this indicator implements a twist: it waits for a donchian breakout in the right direction before signaling the trade. The end result is an otherwise repainting indicator with a very reliable trading signal. The donchian breakout period is entered as an input. [ Installation Guide | Update Guide | Troubleshooting | FAQ | A
FREE
インディケータはチャート上にトレンドラインを描画します。このインジケーターには6つの入力があります。ユーザーは両方の行に代替ラベルを指定できます。インジケーターの複数のインスタンスが使用される場合、ラベルは異なっている必要があります。ユーザーは、線の幅と色、および使用する重要なピークを指定する深さを設定できます。たとえば、Depth = 10は、現在の山と谷を使用してトレンドラインを設定します。この山と谷は、左右に少なくとも10本のバーがあり、高/低がピークの高/低よりも小さい/大きいです。インジケーターは、以前の山と谷もペイントします。インジケーターには、価格がサポート/レジスタンスラインから事前に設定された距離にあるときにユーザーに通知するために使用できるアラート機能が追加されています。アラート距離はピップで設定されます。
FREE
QQE Mod Professional
Daniel Ortega Clemente
5 (1)
This indicator implements the QQE (Qualitative Quantitative Estimation) algorithm for MetaTrader 5, incorporating volatility bands logic. The indicator combines the Relative Strength Index (RSI) with Average True Range (ATR) to determine market direction. The histogram changes color based on the interaction between the RSI momentum and the calculated volatility channel. Technical Logic: The algorithm smoothes the RSI values and constructs upper and lower bands. When the smoothed RSI breaks these
FREE
Aggression Volume Profile
Edson Cavalca Junior
4.55 (11)
This indicator plots the volume profile by Price on the chart There are 5 ways to view it: By Total Volume Traded (Premium Version); Volume Ticks(Forex) Separated by Buyers and Sellers (Premium Version); Buyers Only (Premium Version); Sellers Only (Premium Version); Business balance (Buyers - Sellers) (Premium Version); . It is possible to select how many days the profiles will be calculated.( Premium Version) On the current day it recalculates the histogram data for each new candlestick.
FREE
This indicator calculates the volume profile and places labels that correspond to the VAH, VAL and POC levels, for each candle individually. Indicator operation features The indicator works on the timeframes from M3 to MN, but it uses the history data of smaller periods: M1 - for periods from M3 to H1, M5 - for periods from H2 to H12, M30 - for the D1 period, H4 - for the W1 period, D1 - for the MN period. The color and location of the VAL, VAH and POC labels on the current candle are considere
FREE
This indicator emulates volume delta (buy trades vs sell trades) based on per candle volume and candle shape (direction, size of body and wicks). Artificially separated buy and sell volumes then accumulated for specified number of bars. The indicator shows a histogram of volume delta per bar, as well as a sum of the delta for the given period. What is more important, the indicator allows you to combine current symbol quotes/volumes with quotes/volumes of other related symbols (futures, indices,
FREE
Phoenix Delta Volume
Nigel Nii Darku Narnor Darko
This is the Phoenix Institutional SMC Dashboard (Emerald-Teal Edition). It is engineered to provide retail traders with the same "Volume-at-Price" clarity used by institutional desks. Below is a full breakdown of the benefits, the high-confluence logic for entries, and how to manage your trades using the current visual engine. Strategic Benefits to the User Sentiment over Price: Most indicators only look at where the price is. This dashboard tells you how much effort (Volume Delta) was required
FREE
Jumping & Dumping Candles Detector Multi-timeframe MT5 indicator that scans historical candles across H1, H4, D1 for strong price movements using body size, wick, and volume filters. Features Analyzes multiple timeframes: H1, H4, D1. Marks candles on charts. Supports sound and push alerts. Usage Attach to charts for research and strategy development. Configure filters for body percentage, wick ratio, volume threshold. Test signals for breakouts or reversals. Related Products Gold Skeith Era EA (
FREE
English VWAP Daily (Clean) is a simple and lightweight indicator that plots the classic Daily VWAP (Volume Weighted Average Price) directly on your MT5 chart. Features: Classic Daily VWAP calculation Supports real volume (if available) or tick volume Timezone offset option to match your broker’s server time Weekend merge option (merge Saturday/Sunday data into Friday) Clean version → no arrows, no alerts, only VWAP line VWAP is widely used by institutional traders to identify fair value, su
FREE
Value Chart Candlesticks
Flavio Javier Jarabeck
4.57 (14)
The idea of a Value Chart indicator was presented in the very good book I read back in 2020 , " Dynamic Trading Indicators: Winning with Value Charts and Price Action Profile ", from the authors Mark Helweg and David Stendahl. The idea is simple and the result is pure genius: Present candlestick Price analysis in a detrended way! HOW TO READ THIS INDICATOR Look for Overbought and Oversold levels. Of course, you will need to test the settings a lot to find the "correct" one for your approach. It
FREE
このプロダクトを購入した人は以下も購入しています
Neuro Poseidon is a new indicator by Daria Rezueva. It combines precise trading signals with adaptive TP/SL levels - creating best possible trades as a result! Message me and get  Neuro Poseidon Assistant  as a gift to automize your trading process! What makes it stand out? 1. Proven profitability on all assets and timeframes 2. Only confirmed BUY and SELL signals present on the chart 3. Adaptive TP & SL levels generated by the software for each trade 4. Easy to understand - suitable for al
PrimeScalping is a powerful trading companion designed to generate high-probability entry signals with dynamic TP/SL/DP levels based on volatility. Built-in performance tracking shows win/loss stats, PP1/PP2 hits, and success rates — all updated live. Key Features: Buy/Sell signals with adaptive volatility bands Real-time TP/SL/DP levels based on ATR Built-in MA Filter with optional ATR/StdDev volatility Performance stats panel (Success, Profit/Loss, PP1/PP2) Alerts via popup, sound, push, or e
SuperScalp Pro
Van Minh Nguyen
4.65 (26)
SuperScalp Pro – 高度なマルチフィルタースキャルピングインジケーターシステム SuperScalp Pro は、クラシックな Supertrend と複数のインテリジェント確認フィルターを組み合わせた高度なスキャルピングインジケーターです。M1 から H4 まで複数の時間足で効率的に動作し、XAUUSD、BTCUSD、主要 Forex 通貨ペア向けに最適化されています。 このインジケーターは明確な Buy / Sell シグナルを提供し、ATR に基づいてエントリー価格、Stop Loss、Take Profit を自動計算します。Fibonacci Take Profit 機能により、重要な価格帯で早期決済し、到達時に通知を送信します。 初期設定では Fibonacci Take Profit が有効化されており、より安定した取引体験を重視しています。チャートに適用するだけですぐ利用可能です。上級者向けに、すべてのパラメータは自由にカスタマイズできます。 完全なドキュメントは製品ブログにあります: [User Guide] SuperScalp Pro Auto T
Gold Entry Sniper – ゴールドスキャルピング&スイングトレード用プロフェッショナル多時間足ATRダッシュボード Gold Entry Sniper は、XAUUSDや他の銘柄向けに正確な 売買シグナル を提供する、MetaTrader 5用の高度なインジケーターです。 ATRトレーリングストップロジック と 多時間足分析ダッシュボード を搭載し、スキャルピングからスイングトレードまで対応します。 主な特徴と利点 多時間足シグナル分析 – M1、M5、M15 のトレンドを同時表示。 ATRベースのトレーリングストップ – ボラティリティに応じて動的に調整。 プロ仕様のチャートダッシュボード – シグナル状況、ATRレベル、回帰線、売買方向を表示。 明確な売買マーカー – 自動矢印とテキストラベル。 エグジットアラートとトレード管理 – 利益確定のための自動検出。 完全カスタマイズ可能 – パネル位置、色、フォント、ATR/回帰設定を調整可能。 ゴールド(XAUUSD)に最適化 – M1〜M15のスキャルピングに最適、FXや指数、暗号資産にも対応。 Gold Entry
このインジケーターを購入された方には、以下の特典を 無料 で提供しています: 各トレードを自動で管理し、ストップロスとテイクプロフィットを設定し、戦略ルールに基づいてポジションを決済する補助ツール 「Bomber Utility」 様々な銘柄に合わせたインジケーターの設定ファイル(セットファイル) 「最小リスク」、「バランスリスク」、「待機戦略」 の3つのモードで使用できる Bomber Utility 用の設定ファイル このトレーディング戦略をすぐに導入・設定・開始できる ステップバイステップのビデオマニュアル ご注意: 上記の特典を受け取るには、MQL5のプライベートメッセージシステムを通じて販売者にご連絡ください。 オリジナルのカスタムインジケーター 「Divergence Bomber(ダイバージェンス・ボンバー)」 をご紹介します。これは、MACDのダイバージェンス(乖離)戦略に基づいた 「オールインワン」型のトレーディングシステム です。 このテクニカルインジケーターの主な目的は、価格とMACDインジケーターの間に発生するダイバージェンスを検出 し、将来の価格の動きを示す
Entry In The Zone and SMC Multi Timeframe is a real-time 2-in-1 market analysis tool that combines market structure analysis and a No Repaint BUY / SELL signal system into a single indicator, built on Smart Money Concepts (SMC) — a widely adopted framework used by professional traders to understand market structure. This indicator helps you see the market more clearly, make decisions based on structure rather than guesswork, and focus on high-probability zones where price is more likely to react
まず正直に言いましょう。 どんなインジケーターも、それ単体であなたを利益化させることはできません。もしそう言う人がいるなら、それは夢を売っているだけです。完璧な売買シグナル(矢印)を表示するインジケーターは、いくらでも“完璧に見せる”ことができます。正しい過去の区間を拡大して、勝ちトレードだけを切り取ればいいだけです。私たちはそれをしません。 SMC Intraday Formula はツールです。 市場構造を読み取り、最も高い確率の価格ゾーンを特定し、今この瞬間のスマートマネーの痕跡をシンプルな言葉で正確に示します。最終判断はあなたが行います。トレードを実行するのもあなたです。しかし今は「希望」ではなく「精度」でエントリーできます。 私たちはこのインジケーターを、ゴールド(XAUUSD)および主要FX通貨ペアで約3年間、日々のスキャルピングに使用してきました。M1、M5、M15、M30の主要ツールです。これは未来を予測しようとするのではなく、今まさに形成されている高確率セットアップを示し、その理由を説明します。 他のすべてのインジケーターと何が違うのか? ほとんどのトレーディングイ
ScalpPoint is a powerful trading companion designed to generate high-probability entry signals with dynamic TP/SL/DP levels based on volatility. Built-in performance tracking shows win/loss stats, PP1/PP2 hits, and success rates — all updated live. Key Features: Buy/Sell signals with adaptive volatility bands Real-time TP/SL/DP levels based on ATR Built-in MA Filter with optional ATR/StdDev volatility Performance stats panel (Success, Profit/Loss, PP1/PP2) Alerts via popup, sound, push, or emai
この製品は 2026 年の市場向けに更新され、最新の MT5 ビルドに最適化されています。 価格更新のお知らせ: Smart Trend Trading System は現在 $99 で提供されています。 次の 30 件の購入 後、価格は $199 に上がります。 特別オファー: Smart Trend Trading System を購入後、私にプライベートメッセージを送ることで、 Smart Universal EA を無料 で受け取り、Smart Trend のシグナルを自動売買に変えることができます。 Smart Trend Trading System は、リペイントなし、再描画なし、遅延なしの完全なトレーディングシステムです。よりクリーンなシグナル、より明確なトレンド方向、そしてより整理された取引方法を求めるトレーダー向けに作られています。 Online course , manual and download presets . このシステムは、トレンド検出、反転ゾーン、Smart Cloud、トレーリングストップロジック、サポートとレジスタンス、ローソク足の色分け、ア
SignalTech MT5 is an unique fully rule based trading system for EURUSD, USDCHF, USDJPY, AUDUSD, NZDUSD, EURJPY, AUDJPY, NZDJPY, CADJPY.  All the winning trades with chart setups are published on the comments page. 2026-05 4107 Pips (Until 05-29 NY Closed) 2026-04 2243 Pips 2026-03 2165 Pips 2026-02 2937 Pips 2026-01 2624 Pips 2025-12 1174 Pips It can generate signals with Buy/Sell Arrows and Pop-Up/Sound Alerts. Each signal has clear Entry and Stop Loss levels, which should be automatically flag
MasterTrend Indicator for MT5 A powerful trend-following and signal-evaluation tool MasterTrend   is a custom MT5 indicator that combines Moving Averages and ATR-based risk/reward logic to generate clear buy/sell signals. It visualizes dynamic SL/TP levels, evaluates past trade outcomes, and displays win/loss statistics in a clean on-chart panel. Key features include: Buy/Sell signals based on MA crossovers ATR-based SL/TP1/TP2/TP3 levels with visual lines and labels Signal outcome tracking wit
Quantum TrendPulse を ご紹介します。これは、   SuperTrend   、   RSI   、および Stochastic のパワーを 1 つの包括的なインジケーターに組み合わせて、取引の可能性を最大限に引き出す究極の取引ツールです。精度と効率を求めるトレーダー向けに設計されたこのインジケーターは、市場のトレンド、勢いの変化、最適なエントリー ポイントとエグジット ポイントを自信を持って特定するのに役立ちます。 主な特徴: SuperTrend 統合: 現在の市場動向に簡単に追従し、収益性の波に乗ることができます。 RSI精度: 買われすぎと売られすぎのレベルを検出し、市場の反転のタイミングに最適で、SuperTrendのフィルターとして使用されます。 確率的精度: 確率的振動を活用して、変動の激しい市場で隠れたチャンスを見つけます。SuperTrend のフィルターとして使用されます。 マルチタイムフレーム分析:   M5 から H1 または H4 まで、さまざまなタイムフレームで市場を常に把握します。 カスタマイズ可能なアラート: カスタム取引条件が満たされ
Power Candles V3 - 自己最適化型強弱インジケーター Power Candles V3は 、通貨や銘柄の強さを、適用されたすべてのチャート上で実行可能なトレードプランに変換します。単にローソク足を色分けするだけでなく、バックグラウンドでリアルタイムの自動最適化を実行し、目の前の銘柄に対して最適なストップロス、テイクプロフィット、およびシグナルの閾値を提示します。ワンクリックで実取引に適用でき、エントリーポイント、ストップロス、テイクプロフィットのラインが正確な価格位置にチャート上に表示され、方向性を示すアラートがリアルタイムで発動します。 このツールは、Stein Investmentsのエコシステムの一部です。  18種類以上のツールをすべて閲覧し、AIを活用したセットアップの推奨事項を入手し、  https://stein.investments でコミュニティに参加しましょう クローズしたバーごとに3,000回以上のトレードシミュレーション。9つの強さの状態。2つの戦略を並行してテスト。勝率の高い設定をワンクリックで適用。 なぜこれが必要なのか ほとんどの強
トレンドキャッチャーインジケーター トレンドキャッチャーインジケーターは、開発者独自の適応型トレンド分析指標を組み合わせることで、市場価格の動きを分析します。短期的なノイズを除去し、根底にあるモメンタムの強さ、ボラティリティの拡大、価格構造の挙動に焦点を当てることで、真の市場方向性を特定します。また、移動平均線、RSI、ボラティリティフィルターなどの平滑化およびトレンドフィルタリング機能を備えたカスタマイズ指標も使用します。 実際の運用状況のモニタリングやその他の製品については、こちらをご覧ください: https://www.mql5.com/en/users/mechanic/seller ご注意ください。私はTelegramでEAや設定を販売していません。詐欺です。すべての設定はブログで無料で公開しています。 重要!ご購入後すぐにご連絡ください。手順とボーナスをお送りします!
ご紹介     Quantum Breakout PRO は 、ブレイクアウト ゾーンの取引方法を変革する画期的な MQL5 インジケーターです。 13年以上の取引経験を持つ経験豊富なトレーダーのチームによって開発されました。     クォンタム ブレイクアウト プロ   は、革新的でダイナミックなブレイクアウト ゾーン戦略により、あなたのトレーディングの旅を新たな高みに押し上げるように設計されています。 クォンタム ブレイクアウト インジケーターは、5 つの利益ターゲット ゾーンを備えたブレイクアウト ゾーン上のシグナル矢印と、ブレイクアウト ボックスに基づいたストップロスの提案を提供します。 初心者トレーダーにもプロのトレーダーにも適しています。 量子EAチャネル:       ここをクリック 重要!購入後、インストールマニュアルを受け取るためにプライベートメッセージを送ってください。 推奨事項: 時間枠: M15 通貨ペア: GBPJPY、EURJPY、USDJPY、NZDUSD、XAUUSD アカウントの種類: ECN、Raw、またはスプレッドが非常に低い R
Gann Made Easy   は、ミスター・ギャンの理論を使用した取引の最良の原則に基づいた、プロフェッショナルで使いやすい外国為替取引システムです。 W・D・ガン。このインジケーターは、ストップロスとテイクプロフィットレベルを含む正確な買いと売りのシグナルを提供します。 PUSH通知を利用して外出先でも取引可能です。 ご購入後、取引方法の説明と優れた追加インジケーターを無料で入手するには、私にご連絡ください! おそらく、ギャンの取引手法についてはすでに何度も聞いたことがあるでしょう。通常、ギャンの理論は初心者のトレーダーだけでなく、すでにある程度の取引経験がある人にとっても非常に複雑なものです。なぜなら、ギャンの取引手法は理論的にはそれほど簡単に適用できるものではないからです。私はその知識を磨き、最良の原則を私の外国為替インジケーターに組み込むために数年を費やしました。 このインジケーターは非常に簡単に適用できます。必要なのは、それをチャートに添付し、簡単な取引推奨事項に従うだけです。このインジケーターは常に市場分析の仕事を行い、取引の機会を探します。適切なエントリーポイントを検
Azimuth Pro
Ottaviano De Cicco
5 (7)
Azimuth Pro V2:MT5向けシンセティック・フラクタル構造分析と確認済みエントリー 概要 Azimuth Pro は Merkava Labs によるマルチレベルスイング構造インジケーターです。4つのネストされたスイングレイヤー、スイングアンカーVWAP、ABCパターン検出、3タイムフレーム構造フィルタリング、そして確定バーでの確認済みエントリー — 1つのチャートで、ミクロスイングからマクロサイクルまでを網羅するワークフロー。 これはブラインドシグナル製品ではありません。ロケーション、コンテキスト、タイミングを重視するトレーダーのための構造ファーストワークフローです。 V2発売記念オファー — Azimuth Pro V2をUSD 399で(次の100本)。最終価格:USD 499。 1. V2での変更点 シンセティック・マルチタイムフレームエンジン 上位タイムフレーム分析をMeridian Proと同じ独自のシンセティックアーキテクチャで一から再構築。よりクリーンなHTFコンテキスト、安定したライブ動作、従来のMTF同期問題なし。シンセティックエンジンは 固定比率タ
GoldenX Entryは、MT5向けのインジケーターであり、適応型Smart Entry Trendアルゴリズム、シグナルスコアリングシステム、マーケットレジーム検出機能、およびボラティリティフィルターを備えています。各シグナルには、計算されたエントリーレベル、3つのテイクプロフィット(TP1、TP2、TP3)、およびストップロスレベルが含まれます。本インジケーターは、異なる市場環境に適応するために設計された複数の分析レイヤー上に構築されており、マルチレイヤー分析システムと内蔵オプティマイザーおよび統計トラッキングシステムを組み合わせています。リスク・リワード(RR)指標および過去のトレード履歴に基づく定量分析を提供します。 使い始めは簡単です — 選択した時間足でオプティマイザーを実行し、そのままチャート上でインジケーターを使用します。 コア機能 GoldenX Entryは、シグナルエンジンとトレード管理機能、そして過去統計トラッキングを1つのチャートに統合しています: - 内蔵オプティマイザー: オプティマイザーはチャート上でワンクリックで実行できます。200通りのパラメー
FX Trend NG:次世代マルチマーケット・トレンドインテリジェンス 概要 FX Trend NG は、複数の時間足に対応したプロフェッショナル向けトレンド分析およびマーケット監視ツールです。 市場全体の構造を数秒で把握することができます。 複数のチャートを切り替える必要はありません。どの銘柄がトレンド中なのか、どこでモメンタムが弱まっているのか、そしてどの時間足で強い整合性があるのかを瞬時に確認できます。 ローンチ特別オファー – FX Trend NG を $30(6ヶ月) または $80 永久ライセンス でご利用いただけます。 すでに Stein Investments のユーザーですか? -> メッセージを送信 して、プライベートグループへアクセスしてください。 セットアップや詳細情報が必要ですか? -> Stein Investments 公式ページ をご覧ください。 1. FX Trend NG が他と異なる理由 3ステート・トレンドロジック ― Buy と Sell だけではない • 多くのインジケーターは Buy または Sell の2状態のみを表示します。
M1 Quantum は、M1専用のプロフェッショナルトレーディングシステムであり、ストップロス、テイクプロフィット、スマートな資金管理を内蔵した、迅速かつ正確な取引シグナルを提供します。 M1 Quantum は、 連続勝利 に重点を置いて口座を素早く成長させるために設計されたプロフェッショナルな資金管理を備えています。 M1 Quantum インジケーター の主な特徴 M1時間足 およびすべての 主要通貨ペア 向けに設計 すべての取引にストップロスとテイクプロフィットを設定 資金管理 を実装し、トレーダーが簡単に取引できるようサポート 高い勝率と高い 連続勝利 リペイントなし、遅延なし あらゆるトレーダーにとって理解しやすい M1 Quantum を使用するには、 M1 Quantum Assistant が必要です。この強力なツールは、M1 Quantum をご購入いただいたすべてのお客様に 無料 で提供されています。 M1 Quantum Assistant をダウンロード 私のMQL5 チャンネルに参加して、最新のアップデートや新製品のリリース情報を入手してください。 価格は
Reversion King Indicator
Eugen-alexandru Zibileanu
5 (4)
新たな王者が登場 - インジケーター + 注文管理表示(TP1 + TP2 + TP3)+ オプションのTelegramシグナル送信機能付き(無料) (完全なトレード&シグナルシステム) ゴールド向け最高のEA: Gold Slayer このインジケーターには、高度な戦略、カスタマイズ可能な注文管理システム、そしてエンベロープ拡張を組み合わせた平均回帰システムが搭載されています。さらに、RSIなど複数のインテリジェントな確認フィルターによって、高確率の反転エントリーをBUY・SELLシグナルとして検出します。 単にトレードを学ぶだけでなく、複数ポジションを効果的に管理し、過去に利益を出しているオープンポジションで損失トレードをカバーする方法も学べます。 M5向けに構築・最適化されており、流動性が高くシグナルの精度が安定しているBTCUSDとXAUUSDで優れたパフォーマンスを発揮します。 このインジケーターは、ATRを基に自動計算されたエントリー、ストップロス、テイクプロフィットレベルを備えた明確なLong・Shortシグナルを提供するため、リスク管理が最初から組み込まれています。 マ
この製品は 2026 年の市場向けに更新され、最新の MT5 ビルドに最適化されています。 価格更新のお知らせ: Atomic Analyst は現在 $99 で提供されています。 次の 30 件の購入 後、価格は $199 に上がります。 特別オファー: Atomic Analyst を購入後、私にプライベートメッセージを送ることで、 Smart Universal EA を無料 で受け取り、Atomic Analyst のシグナルを自動売買に変えることができます。 Atomic Analyst は、リペイントなし、再描画なし、遅延なしの Price Action トレーディングインジケーターで、手動取引、シグナルの明確化、EA 自動化のために設計されています。 User manual: settings, inputs and strategy. 価格行動、強さ、モメンタム、マルチタイムフレーム方向、高度なフィルターを分析し、トレーダーがノイズを減らし、弱いセットアップを避け、より構造化された取引判断を行えるようにします。 このインジケーターは、複雑な市場計算をシンプルな視覚シ
Meridian Pro
Ottaviano De Cicco
5 (2)
Meridian Pro 2.00:MT5向けプロ仕様マルチタイムフレーム・トレンドマトリクス Meridian Pro 2.00 は、MetaTrader 5 向けのプロ仕様の適応型トレンドマトリクスです。オリジナルの Meridian トレンドエンジン、クリーンなチャート ribbon、確定足ベースのシグナル矢印、8時間足 dashboard、Fuel momentum、weighted consensus、synthetic HTF processing、そしてチャート上に直接表示される上位足コンテキストラインを統合します。 目的はシンプルです。現在のトレンド、マルチタイムフレーム構造、強度、momentum、EA-ready 状態を、複数チャートに無関係なインジケータを重ねるのではなく、1つの整理された workflow で読むことです。 Meridian Pro の違い 1つの適応型エンジン - 同じ volatility-aware Meridian ロジックを M1 から W1 まで適用します。 Synthetic HTF architecture - 上位足行は下位足デ
SmartScalping is a powerful trading companion designed to generate high-probability entry signals with dynamic TP/SL/DP levels based on volatility. Built-in performance tracking shows win/loss stats, PP1/PP2 hits, and success rates — all updated live. Key Features: Buy/Sell signals with adaptive volatility bands Real-time TP/SL/DP levels based on ATR Built-in MA Filter with optional ATR/StdDev volatility Performance stats panel (Success, Profit/Loss, PP1/PP2) Alerts via popup, sound, push, or e
ARIPoint
Temirlan Kdyrkhan
1 (1)
ARIPoint is a powerful trading companion designed to generate high-probability entry signals with dynamic TP/SL/DP levels based on volatility. Built-in performance tracking shows win/loss stats, PP1/PP2 hits, and success rates all updated live. Key Features: Buy/Sell signals with adaptive volatility bands Real-time TP/SL/DP levels based on ATR Built-in MA Filter with optional ATR/StdDev volatility Performance stats panel (Success, Profit/Loss, PP1/PP2) Alerts via popup, sound, push, or email Cu
この製品は 2026 年の市場向けに更新され、最新の MT5 ビルドに最適化されています。 価格更新のお知らせ: Smart Price Action Concepts は現在 $200 で提供されています。 次の 30 件の購入 後、価格は $299 に上がります。 特別オファー: 購入後、私にプライベートメッセージを送ることで、 無料ボーナス + ギフト を受け取ることができます。 まず、このトレーディングツールはリペイントなし、再描画なし、遅延なしのインジケーターであり、プロフェッショナルな取引に最適であることを強調しておきます。 Online course , and manual Smart Price Action Concepts Indicator は、初心者から経験豊富なトレーダーまで使える非常に強力なツールです。20 種類以上の便利なインジケーターを 1 つにまとめ、Inner Circle Trader Analysis や Smart Money Concepts Trading Strategies などの高度な取引アイデアを組み合わせています。このインジケ
MasterTrend Indicator for MT5 A powerful trend-following and signal-evaluation tool MasterTrend   is a custom MT5 indicator that combines Moving Averages and ATR-based risk/reward logic to generate clear buy/sell signals. It visualizes dynamic SL/TP levels, evaluates past trade outcomes, and displays win/loss statistics in a clean on-chart panel. Key features include: Buy/Sell signals based on MA crossovers ATR-based SL/TP1/TP2/TP3 levels with visual lines and labels Signal outcome tracking wit
M30/H1/H4スイング版もあります M5/M15では取りきれない大きな波を狙いたい方へ。 Gold Signal Swing Pro(M30/H1/H4対応)を販売中。 1トレードで$20〜$80+の値幅を狙う。 https://www.mql5.com/en/market/product/177643 KURAMA GOLD SIGNAL PRO(MT5版)— 7層フィルター搭載 XAUUSD完全トレードシステム リペイントなし。リドローなし。ラグなし。すべてのサインは確定後に変わりません。 購入者限定特典:買い切りライセンスをご購入いただいた方に、AI Zone Radar($59相当)+PDFマニュアルを無料プレゼント。購入後にMQL5でメッセージをお送りください。 AI Zone Radar: https://www.mql5.com/en/market/product/175834 ゴールドトレーダーのコミュニティで実際に使用され、精度と使いやすさで高評価。 あなたの問題
FX Power: 通貨の強弱を分析して、より賢い取引を実現 概要 FX Power は主要通貨と金の実際の強弱をあらゆる市場状況で理解するための必須ツールです。強い通貨を買い、弱い通貨を売ることで、 FX Power は取引の意思決定を簡素化し、高い確率の取引機会を見出します。トレンドを追従する場合でも、極端なデルタ値を使用して反転を予測する場合でも、このツールはあなたの取引スタイルに完全に適応します。ただ取引するだけではなく、 FX Power で賢く取引をしましょう。 1. なぜ FX Power がトレーダーにとって非常に有益なのか 通貨と金のリアルタイム強弱分析 • FX Power は主要通貨と金の相対的な強弱を計算し、マーケットダイナミクスに関する明確な洞察を提供します。 • どの資産がリードしているか、または後れを取っているかを監視して、取引するペアを賢く選びましょう。 マルチタイムフレームの包括的なビュー • 短期、中期、長期のタイムフレームで通貨と金の強弱を追跡し、マーケットトレンドに基づいて取引戦略を調整できます。 • スキャルピングからスイングトレード
RelicusRoad Pro: 定量的市場オペレーティングシステム 【期間限定】無制限アクセス 70% OFF - 2,000人超のトレーダーと共に なぜ多くのトレーダーは「完璧な」インジケーターを使っても失敗するのでしょうか? それは、文脈を無視して 単一の概念 だけでトレードしているからです。文脈のないシグナルは単なるギャンブルです。勝ち続けるには、 根拠の重なり(コンフルエンス) が必要です。 RelicusRoad Proは単なる矢印インジケーターではありません。完全な 定量的市場エコシステム です。独自のボラティリティモデリングを用いて、価格が推移する「適正価値の道(Fair Value Road)」をマッピングし、ノイズと真の構造的ブレイクを判別します。 推測はやめましょう。機関投資家レベルの「ロード・ロジック」でトレードを。 コアエンジン:「Road」アルゴリズム システムの中心となる Road Algo は、市場環境にリアルタイムで適応するダイナミックなボラティリティチャネルです。 安全ライン(平衡点) と、価格が数学的に反転しやすい 拡張レベル を投影します。 Si
作者のその他のプロダクト
B Williams Divergent Bar The indicator searches for and marks Divergent Bars on the chart according to Bill Williams' methodology. What it shows: Green upward arrow   — potential bullish reversal (Bullish Divergent Bar). Red downward arrow   — potential bearish reversal (Bearish Divergent Bar). Signal logic:   The indicator looks for bars with a large shadow in the direction of the reversal that update the local extremum (new local low or high), while being on the opposite side of the Alligator
FREE
BW Zones Indicator is an indicator for MetaTrader 5 that detects market zones based on AO and AC direction and displays them directly on the price chart: green zone — AO and AC are rising; red zone — AO and AC are falling; neutral zone — AO and AC move in different directions. Chart display: colored bars for zone visualization; up arrow after two consecutive green zones; down arrow after two consecutive red zones. Arrow placement: up signal — below the candle low; down signal — above the candle
FREE
Fractals Alligator Filter is an indicator for MetaTrader 5 that detects fractals and filters them according to their position relative to the Alligator lines. There is also the HotkeyFractalsEA utility designed to simplify trading. The indicator automatically separates fractals   into valid and invalid fractals: valid fractals are displayed with colored arrows; invalid fractals can be displayed separately or hidden in the settings. Two filtering modes are available: filtering relative to the Tee
FREE
B Williams Divergent Bar The indicator searches for and marks Divergent Bars on the chart according to Bill Williams' methodology. What it shows: Green upward arrow — potential bullish reversal (Bullish Divergent Bar). Red downward arrow — potential bearish reversal (Bearish Divergent Bar). Arrows appear only on closed bars. Signal logic: The indicator looks for bars with a large shadow in the direction of the reversal that update the local extremum (new local low or high), while being on the op
FREE
MAs crossing
Roman Ogorodnikov
5 (1)
The indicator draws three Moving Averages. Two short ones cross a long one. At the same time, the long MA changes color: If both short MAs are above the long one - first color; If both short MAs are below the long one - second color; If the two short MAs are on opposite sides of the long one - third color. All three MAs are based on closing prices with a smoothing method of "simple." cross MA cross 3 MA cross three Moving Average across Moving cross Moving crossing  MA crossing MA across MA
FREE
Fractals Broken/Unbroken This indicator detects classic Bill Williams fractals and separates them into two categories: broken and unbroken fractals. The tool helps traders quickly identify which fractal levels have already been broken by price action and which levels remain intact as potential support or resistance zones. The indicator works directly on the chart and displays different fractal types using separate colors for easier visual analysis. How It Works The indicator uses the standard 5-
FREE
Hotkey Fractals EA is a trading expert advisor designed for manual and semi-automated trading, built on the logic of the Fractalsalligatorfilter indicator. The EA helps quickly identify trading opportunities based on fractals with Alligator line filtering and instantly place virtual or market orders with pre-calculated Entry, Stop Loss, and Take Profit levels. The advisor is created for traders who work with breakout strategies, fractal market structure, and trend-direction trading. Its main pur
FREE
このインジケーターは2色の移動平均線(MA)を表示します: 青色 — 前の足の始値と終値がMAラインの上にある場合。 赤色 — 前の足の始値と終値がMAラインの下にある場合。 カスタマイズ可能な設定: MAタイプ(単純、指数、平滑、線形); MA期間; MAの色変更時のアラート。 不具合があればお知らせください。修正します。 bar cross Moving  cross  candle cross Moving  cross bar cross MA cross candle cross MA cross bar cross Moving Average cross candle cross Moving Average cross bar このインジケーターは2色の移動平均線(MA)を表示します: 青色 — 前の足の始値と終値がMAラインの上にある場合。 赤色 — 前の足の始値と終値がMAラインの下にある場合。 カスタマイズ可能な設定: MAタイプ(単純、指数、平滑、線形); MA期間; MAの色変更時のアラート。 不具合があればお知らせください。修正します。 cr
FREE
The indicator draws two types of Bill Williams' fractals: Broken fractals   – the price has been at least once above or below these fractals. Unbroken fractals   – new fractals where the price has not yet moved above or below them. You can configure the color of the fractals, as well as the number of bars used for the indicator's display. фрактал Вильямса фрактал БВ фракталы Вильямса пробой фрактала пробитый фрактал Торговый хаос broken fractal unbroken fractal Williams fractal    Trading Haos
FREE
Hotkey Trader EA is an Expert Advisor for manual and semi-automatic trading in MetaTrader 5, designed for fast trade execution using hotkeys, automatic risk calculation, and convenient position management directly on the chart. The EA helps reduce manual actions during trading, automatically calculates Stop Loss and Take Profit levels, and supports both fixed lot trading and position sizing based on risk percentage. Main Features BUY and SELL order execution with hotkeys; instant market entries;
FREE
The indicator plots a   two-colored   Moving Average (MA): Blue color — the   previous   bar’s   open   and   close   prices are   above   the MA line. Red color — the   previous   bar’s   open   and   close   prices are   below   the MA line. Customizable settings: MA type (Simple, Exponential, Smoothed, Linear); MA period; Alert when the MA color changes. bar cross Moving  cross  candle cross Moving  cross bar cross MA cross candle cross MA cross bar cross Moving Average cross candle cross Mov
FREE
フィルタ:
レビューなし
レビューに返信