DR MTF Volatility Forecast Switcher

DR MTF Volatility Forecast Switcher

Master Market Momentum. Visualize the True Scale of Volatility.

🚀 Quick Overview

The DR MTF Volatility Forecast Switcher is a professional-grade dashboard designed for high-speed scalpers and day traders. It goes beyond traditional indicators by combining Tick Volume (Market Energy) and Price Range (Market Result) to give you a definitive real-time forecast of institutional activity.

  • Zero-Lag Architecture: Optimized via direct memory access.
  • All-in-One Dashboard: Monitor M1 to D1 simultaneously.
  • Instant Switcher: Click a tab to change your chart symbol instantly.

🌟 Core Innovations

1. Visualizing Volatility Propagation (The Ripple Effect)

Not all spikes are created equal. Is a sudden burst just 1-minute market noise, or a massive shockwave dictating the H4 trend?

  • See the Depth: Watch a localized M1 spike propagate up to M5, M15, and H1 in real-time.
  • Filter Fake-outs: Confirm true multi-timeframe breakouts by checking higher timeframe alignment.

2. High-Precision "Rolling Math" Engine

We do not wait for the candle to close. You get ultra-early warnings.

  • Live Calculation: Analyzes sub-minute tick speed and price expansion.
  • Future Projection: Mathematically projects where the current unclosed bar will finish compared to its historical average.

3. Smart Background Monitoring & Idle Tracker

Never miss a setup, even when looking at another chart.

  • Background Alerts: If Gold spikes while you trade EURUSD, the Gold tab flashes purple.
  • Smart Idle Tracker: Automatically pauses calculations for closed markets or disconnected symbols, saving CPU resources and preventing false alerts.

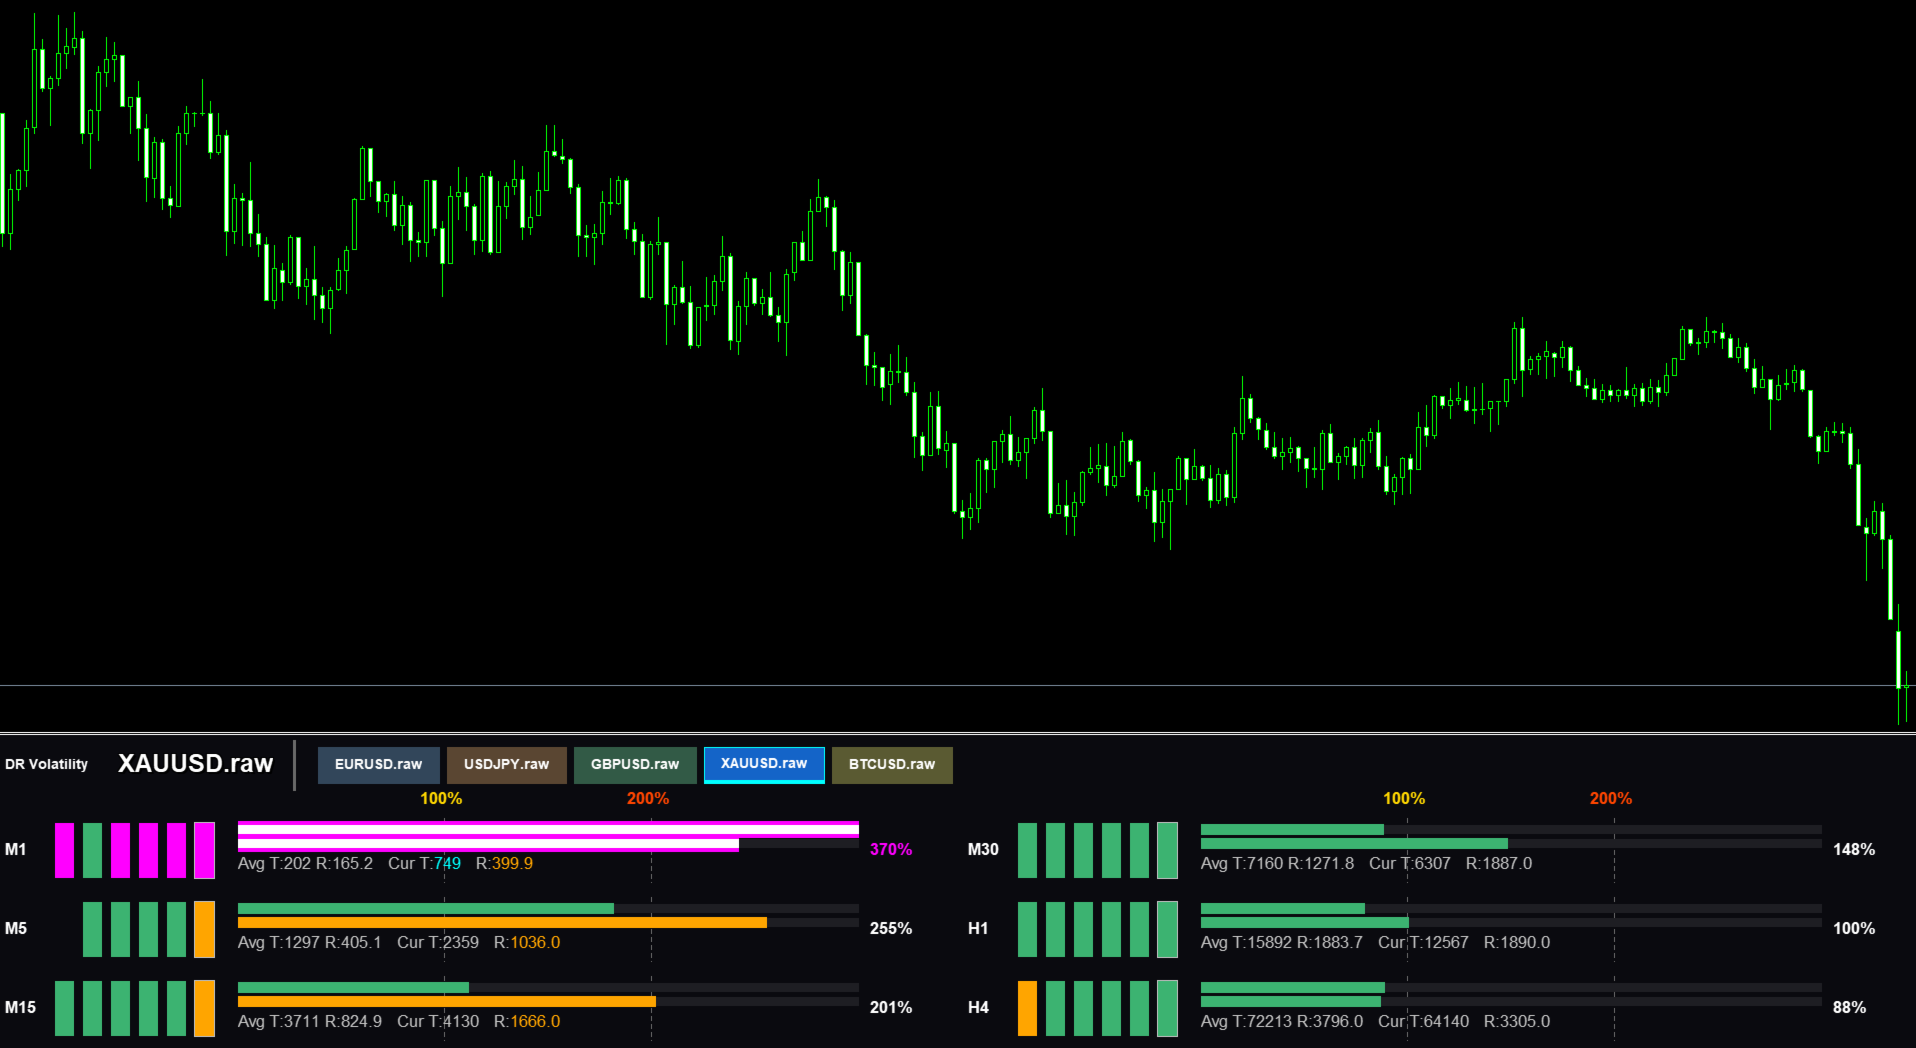
📊 How to Read the Dashboard

The dashboard separates Real-Time Action from Historical Context.

A. The Forecast Gauge Bars (Current Momentum)

The horizontal glowing bars represent the Current Unclosed Candle.

  • Tick Bar (Top): Measures Order Flow Speed.
  • Range Bar (Bottom): Measures Price Expansion.
  • 🟢 Green: Normal Activity.
  • 🔵 Cyan: Tick Spike (High volume, but price is not moving much yet).
  • 🟠 Orange: Range Spike (Price is jumping, but volume is thin).
  • 🟣 Purple (MEGA SPIKE): Both Tick & Range > 200%. Institutional intervention.

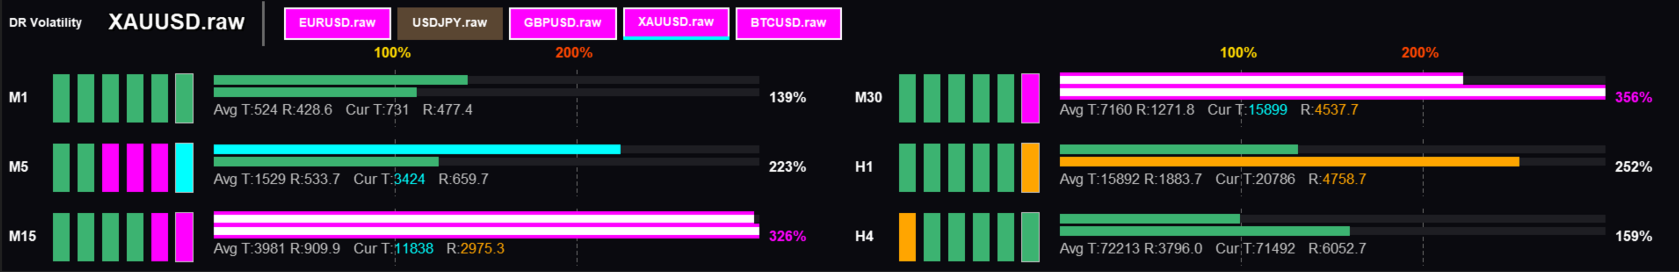
B. The Heatmap Blocks (Historical Footprints)

The small square blocks represent Closed Historical Candles.

  • Spot Sustained Pressure: A single purple gauge might be an anomaly. But a chain of 3 or 4 Purple History Blocks proves relentless institutional buying/selling.
  • Confirm Pullbacks: Check the heatmap to ensure the trend has structural strength before entering on a retracement.

📓 The Trader's Playbook (Strategies)

Play 1: The Mega Spike Scalp

  • Condition: M1 and M5 both flash Purple (Mega Spike) simultaneously.
  • Action: Enter with the momentum. This indicates high-conviction institutional flow.

Play 2: The News Filter (Cooling Off)

  • Condition: During NFP or CPI, gauges exceed 300% (Extreme danger).
  • Action: Wait. Trade only when the volatility stabilizes back into the 100%-200% zone to avoid massive slippage.

Play 3: Early Trend Detection

  • Condition: Higher TFs (H1, H4) show Green (Normal), while lower TFs (M1, M5) suddenly start flashing Purple.
  • Action: Prepare for a breakout. You are seeing the very beginning of a new intraday trend.

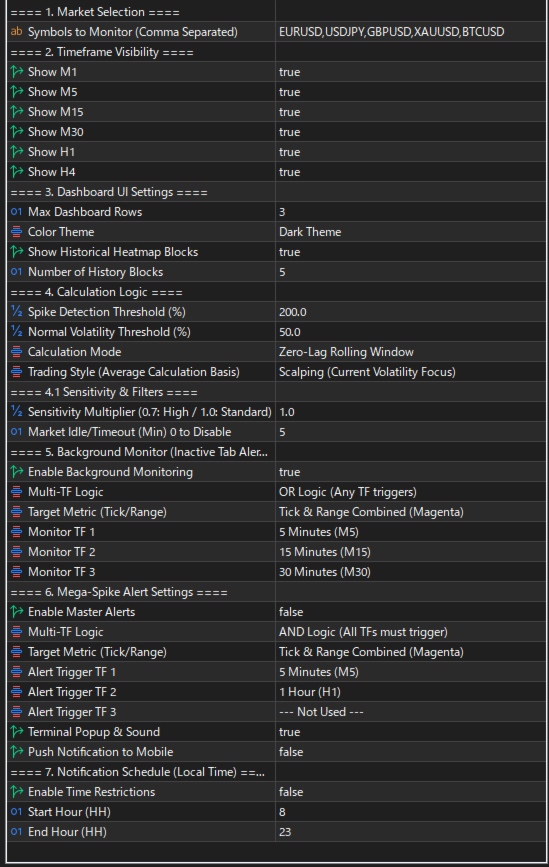
⚙️ Full Parameters Guide

  • 1. Symbol Settings: Input comma-separated symbols (e.g., EURUSD, XAUUSD).
  • 2. Timeframe Settings: Toggle M1, M5, M15, H1, H4, D1 visibility.
  • 3. UI Settings: Adjust Max Rows, Dark/Light Theme, and History Blocks count.
  • 4. Calculation:
    • Spike Threshold: Define the % for a Mega Spike (Default 200%).
    • Sensitivity: Fine-tune responsiveness (0.7 High, 1.0 Standard).
    • Idle Timeout: Minutes before stopping calculations on dead symbols.
  • 5. Background Monitor: Select up to 3 TFs for background tracking.
  • 6. Alerts: Enable Sound, Push Notifications, and target TFs.
  • 7. Time Filter: Restrict alerts to your active trading hours.

Engineered for Professional Use by dora.

おすすめのプロダクト
Haven Volume Profileは、取引量の分布に基づいて重要な価格レベルを識別するための多機能なボリュームプロファイル分析インジケーターです。市場をより深く理解し、重要なエントリーポイントとエグジットポイントを特定したいプロのトレーダー向けに設計されています。 その他の製品 ->  こちら 主な機能: Point of Control (POC) 計算 - 最大の取引活動が行われるレベルで、最も流動性の高いレベルを特定するのに役立ちます Value Area(高い活動の領域)の定義とカスタマイズ可能な取引量の割合で、取引範囲をより正確に評価できます ティックボリュームと実際の取引量の両方に対応し、さまざまな市場タイプや取引戦略に対応しています 計算期間(日数)の柔軟な設定により、任意の時間枠にツールを適応させることができます ターミナルのライトテーマとダークテーマに自動的に適応し、ユーザーインターフェースの視覚的な体験を向上させます レベルの視覚化が明確で、スタイルや色をカスタマイズでき、グラフ分析と迅速な意思決定を支援します このインジケーターは、重要な価格レベルや統合ゾー
FREE
High Low Open Close
Alexandre Borela
4.98 (44)
このプロジェクトが好きなら、5つ星レビューを残してください。 このインジケータは、指定されたためのオープン、ハイ、ロー、クローズ価格を描画します 特定のタイムゾーンの期間と調整が可能です。 これらは、多くの機関や専門家によって見られた重要なレベルです トレーダーは、彼らがより多くのかもしれない場所を知るために有用であり、 アクティブ。 利用可能な期間は次のとおりです。 前の日。 前週。 前の月。 前の四半期。 前年。 または: 現在の日。 現在の週。 現在の月。 現在の四半期。 現年。
FREE
FiveStarFX Gold Reversal Edge Professional automated trading solution designed for structured execution and controlled risk management in the Gold market. Built for traders who value discipline, precision, and consistency. Key Features Fully automated trading One trade at a time (controlled exposure) Fixed Stop Loss and Take Profit Smart Break-Even protection Profit lock with buffer Step-based trailing management Spread protection system Works on any broker Trade Management The E
FREE
Indicador IMI (Intraday Momentum Index) Descrição O Indicador IMI (Intraday Momentum Index) é uma poderosa ferramenta de análise técnica desenvolvida para identificar a força do momentum e potenciais reversões no mercado. Este indicador quantifica a relação entre ganhos e perdas durante um período específico, ajudando traders a avaliar a dinâmica atual do mercado. Características Oscila entre 0 e 100, facilitando a interpretação das condições de mercado Identifica com precisão áreas de sobrecomp
FREE
At its most basic, the "Average Directional Movement Index Wilder" (ADXW) can be used to determine if a security/index/currencie is trending or not. This determination helps traders choose between a trend-following system or a non-trend-following system. Wilder suggests that a strong trend is present when ADXW is above 25 and no trend is present when ADXW is below 20. There appears to be a gray zone between 20 and 25. ADXW also has a fair amount of lag because of all the smoothing techniques. Ma
This indicator calculates the volume profile and places labels that correspond to the VAH, VAL and POC levels, for each candle individually. Indicator operation features The indicator works on the timeframes from M3 to MN, but it uses the history data of smaller periods: M1 - for periods from M3 to H1, M5 - for periods from H2 to H12, M30 - for the D1 period, H4 - for the W1 period, D1 - for the MN period. The color and location of the VAL, VAH and POC labels on the current candle are considere
FREE
Raymond Cloudy Day Indicator for MT5 – Pivot-Based Reversal and Trend Levels Raymond Cloudy Day Indicator is a pivot-based level indicator for MetaTrader 5 (MT5). It was developed by Ngo The Hung based on Raymond’s original idea and is designed to give a structured view of potential reversal zones, trend extensions and support/resistance levels directly on the chart. The default settings are optimised for XAUUSD on the H1 timeframe, but the indicator can be tested and adjusted for other symbols
FREE
Easy GOLD MT5
Franck Martin
3.91 (43)
Easy Gold is the latest addition to the BotGPT family. It is surprising and very powerful. It is ideal for beginners due to its simplicity.  There is absolutely nothing to do, it's 100% automated, simply indicate the percentage of risk you want to take per trade and the EA is ready. Whatever your capital, the EA takes care of everything. Optimized on (XAUUSD).  Unleash all the power with the professional version (AGI Gold) and its connection to the neural network, available in my store. My othe
FREE
ENGLISH DESCRIPTION (MQL5 Standard Optimized) Product Name: Obsidian Forest Automaton AI (MT5) [Subtitle: Forest Structure | Obsidian Blade TEMA | Shield Safety] Introduction Obsidian Forest Automaton AI is a structural trend-following construct designed to navigate the market with the cold precision of an automaton. It builds a "Forest Structure" using Ichimoku Cloud , cuts through noise with the Obsidian Blade (TEMA) , and validates density with Standard Deviation . This creates a system that
FREE
Follow The Line MT5
Oliver Gideon Amofa Appiah
4.6 (35)
This indicator obeys the popular maxim that: "THE TREND IS YOUR FRIEND" It paints a GREEN line for BUY and also paints a RED line for SELL. (you can change the colors). It gives alarms and alerts of all kinds. IT DOES NOT REPAINT and can be used for all currency pairs and timeframes. Yes, as easy and simple as that. Even a newbie can use it to make great and reliable trades. NB: For best results, get my other premium indicators for more powerful and reliable signals. Get them here: https://www.m
FREE
The indicator is based on Robert Miner's methodology described in his book "High probability trading strategies" and displays signals along with momentum of 2 timeframes. A Stochastic oscillator is used as a momentum indicator. The settings speak for themselves period_1 is the current timeframe, 'current' period_2 is indicated - the senior timeframe is 4 or 5 times larger than the current one. For example, if the current one is 5 minutes, then the older one will be 20 minutes The rest of the s
FREE
FTU Qqe for MT5 Qs indicator for mt5 draws objects as arrows which is fine for manual trading but not reliable for EA/Algo Many arrow changes at certain times, so best to filter the signals using minimum one concept/logic Essentially an Rsi and moving average indicator - draws an arrow for suggestion of entry or change in trend The indicator is for MT5 platform, can be used stand alone >> best combined with other indicators and strategies New stable version coming soon Indicator Features: Sell
FREE
VFI Quantum
Nikita Berdnikov
5 (1)
Introducing VFI (Volume Flow Indicator) – a trading indicator that analyzes the relationship between volume and price movement to identify key trading opportunities. The indicator displays the strength and direction of volume flow, providing clear signals about potential entry and exit points. Signals are formed based on zero line crossovers, crossovers between the VFI line and its exponential moving average (EMA), and when the indicator exits overbought and oversold zones. Attention! This stra
FREE
このエキスパートアドバイザーは、一般にThe Turtle Traderとして知られる、元のDennis and Eckhardtトレーディングシステムを実装しています。元のカメが行ったのとまったく同じように取引され、経験豊富なトレーダーが上昇または下降市場のトレンドを把握するために使用できます。 [ インストールガイド | 更新ガイド | トラブルシューティング | よくある質問 | すべての製品 ] 使いやすく、監督 完全に構成可能な戦略設定 完全に構成可能な取引設定 ECN / Non-ECNブローカーおよび2-3-4-5桁の記号に対応 CFDおよび外国為替商品に対応 この戦略では、メインシステムとフェイルセーフシステムの2つの補完的なシステムを取り引きします。 システム1は20日間のブレークアウトを取引し、10日間のブレークアウトで取引を終了します システム2は55日間のブレークアウトを取引し、20日間のブレークアウトで取引を終了します 戦略の基本原則は次のとおりです。 トレードは最後のシグナルの結果に基づいてフィルタリングされます 取引は、ATR(30)/ 2の間隔で、最大
FREE
Donchian Pro
Paulo Henrique Faquineli Garcia
4.75 (4)
The Donchian Channel Channels are among the most popular tools of technical analysis, as they visually convey to the analyst the limits within which most price movement tends to occur. Channel users know that valuable information can be obtained at any time, whether prices are in the central region of a band or close to one of the border lines. One of the best known techniques to explore these concepts is Bollinger Bands. However, John Bollinger was not the only one to research the application
FREE
HiperCube レンコ キャンドルへようこそ Darwinex Zero 25%割引コード: DWZ2328770MGM このインジケーターは、市場の実際の情報を提供し、それをレンコ キャンドル スタイルに変換します。 定義 レンコ チャートは、価格変動を測定およびプロットする金融チャートの一種で、レンガ (またはバー) を使用して価格の動きを表します。従来のローソク足チャートとは異なり、レンコ チャートは時間ベースの情報を表示せず、価格変動のみに焦点を当てています。 機能: インジケーターを別のウィンドウに表示 キャンドルの色をカスタマイズ キャンドル/レンガのサイズをピップ単位でカスタマイズ Chat gptとAIが開発に使用されました レンコを使用した戦略の例: トレンドを特定 レンコ キャンドルでプルバックとエングルフィングを待つ エントリーする SL エングルフィングの下限 TP リスク リワード 1:2、1:3... これは例であり、基本または新しい戦略になる可能性があることに注意してください。ただし、実際のアカウントで使用する前に試してテストしてください。この情
FREE
H1NqAAAA
Jose Arranz Becerril
Bot specifically tailored for the NASDAQ 100, designed to detect key range breakouts and capitalize on market opportunities. Long Entry Signal : Detects bullish breakouts when the high of a previous range is below the closing price, and the daily low breaks below the lowest point of a defined range. Short Entry Signal : Identifies bearish breakouts when the high of a defined range crosses below the daily low. This bot is designed to be combined with my other products: H1NqAAAB (Mean Reversion)
This indicator can be considered as a trading system. It offers a different view to see the currency pair: full timeless indicator, can be used for manual trading or for automatized trading with some expert advisor. When the price reaches a threshold a new block is created according to the set mode. The indicator beside the Renko bars, shows also 3 moving averages. Features renko mode median renko custom median renko 3 moving averages wicks datetime indicator for each block custom notification
The Lomb algorithm is designed to find the dominant cycle length in noisy data. It is used commonly in the field of astronomy and is very good at extracting cycle out of really noisy data sets. The Lomb phase plot is very similar to the Stochastics indicator. It has two threshold levels. When it crosses above the lower level it’s a buy signal. When it crosses the upper level it’s a sell signal. This is cycle-based indicator, the nicer waves look, the better the signal. Caution Also It’s really i
Simple QM Pattern   is a powerful and intuitive trading indicator designed to simplify the identification of the Quasimodo (QM) trading pattern. The QM pattern is widely recognized among traders for effectively signaling potential   reversals   by highlighting key market structures and price action formations. This indicator helps traders easily visualize the QM pattern directly on their charts, making it straightforward even for those who are new to pattern trading. Simple QM Pattern includes d
FREE
Dual RSI
Paul Conrad Carlson
3.5 (2)
Indicator alerts for Dual Relative strength index rsi. Large rsi preset at 14 is below 30 small rsi preset at 4 is below 10 for buy bullish signals . Large rsi preset are 14 is above 70 small rsi preset at 4 is above 90 for sell bearish signals . Includes mobile and terminal alerts. draws lines when alerts. This indicator can help identify extremes and then the tops or bottoms of those extremes .
FREE
The one minute chart has a bug, but the one-day chart can still be used after deleting the bug and reloading the indicators, This indicator can be used to determine how far the indicator goes up to place an order to buy, how far it goes down to place an order to sell, and not placing an order until it reaches this distance, which is considered oscillation, open an account gift index
FREE
Indicador Volatilidade Histórica Indicador é um oscilador que faz o plot da volatilidade histórica de um ativo, representado pelas fórmulas: Volatilidade Histórica = Raiz quadrada da média das diferenças ao quadrado * Fator de anualização. Média das diferenças ao quadrado = soma de todas as diferenças de retorno diário / número total das diferenças. Retorno diário = (preço atual - preço anterior) / preço anterior. Nesse indicador estamos utilizando os preços de fechamento de cada barra e fazemos
FREE
Free automatic Fibonacci is an indicator that automatically plots a Fibonacci retracement based on the number of bars you select on the BarsToScan setting in the indicator. The Fibonacci is automatically updated in real time as new highest and lowest values appears amongst the selected bars. You can select which level values to be displayed in the indicator settings. You can also select the color of the levels thus enabling the trader to be able to attach the indicator several times with differe
FREE
LZ Session Boxes PRO is a professional-grade tool for day traders, designed to beautifully visualize global trading sessions (Asia, Pacific/Sydney, London, New York) across your entire chart history. It eliminates the confusion of broker time offsets by automatically detecting timezones and adjusting for Daylight Saving Time (DST), ensuring your session boxes always align perfectly with real-market hours. **SPECIAL PROMOTION: All PRO features are FREE to use until June 30, 2026!** Enjoy the
FREE
VolumeBasedColorsBars — Free Powerful Volume Analysis for All Traders Unlock the hidden story behind every price bar! VolumeBasedColorsBars is a professional-grade, 100% FREE indicator that colorizes your chart candles based on real, adaptive volume analysis. Instantly spot surges in market activity, identify exhaustion, and catch the moves that matter. This indicator gives you:    • Dynamic color-coded bars for instant volume context    • Adaptive thresholds based on historical, session-awar
FREE
CosmiCLab NY Liquidity PRO M1 Short Description Professional intraday liquidity model for MetaTrader 5 based on the New York opening range, liquidity sweeps, Fair Value Gaps, and retest confirmations. Full Description CosmiCLab NY Liquidity PRO M1 is an advanced intraday trading indicator for MetaTrader 5 designed for traders who work with New York session liquidity, market structure, and smart money concepts. The indicator automatically builds the first New York M15 range on the M1 chart (09:30
Nem Nem
Taha Saber Ashour Kamel
Nem Nem is super accurate mt5 indicator it is working with any pair any time frame it will show and provide you with high Winrate signal you can use for forex pairs , gold and any other pairs it is easy to use also you can see the white lines for starting and end of signals it will help you to read the chart and enter and make correct decisions in trades. also it  will be clear for you when to enter and exit from any trades
FREE
This is Gekko's Cutomized Cutomized Average Directional Index (ADX), a customized version of the famous ADX indicator. Use the regular ADX and take advantage two entry signals calculations and different ways of being alerted whenever there is potential entry or exit point. Inputs Period: Period for the ADX calculation; PlotSignalType: How will the indicator calculate entry (swing) signals: 1- ShowSwingsOnTrendLevel : Show Signals for Trend Confirmation Swings; 2- ShowSwingsOnTrendLevelDirection
Price Momentum
Flavio Javier Jarabeck
4.92 (12)
Value Chart indicator presents the Price evolution in a new form. This indicator, Price Momentum , was developed taking all the calculations presented in the book " Dynamic Trading Indicators " by Mark W. Helweg and David Stendahl (2002). The technique involves de-trended Prices from a user-defined Period of analysis and the addition of a Volatility index correction. The result is an Oscillator with 3 zones: Fair Price Value, Overbought/Oversold and Extremely Overbought/Oversold zones. Adding th
FREE
このプロダクトを購入した人は以下も購入しています
ARIPoint is a powerful trading companion designed to generate high-probability entry signals with dynamic TP/SL/DP levels based on volatility. Built-in performance tracking shows win/loss stats, PP1/PP2 hits, and success rates all updated live. Key Features: Buy/Sell signals with adaptive volatility bands Real-time TP/SL/DP levels based on ATR Built-in MA Filter with optional ATR/StdDev volatility Performance stats panel (Success, Profit/Loss, PP1/PP2) Alerts via popup, sound, push, or email Cu
SuperScalp Pro
Van Minh Nguyen
4.63 (24)
SuperScalp Pro – 高度なマルチフィルタースキャルピングインジケーターシステム SuperScalp Pro は、クラシックな Supertrend と複数のインテリジェント確認フィルターを組み合わせた高度なスキャルピングインジケーターです。M1 から H4 まで複数の時間足で効率的に動作し、XAUUSD、BTCUSD、主要 Forex 通貨ペア向けに最適化されています。 このインジケーターは明確な Buy / Sell シグナルを提供し、ATR に基づいてエントリー価格、Stop Loss、Take Profit を自動計算します。Fibonacci Take Profit 機能により、重要な価格帯で早期決済し、到達時に通知を送信します。 初期設定では Fibonacci Take Profit が有効化されており、より安定した取引体験を重視しています。チャートに適用するだけですぐ利用可能です。上級者向けに、すべてのパラメータは自由にカスタマイズできます。 EMA、RSI、ADX、Volume、VWAP、Bollinger Bands、MACD Divergence な
このインジケーターを購入された方には、以下の特典を 無料 で提供しています: 各トレードを自動で管理し、ストップロスとテイクプロフィットを設定し、戦略ルールに基づいてポジションを決済する補助ツール 「Bomber Utility」 様々な銘柄に合わせたインジケーターの設定ファイル(セットファイル) 「最小リスク」、「バランスリスク」、「待機戦略」 の3つのモードで使用できる Bomber Utility 用の設定ファイル このトレーディング戦略をすぐに導入・設定・開始できる ステップバイステップのビデオマニュアル ご注意: 上記の特典を受け取るには、MQL5のプライベートメッセージシステムを通じて販売者にご連絡ください。 オリジナルのカスタムインジケーター 「Divergence Bomber(ダイバージェンス・ボンバー)」 をご紹介します。これは、MACDのダイバージェンス(乖離)戦略に基づいた 「オールインワン」型のトレーディングシステム です。 このテクニカルインジケーターの主な目的は、価格とMACDインジケーターの間に発生するダイバージェンスを検出 し、将来の価格の動きを示す
Entry In The Zone and SMC Multi Timeframe is a real-time 2-in-1 market analysis tool that combines market structure analysis and a No Repaint BUY / SELL signal system into a single indicator, built on Smart Money Concepts (SMC) — a widely adopted framework used by professional traders to understand market structure. This indicator helps you see the market more clearly, make decisions based on structure rather than guesswork, and focus on high-probability zones where price is more likely to react
Power Candles V3 - 自己最適化型強弱インジケーター Power Candles V3は 、通貨や銘柄の強さを、適用されたすべてのチャート上で実行可能なトレードプランに変換します。単にローソク足を色分けするだけでなく、バックグラウンドでリアルタイムの自動最適化を実行し、目の前の銘柄に対して最適なストップロス、テイクプロフィット、およびシグナルの閾値を提示します。ワンクリックで実取引に適用でき、エントリーポイント、ストップロス、テイクプロフィットのラインが正確な価格位置にチャート上に表示され、方向性を示すアラートがリアルタイムで発動します。 このツールは、Stein Investmentsのエコシステムの一部です。  18種類以上のツールをすべて閲覧し、AIを活用したセットアップの推奨事項を入手し、  https://stein.investments でコミュニティに参加しましょう クローズしたバーごとに3,000回以上のトレードシミュレーション。9つの強さの状態。2つの戦略を並行してテスト。勝率の高い設定をワンクリックで適用。 なぜこれが必要なのか ほとんどの強
SignalTech MT5 is an unique fully rule based trading system for EURUSD, USDCHF, USDJPY, AUDUSD, NZDUSD, EURJPY, AUDJPY, NZDJPY, CADJPY.  All the winning trades with chart setups are published on the comments page. 2026-05 2802 Pips (Until 05-15 NY Closed) 2026-04 2243 Pips 2026-03 2165 Pips 2026-02 2937 Pips 2026-01 2624 Pips 2025-12 1174 Pips It can generate signals with Buy/Sell Arrows and Pop-Up/Sound Alerts. Each signal has clear Entry and Stop Loss levels, which should be automatically flag
このインジケーターを購入すると、プロ仕様のトレードマネージャーを無料で差し上げます。 まず第一に、このトレーディングシステムがノンリペイント、ノンリドロー、ノンラグのインジケーターであることを強調する価値がある。これにより、手動取引とロボット取引の両方に理想的なものになっています。 オンラインコース、マニュアル、プリセットのダウンロード。 「スマートトレンドトレーディングシステム MT5」は、新規および経験豊富なトレーダー向けにカスタマイズされた包括的なトレーディングソリューションです。10以上のプレミアムインジケーターを組み合わせ、7つ以上の堅実なトレーディング戦略を備えており、多様な市場状況に対応する多目的な選択肢となっています。 トレンドフォロー戦略:トレンドを効果的に乗り越えるための正確なエントリーとストップロス管理を提供します。 リバーサル戦略:潜在的なトレンドの反転を特定し、トレーダーがレンジ相場を活用できるようにします。 スキャルピング戦略:高速で正確なデイトレードおよび短期取引のために設計されています。 安定性:すべてのインジケーターはノンリペイント、ノンリドロー、ノ
ご紹介     Quantum Breakout PRO は 、ブレイクアウト ゾーンの取引方法を変革する画期的な MQL5 インジケーターです。 13年以上の取引経験を持つ経験豊富なトレーダーのチームによって開発されました。     クォンタム ブレイクアウト プロ   は、革新的でダイナミックなブレイクアウト ゾーン戦略により、あなたのトレーディングの旅を新たな高みに押し上げるように設計されています。 クォンタム ブレイクアウト インジケーターは、5 つの利益ターゲット ゾーンを備えたブレイクアウト ゾーン上のシグナル矢印と、ブレイクアウト ボックスに基づいたストップロスの提案を提供します。 初心者トレーダーにもプロのトレーダーにも適しています。 量子EAチャネル:       ここをクリック 重要!購入後、インストールマニュアルを受け取るためにプライベートメッセージを送ってください。 推奨事項: 時間枠: M15 通貨ペア: GBPJPY、EURJPY、USDJPY、NZDUSD、XAUUSD アカウントの種類: ECN、Raw、またはスプレッドが非常に低い R
Azimuth Pro
Ottaviano De Cicco
5 (7)
Azimuth Pro V2:MT5向けシンセティック・フラクタル構造分析と確認済みエントリー 概要 Azimuth Pro は Merkava Labs によるマルチレベルスイング構造インジケーターです。4つのネストされたスイングレイヤー、スイングアンカーVWAP、ABCパターン検出、3タイムフレーム構造フィルタリング、そして確定バーでの確認済みエントリー — 1つのチャートで、ミクロスイングからマクロサイクルまでを網羅するワークフロー。 これはブラインドシグナル製品ではありません。ロケーション、コンテキスト、タイミングを重視するトレーダーのための構造ファーストワークフローです。 V2発売記念オファー — Azimuth Pro V2をUSD 399で(次の100本)。最終価格:USD 499。 1. V2での変更点 シンセティック・マルチタイムフレームエンジン 上位タイムフレーム分析をMeridian Proと同じ独自のシンセティックアーキテクチャで一から再構築。よりクリーンなHTFコンテキスト、安定したライブ動作、従来のMTF同期問題なし。シンセティックエンジンは 固定比率タ
Meridian Pro
Ottaviano De Cicco
5 (2)
Meridian Pro 2.00:MT5向けプロ仕様マルチタイムフレーム・トレンドマトリクス Meridian Pro 2.00 は、MetaTrader 5 向けのプロ仕様の適応型トレンドマトリクスです。オリジナルの Meridian トレンドエンジン、クリーンなチャート ribbon、確定足ベースのシグナル矢印、8時間足 dashboard、Fuel momentum、weighted consensus、synthetic HTF processing、そしてチャート上に直接表示される上位足コンテキストラインを統合します。 目的はシンプルです。現在のトレンド、マルチタイムフレーム構造、強度、momentum、EA-ready 状態を、複数チャートに無関係なインジケータを重ねるのではなく、1つの整理された workflow で読むことです。 Meridian Pro の違い 1つの適応型エンジン - 同じ volatility-aware Meridian ロジックを M1 から W1 まで適用します。 Synthetic HTF architecture - 上位足行は下位足デ
FX Trend NG:次世代マルチマーケット・トレンドインテリジェンス 概要 FX Trend NG は、複数の時間足に対応したプロフェッショナル向けトレンド分析およびマーケット監視ツールです。 市場全体の構造を数秒で把握することができます。 複数のチャートを切り替える必要はありません。どの銘柄がトレンド中なのか、どこでモメンタムが弱まっているのか、そしてどの時間足で強い整合性があるのかを瞬時に確認できます。 ローンチ特別オファー – FX Trend NG を $30(6ヶ月) または $80 永久ライセンス でご利用いただけます。 すでに Stein Investments のユーザーですか? -> メッセージを送信 して、プライベートグループへアクセスしてください。 セットアップや詳細情報が必要ですか? -> Stein Investments 公式ページ をご覧ください。 1. FX Trend NG が他と異なる理由 3ステート・トレンドロジック ― Buy と Sell だけではない • 多くのインジケーターは Buy または Sell の2状態のみを表示します。
まず第一に、この取引ツールはノンリペイント、ノンリドロー、ノンラグの指標であり、プロの取引に理想的ですことを強調する価値があります。 オンラインコース、ユーザーマニュアル、デモ。 スマートプライスアクションコンセプトインジケーターは、新米から経験豊富なトレーダーまで、非常 に強力なツールです。Inner Circle Trader AnalysisやSmart Money Concepts Trading Strategiesなど、20以上の有用な指標を1つに組み合わせています。このインジケーターはスマートマネーコンセプトに焦点を当て、大手機関の取引方法を提供し、彼らの動きを予測するのに役立ちます。 特に、流動性分析に優れており、機関がどのように取引しているかを理解しやすくしています。市場のトレンドを予測し、価格の動きを慎重に分析するのに優れています。機関の戦略とトレードを合わせることで、市場の動向についてより正確な予測ができます。このインジケーターは多目的であり、市場構造を分析し、重要な注文ブロックを特定し、さまざまなパターンを認識するのに優れています。 このインジケーター
このダッシュボードは、選択されたシンボルの最新の利用可能なハーモニックパターンを表示するので、時間を節約し、より効率的に /   MT4バージョン 。 無料インジケーター:   Basic Harmonic Pattern インジケーター列 Symbol : 選択したシンボルが表示されます。 Trend :   強気または弱気 Pattern : パターンの種類(ガートレー、バタフライ、バット、カニ、サメ、サイファー、ABCD) Entry : エントリー価格 SL: ストップロス価格 TP1: 1回目の利食い価格 TP2: 2回目の利食い価格 TP3:   3回目の利食い価格 Current price :   現在値 Age (in bars):    最後に描画されたパターンの年齢 主な入力項目 Symbols:   "28 Major Currency Pairs "または "Selected Symbols "から選択。 Selected Symbols:   カンマで区切られた監視したいシンボル("EURUSD,GBPUSD,XAUUSD")。ブローカーがペアに接
多くの矢印インジケーターは、シグナルだけを表示して、その後の判断をすべてトレーダーに任せてしまいます。KT Alpha Hunter Arrows は、完整なトレードプランをチャート上に提示します。 各シグナル矢印が表示されるたびに、エントリーライン、ストップロス、4つのテイクプロフィット水準、そして現在の銘柄と時間足が今トレードに値するかどうかを示すリアルタイムのエッジ判定が、すでに描画された状態で表示されます。付属の Trade Manager EA は、あなたが手動でエントリーした後の実行管理を担当し、相場が荒れて判断がぶれやすい場面でも規律あるトレードを保ちやすくします。リペイントなし。確定足シグナルのみ。Forex、ゴールド、指数、その他あなたが取引するあらゆる銘柄に対応します。 主な機能 リペイントしない買い矢印と売り矢印を、足の確定後にのみ表示。 各シグナルに、エントリーライン、構造的ストップロス、4つのテイクプロフィット水準を表示。 Edge Dashboard が、現在のチャートで買いセットアップと売りセットアップを別々に評価。 判定システム:No Edge、Mar
FX Power: 通貨の強弱を分析して、より賢い取引を実現 概要 FX Power は主要通貨と金の実際の強弱をあらゆる市場状況で理解するための必須ツールです。強い通貨を買い、弱い通貨を売ることで、 FX Power は取引の意思決定を簡素化し、高い確率の取引機会を見出します。トレンドを追従する場合でも、極端なデルタ値を使用して反転を予測する場合でも、このツールはあなたの取引スタイルに完全に適応します。ただ取引するだけではなく、 FX Power で賢く取引をしましょう。 1. なぜ FX Power がトレーダーにとって非常に有益なのか 通貨と金のリアルタイム強弱分析 • FX Power は主要通貨と金の相対的な強弱を計算し、マーケットダイナミクスに関する明確な洞察を提供します。 • どの資産がリードしているか、または後れを取っているかを監視して、取引するペアを賢く選びましょう。 マルチタイムフレームの包括的なビュー • 短期、中期、長期のタイムフレームで通貨と金の強弱を追跡し、マーケットトレンドに基づいて取引戦略を調整できます。 • スキャルピングからスイングトレード
まず第一に、この取引インジケーターは再描画されず、再描画されず、遅延しないことを強調する価値があります。これにより、手動取引とロボット取引の両方に理想的なものになります。 ユーザーマニュアル:設定、入力、戦略。 アトミックアナリストは、価格の強さとモメンタムを利用して市場でより良いエッジを見つけるためのPA価格アクションインジケーターです。ノイズや誤ったシグナルを除去し、取引ポテンシャルを高めるための高度なフィルターを備えています。複雑なインジケーターの複数のレイヤーを使用して、アトミックアナリストはチャートをスキャンし、複雑な数学的計算をシンプルなシグナルと色に変換します。これにより、どのような初心者トレーダーでも理解して使用し、一貫した取引の決定を行うことができます。 「アトミックアナリスト」は、新規および経験豊富なトレーダー向けにカスタマイズされた包括的な取引ソリューションです。プレミアムインジケーターとトップノッチの機能を1つの取引戦略に組み合わせ、すべてのタイプのトレーダーにとって汎用性のある選択肢にします。 デイリートレーディングとスキャルピング戦略:高速で正確なデイ
Quantum TrendPulse を ご紹介します。これは、   SuperTrend   、   RSI   、および Stochastic のパワーを 1 つの包括的なインジケーターに組み合わせて、取引の可能性を最大限に引き出す究極の取引ツールです。精度と効率を求めるトレーダー向けに設計されたこのインジケーターは、市場のトレンド、勢いの変化、最適なエントリー ポイントとエグジット ポイントを自信を持って特定するのに役立ちます。 主な特徴: SuperTrend 統合: 現在の市場動向に簡単に追従し、収益性の波に乗ることができます。 RSI精度: 買われすぎと売られすぎのレベルを検出し、市場の反転のタイミングに最適で、SuperTrendのフィルターとして使用されます。 確率的精度: 確率的振動を活用して、変動の激しい市場で隠れたチャンスを見つけます。SuperTrend のフィルターとして使用されます。 マルチタイムフレーム分析:   M5 から H1 または H4 まで、さまざまなタイムフレームで市場を常に把握します。 カスタマイズ可能なアラート: カスタム取引条件が満たされ
優れたテクニカルインジケーター「Grabber」をご紹介します。これは、すぐに使える「オールインワン」トレーディング戦略として機能します。 ひとつのコードに、市場のテクニカル分析ツール、取引シグナル(矢印)、アラート機能、プッシュ通知が強力に統合されています。 このインジケーターを購入された方には、以下の特典を無料で提供します: Grabberユーティリティ:オープンポジションを自動で管理するツール ステップバイステップのビデオマニュアル:インジケーターのインストール、設定、取引方法を解説 カスタムセットファイル:インジケーターをすばやく自動設定し、最大限の成果を出すための設定ファイル 他の戦略はもう忘れてください!Grabberだけが、あなたを新たなトレードの高みへと導いてくれるのです。 Grabber戦略の主な特徴: 推奨タイムフレーム:M5〜H4 対応通貨ペア・資産:どれでも使用可能ですが、私が実際に検証した以下を推奨します(GBPUSD、GBPCAD、GBPCHF、AUDCAD、AUDUSD、AUDSGD、AUDCHF、NZDUSD、NZDCAD、EURCAD、EURUSD、E
GEM Signal Pro GEM Signal Pro は、MetaTrader 5 向けのトレンドフォロー型インジケーターです。より明確なシグナル、より整理されたトレードセットアップ、そして実用的なリスク管理をチャート上で確認したいトレーダーのために設計されています。 単純な矢印だけを表示するのではなく、GEM Signal Pro はトレード全体の考え方を、より見やすく分かりやすい形で表示します。条件が確認されると、インジケーターはエントリー価格、ストップロス、利確目標をチャート上に表示し、トレードセットアップをより効率的に確認できるようにします。 動作の仕組み このインジケーターは、まず内部ロジックに基づいて有効なシードシグナルを検出します。 確認条件が満たされると、GEM Signal Pro はチャート上に完全なセットアップを表示します。これにより、トレーダーはトレード構造をより明確に把握し、手作業による分析を減らすことができます。 チャート上のトレードレベル 確認済みシグナルに対して、GEM Signal Pro は以下を表示できます。 エントリー価格 ストップロス テ
これはMT5のインジケーターで、再描画なしで取引に参入するための正確なシグナルを提供します。 外国為替、暗号通貨、金属、株式、インデックスなど、あらゆる金融資産に適用できます。かなり正確な見積もりを提供し、取引を開始して終了するのに最適な時期を教えてくれます。1つのシグナルを処理しただけでインジケーターの元が取れた例の 動画 (6:22)をご覧ください。Entry PointsPro インジケーターの助けを借りたほとんどのトレーダーの最初の1週間の結果が改善しています。 Telegramグループ に登録してください。Entry Points Proインジケーターのメリットは次の通りです。 再描画のないエントリーシグナル 再描画されるインジケーターでは一度表示されたシグナルが削除されて大きな金銭的損失につながることがありますが、これと異なり、表示されて確認されたシグナルは消えることがありません。 エラーなしの取引開始 インジケーターアルゴリズムによって取引を開始する(資産を売買する)理想的な瞬間を見つけることができます。それを使用するすべてのトレーダーの成功率が向上します。 あら
Trend Forecaster – Since 2023. The Trend Forecaster indicator utilizes a unique proprietary algorithm to determine entry points for a breakout trading strategy. The indicator identifies price clusters, analyzes price movement near levels, and provides a signal when the price breaks through a level. The Trend Forecaster indicator is suitable for all financial assets, including currencies (Forex), metals, stocks, indices, and cryptocurrencies. You can also adjust the indicator to work on any time
RelicusRoad Pro: 定量的市場オペレーティングシステム 【期間限定】無制限アクセス 70% OFF - 2,000人超のトレーダーと共に なぜ多くのトレーダーは「完璧な」インジケーターを使っても失敗するのでしょうか? それは、文脈を無視して 単一の概念 だけでトレードしているからです。文脈のないシグナルは単なるギャンブルです。勝ち続けるには、 根拠の重なり(コンフルエンス) が必要です。 RelicusRoad Proは単なる矢印インジケーターではありません。完全な 定量的市場エコシステム です。独自のボラティリティモデリングを用いて、価格が推移する「適正価値の道(Fair Value Road)」をマッピングし、ノイズと真の構造的ブレイクを判別します。 推測はやめましょう。機関投資家レベルの「ロード・ロジック」でトレードを。 コアエンジン:「Road」アルゴリズム システムの中心となる Road Algo は、市場環境にリアルタイムで適応するダイナミックなボラティリティチャネルです。 安全ライン(平衡点) と、価格が数学的に反転しやすい 拡張レベル を投影します。 Si
BTMM State Engine Pro is a MetaTrader 5 indicator for traders who use the Beat The Market Maker approach: Asian session context, kill zone timing, level progression, peak formation detection, and a multi-pair scanner from a single chart. It combines cycle state logic with a built-in scanner dashboard so you do not need the same tool on many charts at once. What it does Draws the Asian session range; session times can follow broker server offset or be set in inputs. Tracks level progression (L
Hydra Trend Rider is a non-repainting, multi-timeframe trend indicator that delivers precise buy/sell signals and real-time alerts for high-probability trade setups. With its color-coded trend line, customizable dashboard, and mobile notifications, it's perfect for traders seeking clarity, confidence, and consistency in trend trading. Setup & Guide:  Download  MT4 Version here. To learn how to use the Indicator: Indicator Manual & Guide -   Read Here Follow our MQL5 channel for daily market ins
トレンドラインプロ   市場の真の方向転換点を理解するのに役立ちます。この指標は、真のトレンド反転と主要プレーヤーが再び参入するポイントを示します。 分かりますか     BOSライン   複雑な設定や不要なノイズなしに、より長い時間足でのトレンドの変化と重要なレベルを把握できます。シグナルは再描画されず、バーが閉じた後もチャート上に残ります。 MT4バージョン   -   RFI LEVELS PRO インジケーター と組み合わせることで、その最大限の能力を発揮します インジケーターが示す内容: 本当の変化   トレンド(BOSライン) 一度シグナルが現れたら、それは有効です!これは、リペイント機能を持つインジケーターとの重要な違いです。リペイント機能を持つインジケーターは、シグナルを発した後、それを変更し、資金の損失につながる可能性があります。これにより、より高い確率と精度で市場に参入できます。また、矢印が現れた後、目標値(利益確定)に達するか、反転シグナルが現れるまで、ローソク足の色を変更する機能もあります。 繰り返しエントリ   主要プレーヤーの補充 エントリーポイントを探す
Introducing Indicator for PainX and GainX Indices Traders on Weltrade Get ready to experience the power of trading with our indicator, specifically designed for Weltrade   broker's PainX and GainX Indices.  Advanced Strategies for Unbeatable Insights Our indicator employs sophisticated strategies to analyze market trends, pinpointing optimal entry and exit points.  Optimized for Maximum Performance To ensure optimal results, our indicator is carefully calibrated for 5-minute timeframe charts on
このインジケーターは、反転ポイントと価格戻りゾーンを正確に表示します。     主要プレーヤー 。新たなトレンドが形成される場所を把握し、最大限の精度で意思決定を行い、すべての取引をコントロールします。 TREND LINES PRO インジケーターと組み合わせることで、その潜在能力を最大限に発揮します。 VERSION MT4 インジケーターが示す内容: 新しいトレンドの始まりに活性化する反転構造と反転レベル。 リスクと報酬の比率を最小限に抑えた利益 確定 と 損失停止の レベルの表示     RR 1:2   。 インテリジェントな削減ロジックによるストップロス。 指定されたインジケーターから 2 つのトレンド タイプの反転パターンを表示します。 指標: トレンドを追う   TREND LINES PRO   (世界的なトレンドの変化) TREND PRO   (クイックトレンド変更) シンプルで効果的   スキャナー   リアルタイムトレンド(新機能)。 マルチタイムフレームのインストゥルメント フィルタリング。 画面   利益     LOGIC AI信号の後。 当日プラス方
OmniSync Projection
Antonio-alin Teculescu
5 (1)
Chronos Fractal Engine is an innovative price projection indicator for MetaTrader 5, designed to transform your technical analysis by intelligently identifying and projecting historical price patterns. Built upon an advanced correlation algorithm and the fractal principles of the market, this powerful tool visualizes potential future price movements, giving you a unique edge in your trading decisions. What is Chronos Fractal Engine? At its core, the Chronos Fractal Engine employs a sophisticat
このインディケータは、価格アクション分析とドンチャンチャネルのみを使用して、ジグザグ方式で価格の反転を検出します。再描画やバックペインティングを一切行わずに、短期取引向けに特別に設計されています。それは彼らの操作のタイミングを増やすことを目指している賢明なトレーダーにとって素晴らしいツールです。 [ インストールガイド | 更新ガイド | トラブルシューティング | よくある質問 | すべての製品 ] 驚くほど簡単に取引できます すべての時間枠で価値を提供します 自己分析統計を実装します 電子メール/音声/視覚アラートを実装します 可変長のブレイクアウトと混雑ゾーンに基づいて、インディケータは価格アクションのみを使用して取引を選択し、市場が非常に高速に行っていることに反応します。 過去のシグナルの潜在的な利益が表示されます この指標は、独自の品質とパフォーマンスを分析します 負けブレイクアウトは強調表示され、説明されます インジケータは、非バックペインティングおよび非再ペイントです この指標は、日中のトレーダーが単一の価格反転を見逃さないようにするのに役立ちます。ただし、すべての
通貨強さウィザードは、取引を成功させるためのオールインワン ソリューションを提供する非常に強力な指標です。このインジケーターは、複数の時間枠のすべての通貨のデータを使用して、このまたはその外国為替ペアのパワーを計算します。このデータは、使いやすい通貨インデックスと通貨パワーラインの形式で表され、特定の通貨のパワーを確認するために使用できます。 必要なのは、取引したいチャートにインジケーターを接続することだけです。インジケーターは、取引する通貨の実際の強さを示します。このインジケーターは、トレンドに合わせて取引するときに有利に利用できる売買高の圧力の極値も示します。このインジケーターには、フィボナッチに基づく可能なターゲットも表示されます。 このインジケーターは、PUSH 通知を含むあらゆるタイプのアラートを提供します。 購入後ご連絡下さい。私の取引のヒントをあなたと共有し、素晴らしいボーナスインジケーターを無料で提供します! 幸せで有益な取引をお祈りします。
作者のその他のプロダクト
Master the Flow of Price Action. The Ultimate Keyboard-Driven Toolkit for SMC Traders Stop fighting your MT5 interface. Start trading the markets at the speed of thought. The Problem with Standard MT5 If you trade Smart Money Concepts (SMC) or Price Action, precision and speed are your lifeline. But standard MT5 slows you down. Right-clicking to open properties, manually typing "BOS", or watching your 1-Minute chart get cluttered by 4-Hour drawings... these micro-delays pull you out of the "F
フィルタ:
レビューなし
レビューに返信