Market Profile Heatmap

5
MP TPO Heatmap — Market Profile (TPO) with VAH/VAL/POC/IB

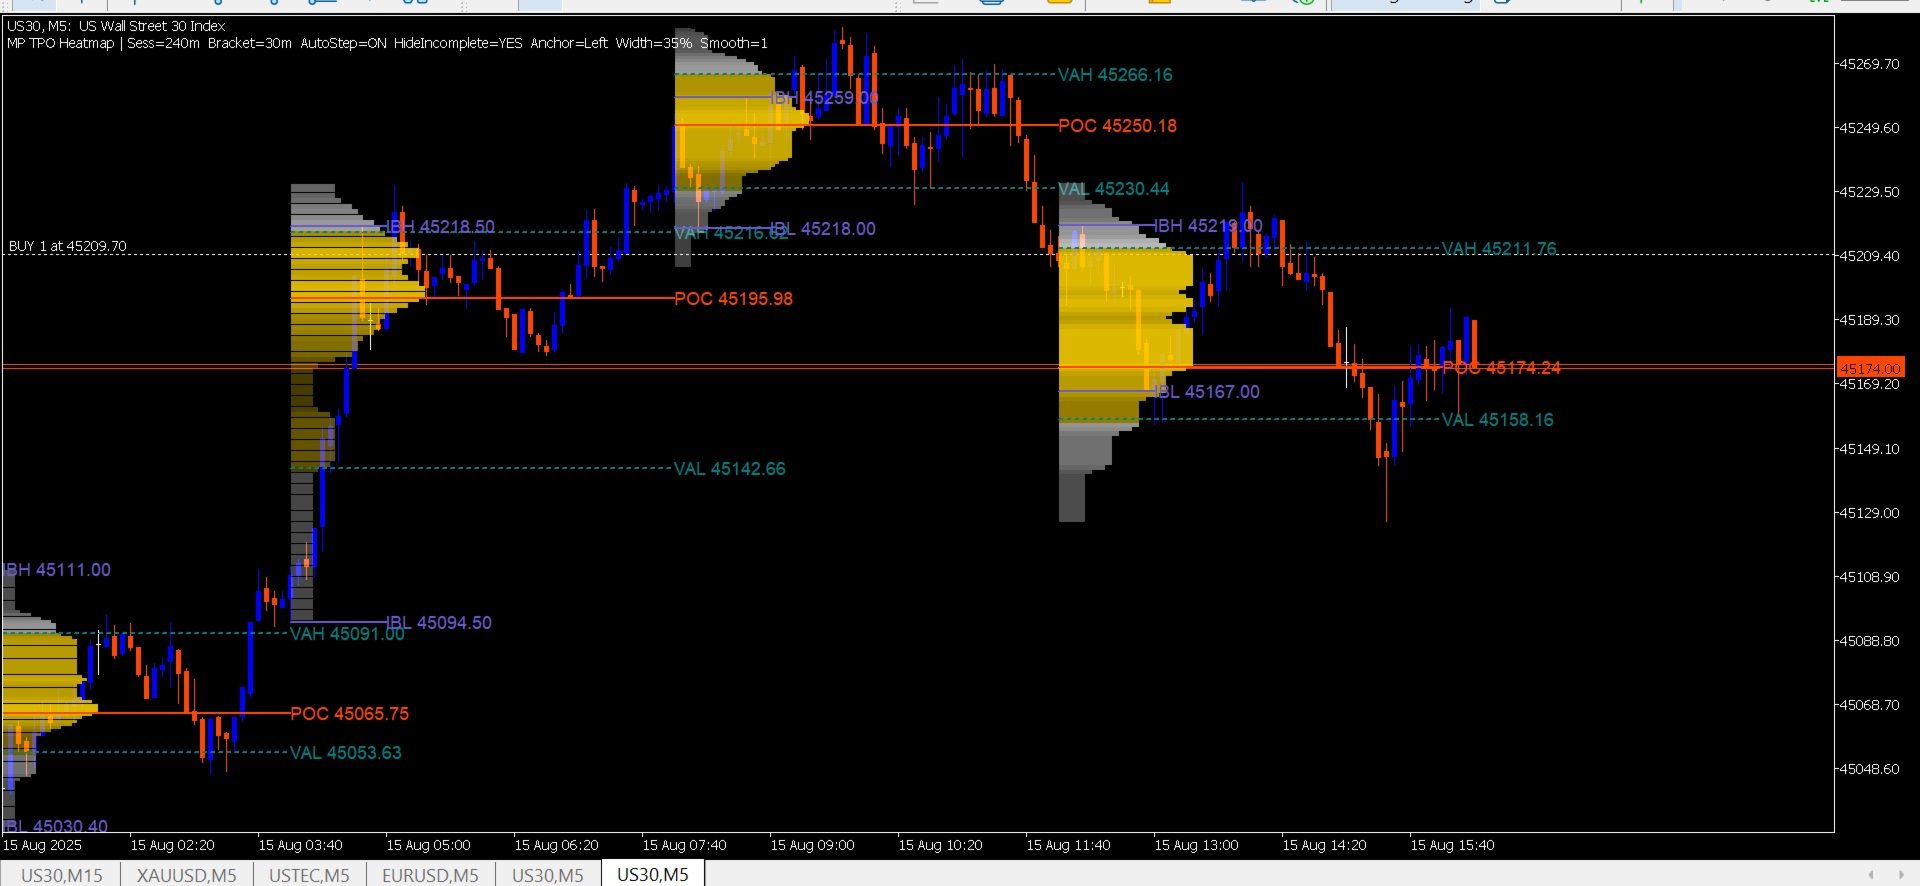
Market Profile is a way to visualize how price accepts or rejects value within a session. Instead of averaging, it counts how often price traded at each level during equal-time “brackets.” The result is a distribution you can read at a glance: thick areas = acceptance; thin edges = rejection.

This indicator implements a TPO-based Market Profile with clean session lines (POC, VAH, VAL, IBH, IBL) and a fast, two-tone heatmap cloud that highlights the value area vs. non-value prices.

What it does

  • True TPO Profile

    • Counts Time Price Opportunities in fixed time brackets (default 30 minutes) and builds a per-session distribution.

  • Multiple Sessions

    • Plot the last N profiles (e.g., several 4H sessions on a 5-minute chart, or daily profiles on M15/H1).

  • POC / VAH / VAL

    • POC = price level with the most TPOs.

    • VAH/VAL from quantiles (defaults 15% / 85% of cumulative TPOs) for stable boundaries even when the distribution isn’t perfectly bell-shaped.

  • Initial Balance (IB)

    • Draw IBH / IBL for the first X minutes of each session (classic context for breakouts and fades).

  • Heatmap Cloud

    • Single bitmap per session (low CPU).

    • Two colors: Value Area vs Non-Value.

    • Adjustable opacity range and gamma (controls intensity curve).

    • Optional vertical smoothing to soften step edges.

  • Clean, readable labels

    • Price-stamped labels for POC/VAH/VAL and IB lines.

  • Performance-friendly

    • Auto step sizing by symbol tick size, targeted bin count, and per-session range.

    • Repaints only on new bars; on scroll/zoom it rebuilds to match scale (no artifacts).

Typical setups

  • Intraday (futures/indices/FX):

    • Chart: M5–M15

    • Session length: 240 min (4H) or 480 min (8H)

    • Bracket: 30 min

    • IB: 60 min

  • Daily profiles:

    • Chart: M15/H1

    • Session length: 1440 min (1D)

    • Bracket: 30 min or 60 min

  • Weekly profiles:

    • Session length ≈ 5 × 1440 (adjust for broker week).

Mix and match: session length is independent of chart timeframe.

Inputs (grouped)

Session & Structure

  • Sess (minutes) : length of each session window.

  • Bracket (minutes) : TPO bracket size (letters).

  • IB (minutes) : initial balance window (0 disables).

Stepping / Bins

  • AutoStep : auto bin size using tick size & target bin count.

  • Target/Min/Max Bins : shape smoothness & performance guard.

  • Manual Step (points) : fixed bin size if AutoStep = off.

Value Area

  • VAL % / VAH % : lower/upper quantiles of cumulative TPOs (defaults 15/85 ≈ central 70%).

    Note: Classic MP often defines VA as the central 70% around the POC. Using quantiles is robust on skewed/multi-modal distributions and closely matches the classic result when the profile is unimodal.

Visualization

  • Draw Heatmap : on/off.

  • Anchor : left/right side of session.

  • Width % : cloud width as % of session span.

  • Colors: Value Area and Non-Value hues.

  • Alpha min/max, Gamma, Smoothing passes.

Lines & Labels

  • Colors for POC, VA lines, IB lines; line width; label font size.

Redraw & Visibility

  • Hide current forming session (default ON): only completed sessions are shown.

  • Redraw on new bar only (default ON): minimizes CPU while remaining responsive.

How to read it (quick primer)

  • POC migration hints at where value is developing over time.

  • Rejections at VAH/VAL (thin/short rows) may signal rotation back to value; acceptance beyond VA often builds a new distribution.

  • IB breaks can lead to trend days; failed IB breaks often rotate back toward the POC.

  • Gaps & single prints (very thin areas) are potential magnets later.


レビュー 1
220072256
4761
220072256 2025.08.18 19:19 
 

This is a special indicator for scalpers and conservative traders!

All parameters are adjustable, making it a formidable reference point in manual trading.

Congratulations to the author for his commitment to perfecting this formidable tool.

Update 20 August 2025

Excellent upgrade!!!

おすすめのプロダクト
General Description In the simplest terms this is a contrarian intra-day scalping system. Built to try and let correct trades run as far as possible and flip the trade when indicated. The indicator looks at historical daily trading ranges to lay out levels at which it takes long and short positions based on the statistical levels. The indicator is built around index futures, mainly around S&P and the DOW but can be used an any futures contract mainly using AMP Futures to trade. The indicator is
This is a common, simple and easy to use but effective tool to manage trading risks for all traders. It also help trader places stop loss and take profit levels at the same time the order is filled. How to set the expert advisor's parameters to support your trading style? Lots size. Fixed lots size - For traders who prefered to trade with fixed lots size, they can input the lots size in 'User lots' menu in the expert advisor's properties. The input value should be from the 'Minimum Volume' to th
Nebula Trading Manager
Sina Mohammadamin Shahriari Moghadam
This expert advisor named   TradeManager   provides a manual trading management panel in MetaTrader 5 that allows precise control over open positions. It is designed for traders who want dynamic management of Stop Loss (SL), Take Profit (TP), Break Even (BE), and Partial Close functionality. Key Features: Dynamic Trade Management : Manually set or drag-and-drop SL, TP, and BE levels. Supports partial closing at different profit levels (1:1, 1:1.5, 1:2). Automated Drawing : Automatically draw
How to Use the  Features           MT4 VERSION   TRADE COPIER Select Role: On the account sending trades, choose Sender (Master Account) . On the account receiving trades, choose Copier (Receiver Account) . Lot Size Mode: Same Lot Size as Master: Ignores multipliers, copies exactly what the Master has. Multiply Master Lot Size: Uses the "Lot Multiplier" field (e.g., Master 0.10, Multiplier 2.0 = Copier 0.20). Use Fixed Lot Size: Ignores Master's volume entirely, uses the "Fixed Lot Size" field f
**Forex Trade Manager Pro MT5** **Trade Manager MT5** は、MetaTrader 5向けの包括的なトレード管理ユーティリティです。トレードを計画する瞬間から決済する瞬間まで、ポジションのあらゆる側面を完全にコントロールできます。リスクを真剣に考えるトレーダー、つまり規律を築き始めた初心者から、複数のポジションにわたって瞬時の実行を必要とするプロのスキャルパーまで、幅広く対応できるように設計されています。 このツールは任意のチャートに装着でき、クリーンでコンパクトなパネルを表示します。チャート上に直接、ドラッグ可能な水平線を使用して、意図するエントリー、ストップロス、テイクプロフィットの各レベルをマークします。Trade Managerは、定義されたリスクに基づいて正しいポジションサイズを即座に計算し、ストップロスとテイクプロフィットの値をpipsと口座通貨でリアルタイムに表示し、計画中のトレードのリスク・リワード比率を表示します。手動計算は一切必要ありません。リスクを一度定義すれば、ツールが残りのすべてを処理します。 **ポジ
BTC Master Pro
Farzad Saadatinia
4.58 (12)
BTC Master Pro — 規律あるビットコイントレードのための信頼できるパートナー。 最新バージョンでは OpenAI の人工知能 を統合し、高ボラティリティな暗号資産市場において、より高度な執行判断と取引フィルタリングを実現します。 本プロフェッショナル向けエキスパートアドバイザーは、 MetaTrader 5 上での Bitcoin(BTCUSD) 取引専用に設計されており、構造化された執行ロジック、エクスポージャー管理、そして高度なリスクマネジメントに重点を置いています。 価格: $499  →  次段階: $699  →  最終価格: $999 LIVE SIGNAL HERE OpenAI搭載・執行フィルター 最新バージョンでは OpenAI 技術を活用し、リアルタイムで市場環境を分析し、質の低いエントリーや不利なセットアップをフィルタリングします。 AIセーフティレイヤー: AIモジュールは取引実行前の第二承認レイヤーとして機能します。これは予測ツールではなく、あくまで執行フィルターとして設計されています。すべての取引は構造化ロジックとインテリジェントな検証プ
Copying trading signals from the Telegram channel to MetaTrader. The utility will help you easily and simply   copy transactions from   your Telegram   channel or chat to the MetaTrader trading terminal almost instantly This is a DEMO version, restrictions - minimum lot Operational support in telegram chat: https://t.me/forex4up_chat Template for signals in the Telegram channel, chat (can be changed in the parameters) SYMBOL=EURUSD, TYPE=SELL, PRICE= 0.00000 , LOT= 0.01 , STOPLOSS= 0.00000
FREE
Professional breakout Expert Advisor based on the Average True Range (ATR) indicator. This EA automatically places Buy Stop and Sell Stop orders at a distance of ATR multiplied by a user-defined factor (default 1.5) above the current Ask and below the current Bid. When price breaks out, the pending order triggers, and the opposite pending order is automatically canceled. The ATR adapts to market volatility: during high volatility, the breakout distance increases; during low volatility, it decr
News Dashboard Pro
Beatrice Bernard Mgaya
2 (1)
Certainly! Let me provide descriptions for the News Filter tools available on both MetaTrader 4 (MT4) and MetaTrader 5 (MT5) platforms: News Filter for MT4 : Description : The News Filter for MT4 is an expert advisor (EA) template that allows traders to manage their positions during news events. It downloads news data from investing.com without using any external DLLs (Dynamic Link Libraries). Traders can customize their actions based on news releases. Features : Automatic News Detection : The
Pro Trading Dashboard
Alireza Gholamreza Mohammadi
WHO IS THIS FOR? → Manual traders who want to track performance without leaving MT5 → EA developers who need quick visual feedback on strategy results → Fund managers who want a clean, presentable performance overview → Anyone serious about understanding their trading edge   WHAT MAKES IT DIFFERENT Most trading dashboards show you numbers. This one shows you the
FREE
This tool will perform Trailing stop loss and Break even management for orders. Helps you limit or reduce the time spend watching orders on the screen, especially when you need to go to sleep. Just add this EA to 1 chart, you can manage all pairs. You can filter orders by comment, magic number, symbol and order ticket number. When Breakeven it can add shift/offset pips (to cover the commission...). You can try in strategy tester before purchase. The EA will add Buy and Sell alternately, so you
Smart Manual Trader MT5 is designed for traders who want simplicity, precision, and full control over their trades. It combines: manual trading with a visual panel automatic risk management in real money (Money) optional auto trading mode All inside a clean, intuitive, and professional interface. ️ Control Panel – Full Description The panel displays real-time market data and your trading configuration. Panel Information Symbol Shows the instrument currently traded (e.g., EURUSD, XAUUSD,
Have you missed any tools or shortcuts in Meta Trader? Simple things that would make your daily trading much easier ? We have the solution for you: our Trade Panel! This is an EA tool (Expert Advisor) that, if configured to controll all symbols, needs to be loaded only once. This is the Lite version (free) of our tool. Professional version:   https://www.mql5.com/en/market/product/42658 If you have some problemas with the shortcut buttons on chart on unpinned mode try change the tickets digi
FREE
Simple Trade Utility
Bernard Petrus Le Roux
5 (1)
Simple Trade Utility Join the Group Chat -  Community Group Need an indicator? Check out ZeroLag T3 Signal Suite The Simple Trade Utility is designed to make trading straightforward and efficient , without unnecessary complexity. This tool provides a clean, easy-to-use panel that simplifies the process of placing and managing trades. It focuses on essential functions traders use every day —nothing more, nothing less. Despite its simplicity, it offers powerful features such as: Trailing stop Part
FREE
Hello, This is an easy symbol change panel. This is a full version of Symbol1 2Changer Symbols must be active on your Market Watch list. Parameters: SymbolList - you can add more symbols with a comma(,) ratio - change the size LineNumber - you can set that how many symbols are displayed per line. button_width - modify the button size button_height - modify the button size Thank you.
Smart TP SL Manager Smart portfolio-level TP/SL management with intelligent position distribution Overview Smart TP SL Manager manages take profit and stop loss for your entire portfolio instead of individual trades. Set total TP/SL in USD and let the EA automatically handle all positions with precise, weighted calculations. Key Features Portfolio-level TP/SL in USDReal-time combined P/L monitoring Auto close all positions at target Weighted average SL/TP calculation Auto-update when new posit
FREE
This indicator simplifies your entry zones by displaying the areas where you can plan your entry that potentially could give you high risk/reward ratios. Other than picking the most optimal entry points, the Hot Zone indicator can act as your typical support/resistance indicator for pullbacks for all timeframes. You can use this indicator as the only trading indicator or use it with another indicator for reentry purposes.  Besides, when using Hot Zones, the risk/reward ratio should be well abov
Position Size Calculator FREE Universal Risk Management Tool for MetaTrader 5 Position Size Calculator FREE is a simple and reliable risk management tool designed to help traders calculate the correct lot size based on account balance, risk percentage, and stop loss distance. This tool does not open trades and does not interfere with trading logic . It simply calculates the optimal position size and displays the information directly on the chart in real time. The EA is compatible with Forex, Ind
FREE
Account Monitor Pro — Your Ultimate Trade Statistics Hub Account Monitor Pro is a professional information dashboard designed for traders who combine Expert Advisors (EAs) and manual trading. The indicator separates statistics in real-time based on your Magic Number, allowing you to clearly see who is driving the profit: the algorithm or yourself. Key Features: Split Monitoring: Instant separation of "Robot" positions (by Magic Number) and "Manual" trades. Multi-language Support: 11 languages in
FREE
SL TP Toggle Button
Mariusz Franciszek Szczepanczyk
重要 – これは単独の指標ではありません このツールは、ストップ ロスやテイク プロフィットを独自に管理せず、取引ロジックを独立して実行しません。 これは、One Click B3 MT5 Expert Advisor と組み合わせて動作するように特別に設計されています。 同じシンボルで One Click B3 MT5 が実行されていない場合、このインジケーターはボタンのみを表示し、SL/TP 機能は制御しません。 One Click B3 MT5 を所有または使用していない場合、この製品は取引機能を提供しません。 MT5用SL TPトグルボタン 互換性のあるエキスパートアドバイザーのSL/TPロジックを有効または無効にするチャート上のボタンを提供するユーティリティインジケーターです。このボタンは、INIファイルとグローバル変数を使用して、チャートとセッション間で状態と位置を保存するため、再起動後や複数のチャートで一貫した動作が保証されます。 主な目的 One Click B3 MT5 などの EA (または同じ状態/グローバル変数を読み取る任意の EA) で SL/TP 管
Range Directional Force Indicator – Designed for You to Optimize! The Range Directional Force Indicator is a cutting-edge tool designed to empower traders by visualizing market dynamics and directional strength. Built to offer insights into market trends and reversals, this indicator is an invaluable asset for traders seeking precision in their strategies. However, it is important to note that this indicator is not optimized, leaving room for you to tailor it to your unique trading preferences.
RISK CALCULATOR - TRADING PANEL - CHART OVERLAY with:   PARTIAL TAKE PROFIT  ("virtual TP")   % RISK LOT SIZE  TRAILING STOP LOSS  Fast and simple control of your trades Easy lot size calculation with easy SL/TP setting. Your trading will be much more comfortable with this tool!   Works like any EA, add it to selected chart and trade ! (this version is converted from MT4) Features: start trade with   calculated lot   based on   % of account balance * that you want to risk/ or based on
SPEKULATORは、重要なサポートゾーンと市場の方向性を特定するのに役立つ手動取引システムおよびインジケーターです。 シンプルな戦略と隠れた知恵で市場をマスターしましょう。 グラフ上で任意のトップ(TOP)とボトム(BOTTOM)を選択すると、インジケーターは次のように描画します: あなたのトレンドに対するサポートゾーン。 強気トレンドの場合、緑色のゾーンが表示され、弱気トレンドの場合、赤色のゾーンが表示されます。サポートゾーンの感度はインジケーターの設定で調整可能です。このゾーンは、選択したトレンドに基づいてサポートが現れる可能性のある場所を示します。 高い偏差線と低い偏差線 W.D. ガンの9のスクエアに基づいて計算された角度線 取引に入るタイミング: 高い偏差線を上に突破した場合、ロングポジションを取ります。 低い偏差線を下に突破した場合、ショートポジションを取ります。 市場が偏差線の間にある場合、その間で買いと売りを行いながら、サポートゾーンを尊重します。 ガンの角度線は利益確定ゾーンとしてガイドラインとして使用されます。 360度線が重要なレベルです: 価格がその上にある
Description Manzano Risk Manager Pro is a risk management tool for MetaTrader 5 designed to monitor open positions and execute automatic or manual closures when user-defined conditions are reached. Its purpose is to help maintain control over account risk and reduce execution errors during trading. The product does not open trades or modify any trading strategy. Main Features Automatic position closing The system allows you to define profit and loss limits and automatically close positions when
FULL AUTO RISK MANAGEMENT EA – PRO + ACCOUNTING is an advanced Expert Advisor designed to protect your trading capital through fully automated risk control. Key Features: Progressive Stop Loss adjustment Partial position close at predefined loss levels (50% / 70%) Automatic Break Even at 50% Take Profit Profit Lock system at 50% and 70% of Take Profit Smart accounting of initial risk and saved capital Works with any trading strategy (manual or automated) No entry signals – risk management only T
️ Trade Manager oneclick  ( Reverse Trade,  Partial Close,  Breakeven, Close All Running Trade )   control – Smart Manual Trade Control for MT5 Trade Manager oneclick control is a powerful yet lightweight trade management utility built for manual traders who want precise control over their open positions — directly from the MT5 chart. This EA does not open or close trades automatically based on any strategy. It simply provides one-click management tools to handle your running trades efficient
FREE
Rsi Cloud PullBack
Sylvestre Setufa Djagbavi
Do you want trading robots? Read this: Before investing in a trading robot, take a moment to understand what it entails. Trading is a game of probabilities. No one can guarantee a profit on every trade or every month. What truly matters is long-term profitability.  If you can't accept that, there's no point in buying my robot. Go find another job.  Don’t buy a robot based solely on its price or popularity on a platform. An expensive bot isn’t necessarily profitable.  Even with a profitable robot
SmartTrend Analyzer   is a reliable non-repainting indicator that will interest any trader. SmartTrend Analyzer is a tool that analyzes all five aspects (opening price, high, low, closing price, and volume) based on mathematical calculations. With the algorithm of the forex indicator SmartTrend Analyzer, you can quickly determine which trend is developing in the market at the moment. The SmartTrend Analyzer technical indicator is presented on the chart as a set of points for easy interpretatio
SPECIAL LAUNCH OFFER: $30 (1-Month Rent) Limited time offer to build our community and gather feedback! AmbM GOLD Institutional Scalper A high-precision M5 algorithm for XAUUSD (Gold) , engineered to trade exclusively at Institutional Liquidity Levels ($5/$10 psychological marks). PERFORMANCE DATA (BUY ONLY) • Win Rate: 87.09%. • Safe Growth: +$4,113 profit on $10k (13.75% Max Drawdown). • Extreme Stress Test: Successfully generated +$22,997 in a 5-year stress test (2020-2026), proving
Working with pending orders Buy Stop and Sell Stop. A channel of two indicators iMA (Moving Average, MA). Input parameters Take Profit   - Take Profit; Trailing Stop   - trailing; Trailing Step   - trailing step; Lots   - lot size is set manually (a NECESSARY CONDITION:   Risk   must be equal to zero!); Risk   - lot size is calculated automatically, in risk percents per trade (a NECESSARY CONDITION: "Lots" must be equal to zero!); Difference   - offsets from the channel borders; Expert Every Ti
FREE
このプロダクトを購入した人は以下も購入しています
ARIPoint is a powerful trading companion designed to generate high-probability entry signals with dynamic TP/SL/DP levels based on volatility. Built-in performance tracking shows win/loss stats, PP1/PP2 hits, and success rates all updated live. Key Features: Buy/Sell signals with adaptive volatility bands Real-time TP/SL/DP levels based on ATR Built-in MA Filter with optional ATR/StdDev volatility Performance stats panel (Success, Profit/Loss, PP1/PP2) Alerts via popup, sound, push, or email Cu
SignalTech MT5 is a trading system for EURUSD, USDCHF, USDJPY, AUDUSD, NZDUSD, EURJPY, AUDJPY, NZDJPY, CADJPY H2 and H3 Timeframe.  All the winning trades with chart setups are published on the comments page. 2025-12 1174 Pips 2026-01 2624 Pips 2026-02 2937 Pips 2026-03 2165 Pips 2026-04 2243 Pips It can generate signals with Buy/Sell Arrows and Pop-Up/Sound Alerts. Each signal has clear Entry and Stop Loss levels, which should be automatically flagged on the chart, as well as potential Targets
Azimuth Pro
Ottaviano De Cicco
5 (7)
Azimuth Pro V2:MT5向けシンセティック・フラクタル構造分析と確認済みエントリー 概要 Azimuth Pro は Merkava Labs によるマルチレベルスイング構造インジケーターです。4つのネストされたスイングレイヤー、スイングアンカーVWAP、ABCパターン検出、3タイムフレーム構造フィルタリング、そして確定バーでの確認済みエントリー — 1つのチャートで、ミクロスイングからマクロサイクルまでを網羅するワークフロー。 これはブラインドシグナル製品ではありません。ロケーション、コンテキスト、タイミングを重視するトレーダーのための構造ファーストワークフローです。 V2発売記念オファー — Azimuth Pro V2をUSD 399で(次の100本)。最終価格:USD 499。 1. V2での変更点 シンセティック・マルチタイムフレームエンジン 上位タイムフレーム分析をMeridian Proと同じ独自のシンセティックアーキテクチャで一から再構築。よりクリーンなHTFコンテキスト、安定したライブ動作、従来のMTF同期問題なし。シンセティックエンジンは 固定比率タ
まず第一に、この取引ツールはノンリペイント、ノンリドロー、ノンラグの指標であり、プロの取引に理想的ですことを強調する価値があります。 オンラインコース、ユーザーマニュアル、デモ。 スマートプライスアクションコンセプトインジケーターは、新米から経験豊富なトレーダーまで、非常 に強力なツールです。Inner Circle Trader AnalysisやSmart Money Concepts Trading Strategiesなど、20以上の有用な指標を1つに組み合わせています。このインジケーターはスマートマネーコンセプトに焦点を当て、大手機関の取引方法を提供し、彼らの動きを予測するのに役立ちます。 特に、流動性分析に優れており、機関がどのように取引しているかを理解しやすくしています。市場のトレンドを予測し、価格の動きを慎重に分析するのに優れています。機関の戦略とトレードを合わせることで、市場の動向についてより正確な予測ができます。このインジケーターは多目的であり、市場構造を分析し、重要な注文ブロックを特定し、さまざまなパターンを認識するのに優れています。 このインジケーター
OmniSync Projection
Antonio-alin Teculescu
5 (1)
Chronos Fractal Engine is an innovative price projection indicator for MetaTrader 5, designed to transform your technical analysis by intelligently identifying and projecting historical price patterns. Built upon an advanced correlation algorithm and the fractal principles of the market, this powerful tool visualizes potential future price movements, giving you a unique edge in your trading decisions. What is Chronos Fractal Engine? At its core, the Chronos Fractal Engine employs a sophisticat
RelicusRoad Pro: 定量的市場オペレーティングシステム 【期間限定】無制限アクセス 70% OFF - 2,000人超のトレーダーと共に なぜ多くのトレーダーは「完璧な」インジケーターを使っても失敗するのでしょうか? それは、文脈を無視して 単一の概念 だけでトレードしているからです。文脈のないシグナルは単なるギャンブルです。勝ち続けるには、 根拠の重なり(コンフルエンス) が必要です。 RelicusRoad Proは単なる矢印インジケーターではありません。完全な 定量的市場エコシステム です。独自のボラティリティモデリングを用いて、価格が推移する「適正価値の道(Fair Value Road)」をマッピングし、ノイズと真の構造的ブレイクを判別します。 推測はやめましょう。機関投資家レベルの「ロード・ロジック」でトレードを。 コアエンジン:「Road」アルゴリズム システムの中心となる Road Algo は、市場環境にリアルタイムで適応するダイナミックなボラティリティチャネルです。 安全ライン(平衡点) と、価格が数学的に反転しやすい 拡張レベル を投影します。 Si
多くの矢印インジケーターは、シグナルだけを表示して、その後の判断をすべてトレーダーに任せてしまいます。KT Alpha Hunter Arrows は、完整なトレードプランをチャート上に提示します。 各シグナル矢印が表示されるたびに、エントリーライン、ストップロス、4つのテイクプロフィット水準、そして現在の銘柄と時間足が今トレードに値するかどうかを示すリアルタイムのエッジ判定が、すでに描画された状態で表示されます。付属の Trade Manager EA は、あなたが手動でエントリーした後の実行管理を担当し、相場が荒れて判断がぶれやすい場面でも規律あるトレードを保ちやすくします。リペイントなし。確定足シグナルのみ。Forex、ゴールド、指数、その他あなたが取引するあらゆる銘柄に対応します。 主な機能 リペイントしない買い矢印と売り矢印を、足の確定後にのみ表示。 各シグナルに、エントリーライン、構造的ストップロス、4つのテイクプロフィット水準を表示。 Edge Dashboard が、現在のチャートで買いセットアップと売りセットアップを別々に評価。 判定システム:No Edge、Mar
ARICoin is a powerful trading companion designed to generate high-probability entry signals with dynamic TP/SL/DP levels based on volatility. Built-in performance tracking shows win/loss stats, PP1/PP2 hits, and success rates all updated live. Key Features: Buy/Sell signals with adaptive volatility bands Real-time TP/SL/DP levels based on ATR Built-in MA Filter with optional ATR/StdDev volatility Performance stats panel (Success, Profit/Loss, PP1/PP2) Alerts via popup, sound, push, or email Cust
Bill Williams Advanced is designed for automatic chart analysis using Bill Williams' "Profitunity" system. The indicator analyzes four timeframes at once. Manual (Be sure to read before purchasing) Advantages 1. Analyzes the chart using Bill Williams' "Profitunity" system. Signals are displayed in a table in the corner of the screen and on the price chart. 2. Finds all known AO and AC signals, as well as zone signals. Equipped with a trend filter based on the Alligator. 3. Finds "Divergence Bar
マーケットメーカーのためのツール。 Meravith は次の機能を提供します: すべての時間足を分析し、現在有効なトレンドを表示します。 強気と弱気の出来高が等しくなる流動性ゾーン(出来高均衡)を強調表示します。 異なる時間足のすべての流動性レベルをチャート上に直接表示します。 テキスト形式の市場分析を生成し、参考情報として表示します。 現在のトレンドに基づいて目標値、サポートレベル、ストップロスを計算します。 取引のリスクリワード比を算出します。 口座残高に基づいてポジションサイズを計算し、潜在的な利益を推定します。 また、市場に大きな変化があった場合には警告を表示します。 インジケーターの主要ライン: 強気/弱気の出来高エグゾーストライン ― 目標値として機能します。 市場のトレンドを示すライン。市場が強気か弱気かによって色が変わり、トレンドのサポートとして機能します。主にその色が市場センチメントを示します。 出来高均衡ライン(Eq)。Eq(Volume Equilibrium)ラインはシステムの中核です。これは買い手と売り手の出来高のバランスポイントを表します。市場の流動性を示し
Fusion Monthly Levels + PinBar + Marubozu 説明 このユニークなインジケーターは、3つの強力なテクニカル分析ツールを1つに統合しています: 月間レベル(High, Low, Open, Close) – 重要なサポート・レジスタンスゾーンを特定するため。 PinBar 検出 – 信頼性の高い反転ローソク足パターンで、価格の反発を示します。 Marubozu 検出 – 強いトレンドローソク足で、方向性のあるモメンタムを示します。 この融合により、 視覚的で包括的、かつ反応の速い 市場予測ツールを手に入れることができます。 利点 機関レベルの価格帯 + プライスアクションを組み合わせ。 明確な視覚シグナル:PinBar は青/赤の矢印、Marubozu は青/赤の四角で表示。 全ての資産で使用可能(FX、指数、暗号通貨、コモディティ、株式)。 カスタマイズ可能なパラメーター(参照期間、ヒゲのサイズ、矢印のスタイル)。 コード最適化済み、複数チャートでも遅延なし。 MetaTrader 5 完全対応。 シグナル ブルッシュ PinB
Berma Bands
Muhammad Elbermawi
5 (8)
Berma Bands (BBs) インジケーターは、市場のトレンドを特定して活用したいトレーダーにとって貴重なツールです。価格と BBs の関係を分析することで、トレーダーは市場がトレンド段階にあるか、レンジ段階にあるかを判断できます。 詳細については、[ Berma Home Blog ] をご覧ください。 バーマ バンドは、上部バーマ バンド、中部バーマ バンド、下部バーマ バンドの 3 つの異なる線で構成されています。これらの線は価格の周りにプロットされ、全体的な傾向に対する価格の動きを視覚的に表します。これらのバンド間の距離から、ボラティリティや潜在的な傾向の反転についての洞察を得ることができます。 バーマ バンドの線がそれぞれ離れると、市場が横ばいまたはレンジ相場の期間に入っていることを示すことがよくあります。これは、明確な方向性の偏りがないことを示しています。トレーダーは、これらの期間中にトレンドを特定するのが難しいと感じる可能性があり、より明確なトレンドが出現するまで待つ場合があります。 バーマ バンドの線が 1 本の線に収束すると、強いトレンド環境の兆候となること
CGE Trading Suite
Carl Gustav Johan Ekstrom
5 (2)
Institutional-Grade Analytics for MT5 C GE Trading Suite delivers the analytical edge typically reserved for professional trading desks. The platform integrates a full suite of analytical tools into one seamless workflow: dynamic grid mapping, liquidity behavior analysis, ECM, trend lines, MIDAS, trade cycles, and directional channel projections. Together, these provide a unified view of market structure and momentum. Directional clarity is further enhanced by the capital flow index, which meas
AriX
Temirlan Kdyrkhan
1 (4)
AriX Indicator for MT5 A powerful trend-following and signal-evaluation tool AriX is a custom MT5 indicator that combines Moving Averages and ATR-based risk/reward logic to generate clear buy/sell signals. It visualizes dynamic SL/TP levels, evaluates past trade outcomes, and displays win/loss statistics in a clean on-chart panel. Key features include: Buy/Sell signals based on MA crossovers ATR-based SL/TP1/TP2/TP3 levels with visual lines and labels Signal outcome tracking with real-time stat
The Propfolio Master Suite is the ultimate all-in-one analytical workstation for professional traders. Combining the power of the Beat The Market Maker (BTMM) methodology, Smart Money Concepts (SND/Liquidity), and Advanced Volume Profile, this suite replaces a dozen different indicators with one heavily optimized, beautifully designed engine. Monitor up to 14 pairs simultaneously from a single chart, instantly identify market cycles, and seamlessly map institutional footprints with the click of
「 Dynamic Scalper System MT5 」インジケーターは、トレンド波の中でスキャルピング取引を行う手法のために設計されています。 主要通貨ペアと金でテスト済みで、他の取引商品との互換性があります。 トレンドに沿った短期的なポジションオープンのシグナルを提供し、追加の価格変動サポートも提供します。 インジケーターの原理 大きな矢印はトレンドの方向を決定します。 トレンド波の中では、小さな矢印の形でスキャルピングシグナルを生成するアルゴリズムが機能します。 赤い矢印は強気方向、青い矢印は弱気方向です。 トレンドの方向には敏感な価格変動ラインが描かれ、小さな矢印のシグナルと連動します。 シグナルは次のように機能します。適切なタイミングでラインが現れるとエントリーシグナルが形成され、ラインが開いている間はポジションが保持され、完了すると取引が終了します。 推奨される動作時間枠はM1~H4です。 矢印は現在のローソク足に形成され、次のローソク足が開いている場合は、前のローソク足の矢印は再描画されません。 入力パラメータ Trend Wave Period - トレ
Ziva LSE System
Hassan Abdullah Hassan Al Balushi
ZIVA LSE System A Professional Liquidity & Structure Execution Framework Executive Overview ZIVA LSE System is a professionally engineered analytical framework designed to interpret market behavior through structural logic and liquidity dynamics. It is not positioned as a conventional indicator. Rather, it functions as a structured execution environment that organizes price action into a clear, disciplined decision-making model. The system is built to deliver consistency, clarity, and controlled
Gannスクエアインジケーターは、W.D. Gannによって執筆された「市場予測のための数学的な式」の記事に基づく強力な市場分析ツールです。このツールは、解析に数学的な概念を応用し、Gann理論に基づいています。それは、144、90、52のスクエアや9のスクエアなど、Gannの関連テクニックの要素を取り入れています。さらに、の方法を組み込んでおり、9のスクエアとその関連性についてのチャネルやスターパターンに焦点を当てています。 ユーザーマニュアルと使用方法: このインジケーターを使用する前に、ユーザーマニュアルを読んで疑問点を解決するためにお問い合わせいただくことをお勧めします。ユーザーマニュアルの完全版は、当社のウェブサイトで入手できます。 MT5の完全版は購入できますし、MT4の無料版も試すことができます。両方のバージョンへのリンクを提供していますので、ご利用ください。 主な機能と機能: Gannスクエアインジケーターは、市場分析のための完全なツールセットを提供し、幾何学的な概念とGann理論に基づいて的確な判断を行う手助けをします。以下に主な機能を示します。 9のスクエアの分析:
Cvd Divergence
Thalles Nascimento De Carvalho
CVD Divergence ― オーダーフローとダイバージェンスのプロフェッショナル分析 CVD Divergence は、価格と Cumulative Delta Volume(CVD)との間に発生する信頼性の高いダイバージェンスを検出するために開発されたテクニカル指標です。実際の注文フローが価格の動きを確認していない局面を正確に捉え、反転、勢いの減衰、そして機関投資家による操作の可能性を示します。 このインジケーターは、アグレッシブボリュームの読み取りと価格構造の分析を組み合わせ、明確で客観的かつ先行性のあるシグナルを提供します。 インジケーターの機能 CVD Divergence は、累積デルタボリュームを用いて注文フローの方向と価格の方向を比較します。両者が大きく乖離した際、チャート上にマーカーを表示し、ダイバージェンスの方向を視覚的に示します。 検出できる内容: 強気ダイバージェンス(価格が下落しているが CVD が上昇している場合) 弱気ダイバージェンス(価格が上昇しているが CVD が下降している場合) 買い手・売り手の勢いの枯渇 機関投資家の不均衡によるフェイクムーブ
TPA True Price Action indicator reveals the true price action of the market makers through 100% non-repainting signals strictly at the close of a candle! TPA shows entries and re-entries, every time the bulls are definitely stronger than the bears and vice versa. Not to confuse with red/green candles. The shift of power gets confirmed at the earliest stage and is ONE exit strategy of several. There are available now two free parts of the TPA User Guide for our customers. The first "The Basics"
構造化された視点で市場を分析 OmniView ICT ダッシュボードは、複数の銘柄を1つのインターフェースで監視するために設計されたマルチシンボル市場スキャナーです。 複数のチャートを切り替える代わりに、本パネルはMarket Watch内の銘柄をスキャンし、現在の市場状況を構造的に表示します。 概要 複数銘柄を同時にスキャン 定義された条件に基づいたランキング表示 ワンクリックでチャート同期 市場分析の整理をサポート スコアリングシステム 各セットアップは、価格構造、モメンタム、流動性の動きに基づく内部条件によって評価されます。 85% – 100% → 複数条件の強い一致 70% – 84% → 明確な方向性と確認 60% – 69% → 有効な構造(追加確認が必要な場合あり) 60%未満 → 条件は形成中 このスコアは、異なる市場状況の比較を目的としています。 分析モデル 本パネルは、Smart Money手法に基づく以下の概念を用いて市場データを処理します。 市場構造の変化 フェアバリューギャップ(Fair Value Gaps) 流動性のスイープ プレミアムゾーンとディス
Footprint は、オーダーフロー(Order Flow)と出来高分析のためのインジケーターです。 クラスターレベルでの市場構造の特定、アクティビティの高い主要ゾーンの発見、そして設定ウィンドウを毎回開くことなくチャート上で直接フィルター操作を行うのに役立ちます。 Footprintインジケーターの機能 Bid x Ask、Deltaのクラスターチャート; チャート上のコントロールパネル; フィルター調整用のスライダー; Absorption; Initiative; Stacked Imbalances; Big Trades; dPOC / Dynamic Point of Control; Delta; サイドマーケットプロファイル; 累積デルタ(Cumulative Delta)。 主な利点 高密度のティックフローに対する高速な計算とデータ表示; チャート内管理 — 設定を開くことなく、主要モードとフィルターを直接切り替え可能; 重要な価格レベルとクラスターを強調するためのフィルタリング; シグナルの視覚的ハイライト:吸収、主導権、インバランス、大口取引; 日、週、または現
Presenting one-of-a-kind Gann Indicator for XAUUSD IQ Gold Gann Levels is a non-repainting, precision tool designed exclusively for XAUUSD/Gold intraday trading. It uses W.D. Gann’s square root method to plot real-time support and resistance levels, helping traders spot high-probability entries with confidence and clarity. William Delbert Gann (W.D. Gann) was an exceptional market analyst whose trading technique was based on a complex blend of mathematics, geometry, astrology, and ancient calcul
Kalman Adaptive Zones — 量的確率バンド 価格がどこへ向かうのかを推測するのはやめましょう。統計的に「どこにあるべきか」を理解しましょう。 Kalman Adaptive Zones(KAZ)は、価格の周囲にインテリジェントな確率バンドを描画するプロフェッショナルな量的インジケーターです。これらのバンドは市場環境に応じてリアルタイムで自動適応します。 Bollinger Bands や Keltner Channels のような固定された過去期間に依存する指標とは異なり、KAZは複数層の量的分析を組み合わせ、現在の市場の状態をより正確に反映するバンドを生成します。 仕組み KAZの中核は適応型フィルターであり、ノイズを除去しながらも実際の価格変動には敏感に反応しつつ、真の基礎価格を継続的に推定します。 この中心線の周囲に、確率ゾーンが構築されます。その幅は2つの要因によって同時に決定されます: 市場の不確実性 :フィルターの信頼区間が広いほどゾーンは拡大 レジームの不安定性 :単なるボラティリティではなく、その変化自体の大きさ その結果、市場とともに「呼吸する」バ
Elliott Wave Trend was designed for the scientific wave counting. This tool focuses to get rid of the vagueness of the classic Elliott Wave Counting using the guideline from the template and pattern approach. In doing so, firstly Elliott Wave Trend offers the template for your wave counting. Secondly, it offers Wave Structural Score to assist to identify accurate wave formation. It offers both impulse wave Structural Score and corrective wave Structure Score. Structural Score is the rating to sh
A tool for on-chart strategy backtesting and performance analysis. A utility for developing, debugging, and testing custom trading ideas and indicator functions. An indicator designed to quickly test trading concepts and visualize the effectiveness of different input parameters. An all-in-one sandbox for testing everything from simple crossovers to complex, multi-condition trading systems.
このインジケーターは、市場で 関心が示されたゾーン をハイライトし、その後に 注文の蓄積ゾーン を表示します。 これは、大規模な**板情報(オーダーブック)**のように機能します。 これは、 巨大な資金 のためのインジケーターです。その性能は卓越しています。 市場にどんな関心が存在していても、 必ず目に見えるようになります 。 (これは 完全に再設計され、自動化されたバージョン です。もはや手動分析は必要ありません。) トランザクションスピード(取引速度) は新しい概念のインジケーターで、市場で大口注文が どこに・いつ 集中しているかを示し、それに基づいたチャンスを提供します。 トレンドの変化を 非常に早い段階 で察知することができます。 FXでは「出来高」と呼ばれているものは誤解されています。実際には、これは 時間あたりの価格変動量 です。したがって、正しい名称は トランザクションスピード です。 考え方・行動・分析の仕方すべてが問われます。 分析パラダイムの転換は非常に重要です。 このインジケーターは、FXにおける出来高の考え方を 根本から再定義 し、論理的な形で正確に活用する、
note: this indicator is for METATRADER4, if you want the version for METATRADER5 this is the link:  https://www.mql5.com/it/market/product/108106 TRENDMAESTRO ver 2.5 TRENDMAESTRO recognizes a new TREND from the start, he never makes mistakes. The certainty of identifying a new TREND is priceless. DESCRIPTION TRENDMAESTRO identifies a new TREND in the bud, this indicator examines the volatility, volumes and momentum to identify the moment in which there is an explosion of one or more of these da
IVISTscalp5
Vadym Zhukovskyi
5 (6)
iVISTscalp5 — 時間ベースの市場予測システム iVISTscalp5は一般的なインジケーターではありません。 MetaTrader 5向けの時間ベースの予測システムであり、 市場がいつ動く可能性が高いかを特定します。 ⸻ 特徴  • 正確なタイミング  • BUY / SELL予測  • 平均利益の可能性  • 週間予測  • 120以上の金融商品 ⸻ コンセプト 市場は価格だけでなく時間によっても動く ⸻ iVISTscalp5 — 時間による優位性 iVISTscalp5インジケーターをご紹介します。このインジケーターは、トレーディングにおいて独自でありながら効果的です。時間データに基づくこのインジケーターは、多年にわたる経験と金融市場の深い分析の結果です。iVISTscalp5インジケーターは、手動トレーディングにとって優れたツールです。便利さ、簡単さ、可視化 - すべての複雑さが内部に隠されています。私たちは、iVISTscalp5インジケーターの設定と使用を最大限に簡素化しました。このインジケーターは、MT5ターミナルにあるすべての金融商品
プレミアムレベルは、正しい予測の精度が80%を超える独自の指標です。 この指標は、最高のトレーディングスペシャリストによって2か月以上テストされています。 あなたが他のどこにも見つけられない作者の指標! スクリーンショットから、このツールの正確さを自分で確認できます。 1は、1キャンドルの有効期限を持つバイナリーオプションの取引に最適です。 2はすべての通貨ペア、株式、商品、暗号通貨で機能します 手順: 赤い矢印が表示されたらすぐにダウントレードを開き、青い矢印が表示されたら閉じます。青い矢印の後に開くこともできます。 試してテストしてください!推奨設定はデフォルトです! 日足チャートで最高の精度を示します! インディケータは、2600 Pipsの収益性に対して、約10Pipsという非常に小さなマージンを使用します。
作者のその他のプロダクト
Tired of losing money? Neuro_Inverted_Panel_EA is your solution — the ultimate manual trading panel for those ready to embrace inverted psychology! Simply attach the EA to your chart, set the maximum daily loss you're willing to accept (for smart risk control), and trade as you normally would — but without watching your "Toolbox" for open trades . This panel turns your typical losing habits into a winning strategy by flipping your decisions upside down — literally. Once attached, the panel displ
ARTIFICIAL INTELLIGENCE INVESTMENT TOOL. ATTACH TO THE CHART, LEAVE AND FORGET. VPS HIGHLY RECOMMENDED-INVESTMENT SYSTEM. (MQL5 VPS) RR_EA is an investment-grade swing trading EA with a built-in Artificial Intelligence decision engine. It has been specifically engineered to trade the US30(Dow Jones) and NASDAQ-100 index market. The internal AI trading logic is fully automated — no manual intervention is required after setup. The only input from the user is the lot size they wish to trade (based
Inverted_Chart_EA Utility Expert Advisor Inverted_Chart_EA creates and maintains a mirror-inverted chart of any symbol and timeframe. It automatically generates a custom instrument (e.g. US30_INV ) and keeps its price history updated in real time, with bars mirrored around a chosen pivot. This utility gives traders a new way to analyze the market from a different perspective by flipping the chart upside down. Why use an inverted chart? Highlight hidden patterns – price formations that look ordin
Volume at Price (VAP) VAP is a right-anchored Volume Profile Heatmap for MetaTrader 5 designed for clean, fast, and stable execution on any chart. It shows where trading activity clustered, not just when—so you can read balance/imbalance, spot value migration, and plan trades with precise references: VAH, VAL, and POC . What VAP shows Heatmap Profile (tick-volume): A compact, right-anchored histogram that scales with the chart. Value Area (~70%) in Gold Non-Value in White Soft shadow gradient
Pivot_Point_Weekly — clear, uncluttered weekly pivots for MT5 Pivot_Point_Weekly plots one thing and does it exceptionally well: the classic weekly pivot (P) calculated from the previous week’s high, low, and close. It renders each week’s pivot as a clean horizontal “step,” with short, perfectly vertical joins from week to week so you can see the regime shifts at a glance—without cluttering your chart with a forest of levels. This indicator is intentionally minimalist: no S1/R1 ladders, no fib v
フィルタ:
220072256
4761
220072256 2025.08.18 19:19 
 

This is a special indicator for scalpers and conservative traders!

All parameters are adjustable, making it a formidable reference point in manual trading.

Congratulations to the author for his commitment to perfecting this formidable tool.

Update 20 August 2025

Excellent upgrade!!!

Samuele Borella
1364
開発者からの返信 Samuele Borella 2025.08.19 07:19
Much appreciated, Andrew—thank you for your kind words. Indeed Market Profile Heatmap (POC/VAH/VAL) is a powerful tool, if not the most powerful, widely used by institutions, banks, and professional traders. Market Profile is an intraday charting technique—price on the vertical axis and time/activity on the horizontal—devised by J. Peter Steidlmayer at the Chicago Board of Trade, to evaluate how value develops during the trading session. It is basically all what a trader needs to be successful/profitable.
レビューに返信