Percent R Trend Exhaustion MT5

Overview

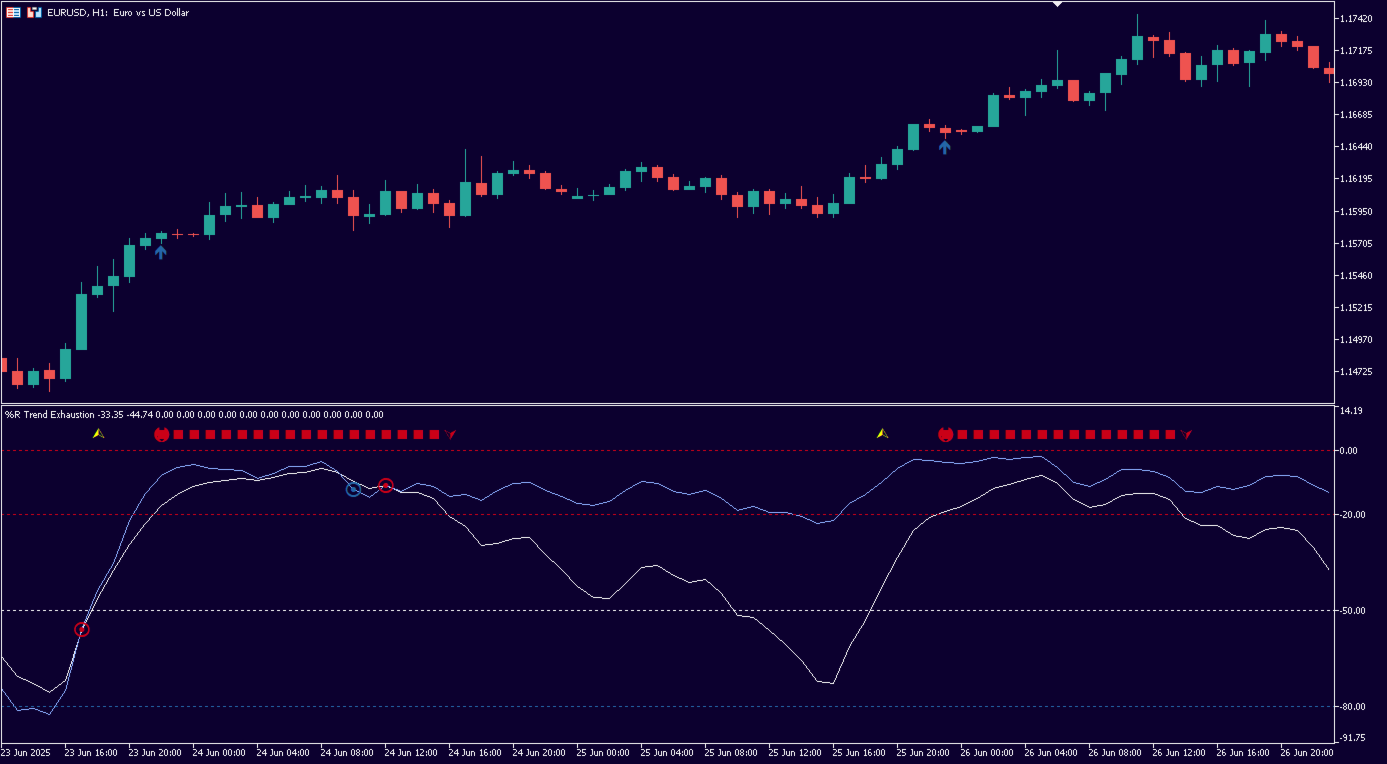
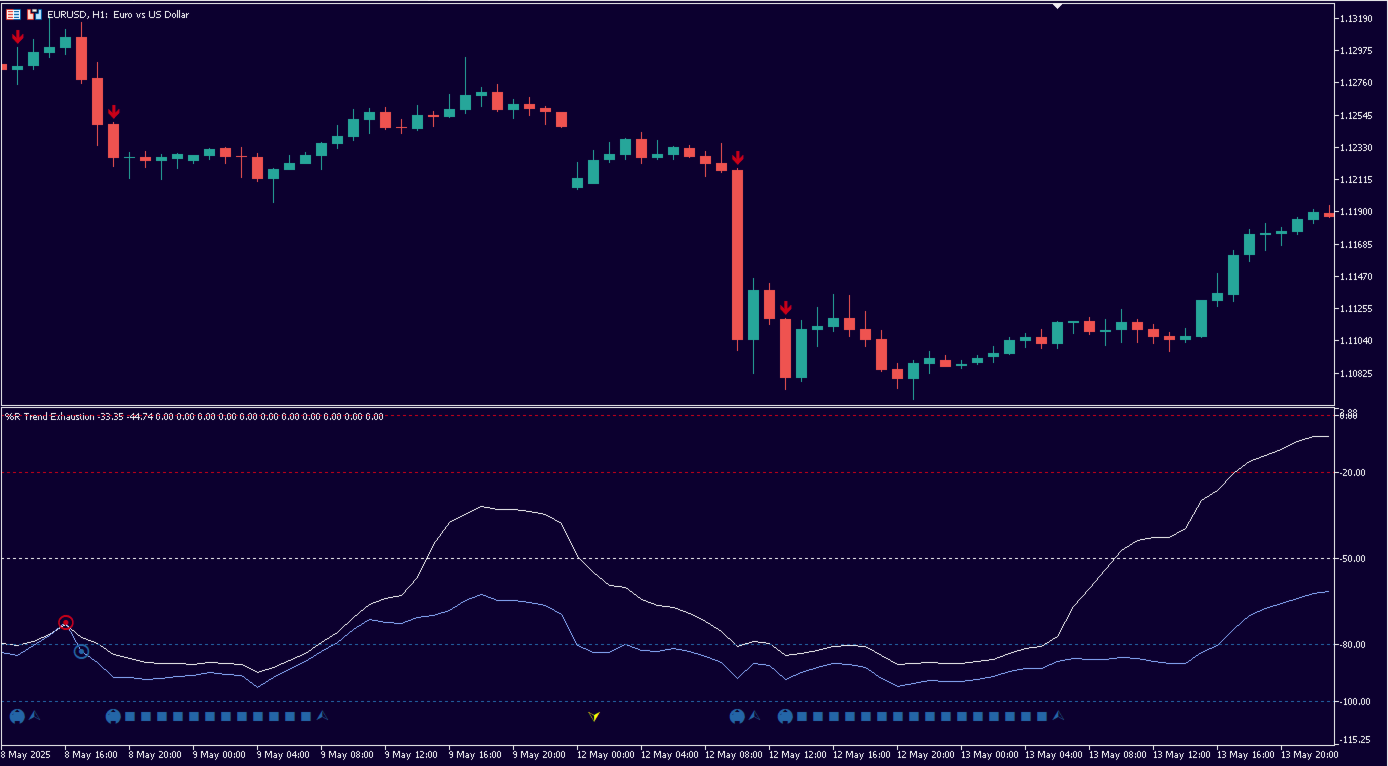
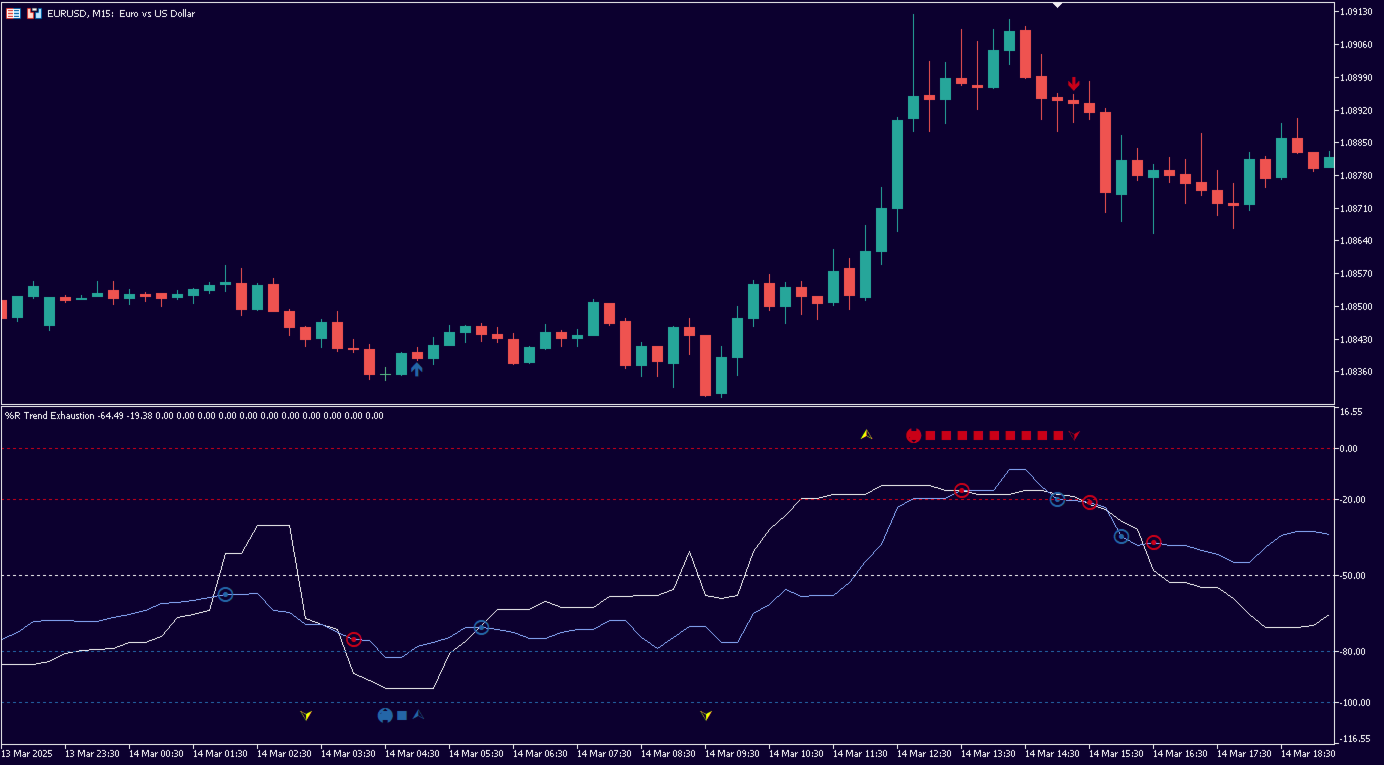
The %R Trend Exhaustion Indicator is a versatile technical analysis tool for MetaTrader 5, adapted from a popular TradingView indicator. It is designed to help traders identify trend exhaustion points, potential reversals, and trend continuation signals across various market conditions. The indicator offers multiple display modes and customizable settings to suit different trading strategies, enhanced with additional features to improve its functionality in the MetaTrader 5 environment.

Improvements:

  • Shading removed.
  • HighLow smoothing mode fixed.
  • Momentum smoothing mode fixed.
  • PercentRank smoothing mode fixed.
  • Fixed a bug where signals from the selected strategy were not displayed on the chart.

Key Features

  • Trend Exhaustion Detection: Identifies overbought and oversold conditions using a dual-signal approach based on fast and slow lookback periods.
  • Multiple Display Modes: Supports Oscillator, Overlay, and Candle modes for flexible chart visualization.
  • Customizable Smoothing: Offers a variety of smoothing methods, including SMA, EMA, HMA, WMA, VWMA, and more, to refine signal accuracy.
  • Strategy Options: Includes six built-in strategies for trend following, reversals, and crossover signals, adaptable to various trading styles.
  • Alert System: Provides configurable alerts for trend starts, reversals, crossovers, and trading signals to keep traders informed.
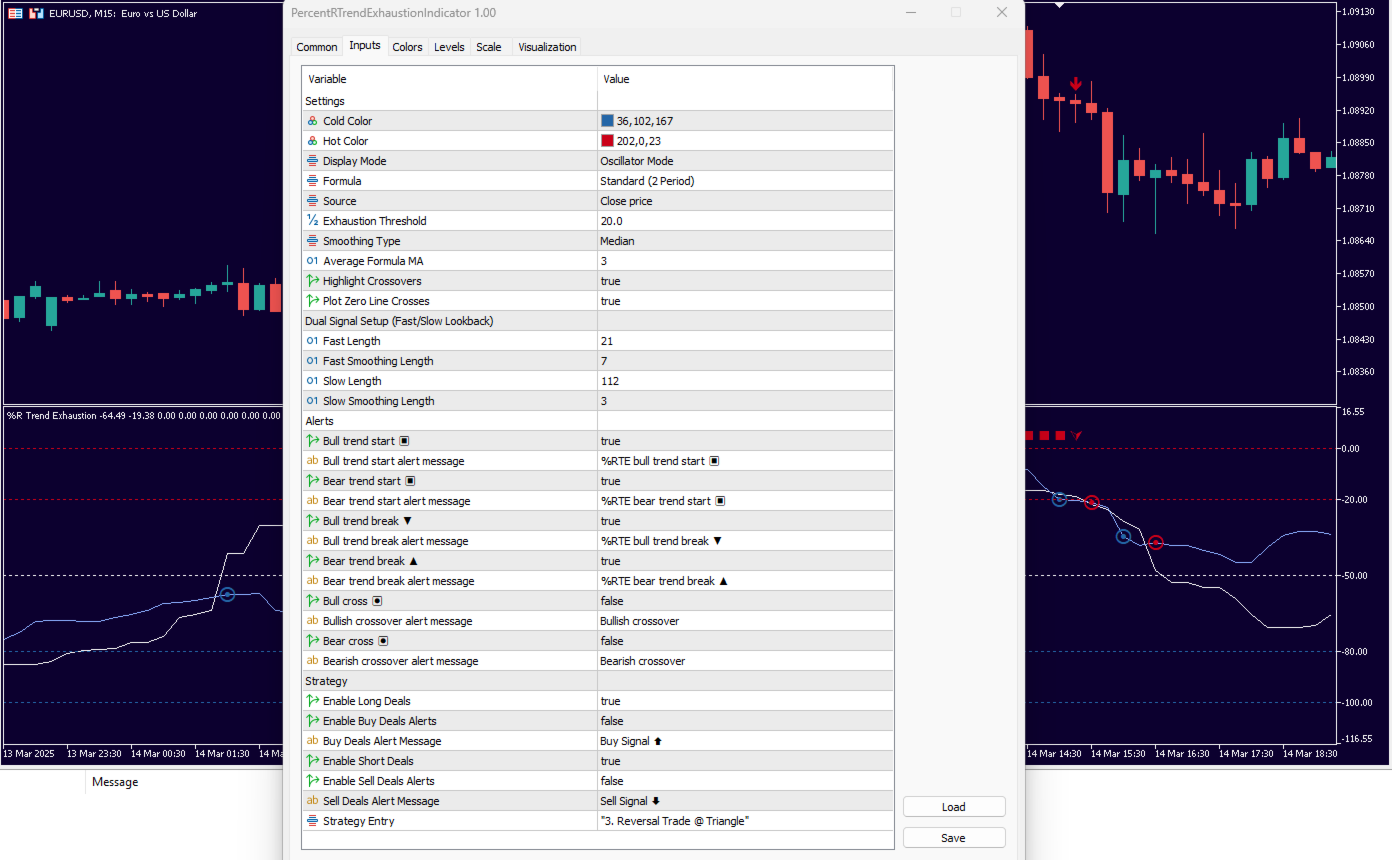
Input Parameters

Settings

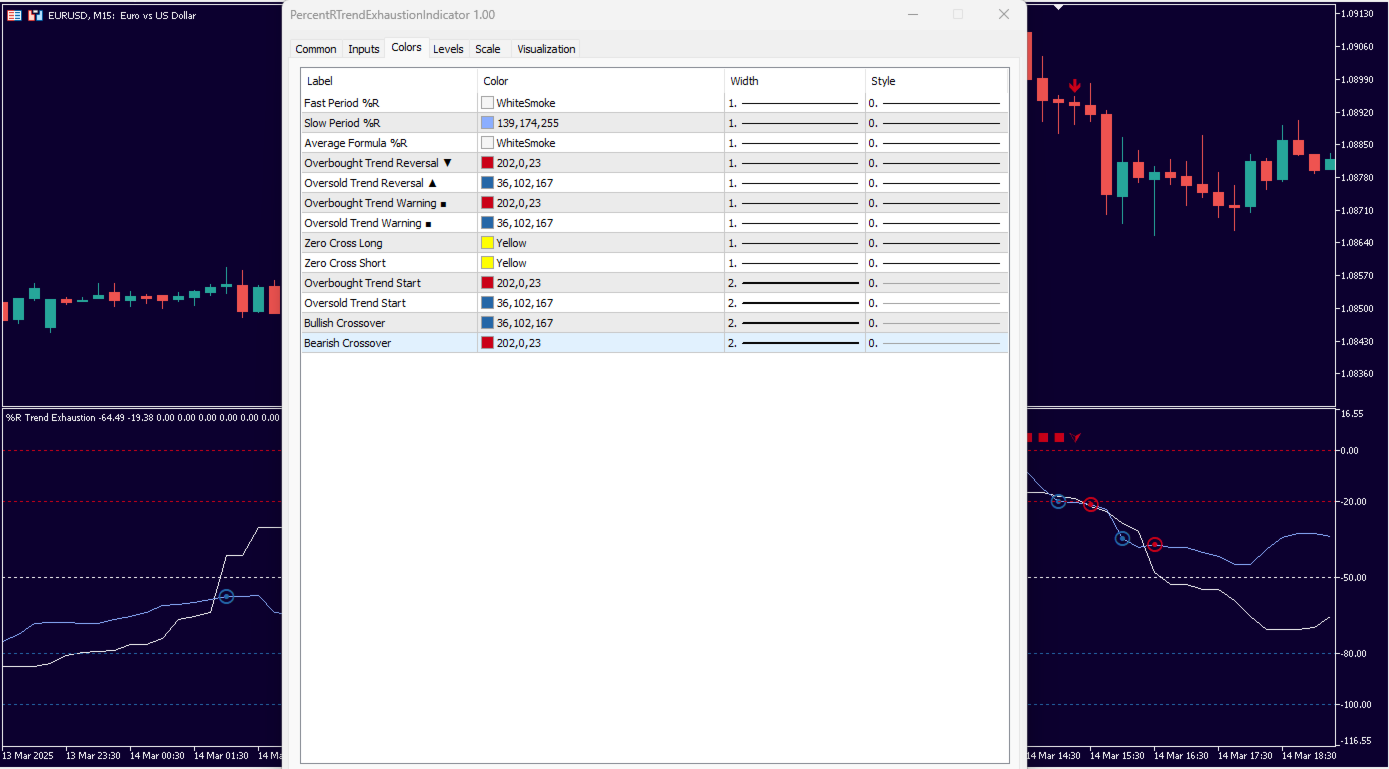
  • Cold Color: Defines the color for bullish signals (default: RGB 36, 102, 167).
  • Hot Color: Defines the color for bearish signals (default: RGB 202, 0, 23).
  • Display Mode: Selects the visualization mode: Oscillator, Overlay, or Candle (default: Oscillator Mode).
  • Formula: Chooses between Standard (2 Period) or Average calculation methods (default: Standard).
  • Source: Specifies the price data source, such as Close, Open, High, Low, Median, Typical, or Weighted (default: Close).
  • Exhaustion Threshold: Sets the threshold for overbought/oversold levels (default: 20).
  • Smoothing Type: Selects the smoothing method, including SMA, EMA, HMA, RMA, WMA, VWMA, SWMA, HighLow, Linear Regression, Median, Momentum, or Percent Rank (default: EMA).
  • Average Formula MA: Defines the moving average period for the Average formula (default: 3).
  • Highlight Crossovers: Enables/disables crossover signal plotting (default: false).
  • Plot Zero Line Crosses: Enables/disables zero line crossover signals (default: false).

Dual Signal Setup (Fast/Slow Lookback)

  • Fast Length: Sets the lookback period for the fast signal (default: 21).
  • Fast Smoothing Length: Defines the smoothing period for the fast signal (default: 7).
  • Slow Length: Sets the lookback period for the slow signal (default: 112).
  • Slow Smoothing Length: Defines the smoothing period for the slow signal (default: 3).

Alerts

  • Bull Trend Start Alert: Enables/disables alerts for bullish trend starts (default: true).
  • Bull Trend Start Alert Message: Custom message for bullish trend start alerts (default: "%RTE bull trend start").
  • Bear Trend Start Alert: Enables/disables alerts for bearish trend starts (default: true).
  • Bear Trend Start Alert Message: Custom message for bearish trend start alerts (default: "%RTE bear trend start").
  • Bull Trend Break Alert: Enables/disables alerts for bullish trend reversals (default: true).
  • Bull Trend Break Alert Message: Custom message for bullish trend reversal alerts (default: "%RTE bull trend break").
  • Bear Trend Break Alert: Enables/disables alerts for bearish trend reversals (default: true).
  • Bear Trend Break Alert Message: Custom message for bearish trend reversal alerts (default: "%RTE bear trend break").
  • Bullish Crossover Alert: Enables/disables alerts for bullish crossovers (default: false).
  • Bullish Crossover Alert Message: Custom message for bullish crossover alerts (default: "Bullish crossover").
  • Bearish Crossover Alert: Enables/disables alerts for bearish crossovers (default: false).
  • Bearish Crossover Alert Message: Custom message for bearish crossover alerts (default: "Bearish crossover").

Strategy

  • Enable Long Deals: Enables/disables long trade signals (default: true).
  • Enable Buy Deals Alerts: Enables/disables alerts for buy signals (default: false).
  • Buy Deals Alert Message: Custom message for buy signal alerts (default: "Buy Signal").
  • Enable Short Deals: Enables/disables short trade signals (default: true).
  • Enable Sell Deals Alerts: Enables/disables alerts for sell signals (default: false).
  • Sell Deals Alert Message: Custom message for sell signal alerts (default: "Sell Signal").
  • Strategy Entry: Selects the trading strategy: Trend Following at Square, Reversal at Square, Reversal Trade at Triangle, Re-enter Trend Trade at Triangle, Pings, or Zero Line Cross (default: Trend Following at Square).

How to Use

  1. Apply the indicator to your MetaTrader 5 chart.
  2. Adjust the input parameters to align with your trading strategy and market conditions.
  3. Monitor the chart for visual signals, such as arrows indicating trend starts, reversals, or crossovers.
  4. Use the alert system to receive notifications for key events, such as trend changes or trading signals.
  5. Combine the indicator with other analysis tools for a comprehensive trading approach.

If you liked the indicator, I will be glad to have a positive review. If you find any problems with the indicator, please contact me

If you want to see more high-quality products or order the development/conversion of your own products, visit my partners' website: 4xDev
Get 10% OFF on manual strategies automation services or indicator development/conversion services at 4xDev using my exclusive promo code: ENTEGRA10
おすすめのプロダクト
This indicator is based on a classic Moving Average indicator. Moving averages help us to first define the trend and second, to recognize changes in the trend. Multi TimeFrame indicator MTF-MA shows MA data from the 4 timeframes by your choice. By default this indicator has external parameters: TF1 = 1; TimeFrame2b = true; TF2 = 5; TimeFrame3b = true; TF3 = 15; TimeFrame4b = true; TF4 = 60; InpPSARStep = 0.02; InpPSARMaximum = 0.2; You can change TF1-TF4 in the next limits: TF1 from M1 (1) to H4
Analista de Tendencia
Juan Guillermo Marulanda Mesa
El Analista de Tendencia es un indicador para MetaTrader 5 que combina análisis técnico con un enfoque estadístico adicional. Su función es mostrar de manera sencilla la dirección del mercado y evaluar la consistencia de cada movimiento de precio. En la práctica, esto significa que el indicador no solo dibuja líneas o colores, sino que interpreta el comportamiento del precio desde distintos ángulos. Por un lado, utiliza herramientas técnicas como las medias móviles exponenciales y el ADX para d
Deposit Supercharger: Optimized Trend Indicator This indicator is based on three technical analysis indicators and two filters, providing more accurate signals. Description: Technical Indicators: The indicator operates based on three technical analysis indicators that help determine the trend direction and potential reversal points. Filters: To filter signals, it uses the price highs and lows from the last two days (support and resistance levels) and a volume indicator, which enhances the signa
This indicator can be considered as a trading system. It offers a different view to see the currency pair: full timeless indicator, can be used for manual trading or for automatized trading with some expert advisor. When the price reaches a threshold a new block is created according to the set mode. The indicator beside the Renko bars, shows also 3 moving averages. Features renko mode median renko custom median renko 3 moving averages wicks datetime indicator for each block custom notification
インディケータは現在のクオートを作成し、これを過去のものと比較して、これに基づいて価格変動予測を行います。インジケータには、目的の日付にすばやく移動するためのテキスト フィールドがあります。 オプション: シンボル - インジケーターが表示するシンボルの選択; SymbolPeriod - 指標がデータを取る期間の選択; IndicatorColor - インジケータの色; HorisontalShift - 指定されたバー数だけインディケータによって描画されたクオートのシフト; Inverse - true は引用符を逆にします。false - 元のビュー。 ChartVerticalShiftStep - チャートを垂直方向にシフトします (キーボードの上下矢印)。 次は日付を入力できるテキストフィールドの設定で、「Enter」を押すとすぐにジャンプできます。
Spike Phantom
Niccyril Chirindo
1 (1)
Spike Phantom   is a specialized indicator for PainX and GainX synthetic indices that generates trading signals with automatic alert notifications. Features The indicator analyzes market conditions using proprietary algorithms and displays buy/sell arrows directly on the chart. It works specifically with PainX and GainX indices on M5 timeframe. Signal generation combines multiple technical analysis methods to identify potential trading opportunities. The system provides two TP levels and SL cal
このインジケーターは、H.M.Gartley (「株式市場の利益」、1935 年) の開発に従って調和パターン (XABCD) を識別します。 D 点を透視投影の点として投影します (設定で ProjectionD_Mode = true を指定します)。 再描画はしません。 作業時間枠のバーが閉じるとき、特定されたパターン ポイントが Patterns_Fractal_Bars バーの間に移動していない場合、チャート上に (予想される価格変動の方向に) 矢印が表示されます。 この瞬間から、矢印はチャート上に永久に残ります。 連続した 2 ~ 3 つ以上の矢印 - これは市場状況の変化であり、再描画/再描画ではありません (時間枠を前後に切り替えてはなりません)。 注: 2 ~ 3 つ以上の矢印が連続している場合 - これは市況の変化であり、再描画ではありません。 パターンの総数は 85 です (Gartley-222 と Gartley-222WS を含む。完全なリストはコメント セクションにあります)。 識別されたすべてのパターンのうち、最後に識別されたパターンのみがベ
The indicator displays the delta and the cumulative delta based on the "Time & Sales" deals list data. In addition to the standard timeframes, the indicator displays data regarding the seconds timeframes (S5, S10, S15, S20, S30) to choose from. Using the rectangle, user can select an arbitrary area in the indicator subwindow to view the ratio of the volumes of deals of buyers and sellers within this area. Indicator features: The indicator works correctly only on those trading symbols for which
The indicator connects the price in a cyclical-wave relationship. Thus, all intersection points will be optimal points at which the movement changes taking into account the indicator period. Crossing points can be used as potential market reversal points. But do not forget that the approach must be complex, the indicator signals require additional information to enter the market. Suitable for forex, futures and binary options without redrawing. It gives a lot of signals, which requires additio
Quantum Levels PRO — 価格の行き先を、到達する前に知る MT5 ノーリペイント価格ターゲットインジケーター | バージョン 3.10 インジケーターの90%が抱える問題: すでに起こったこと しか表示しません。移動平均、RSI、MACD——これらは過去のデータを分析し、値動きが終わった 後 に反応します。シグナルが出る頃には、最適なエントリーポイントは過ぎ去っています。 Quantum Levels PROは違います。 値動きがまだ進行中の段階で、価格が次に向かう具体的な水準——正確な価格ターゲットを算出します。旅が終わる前に目的地が見えます。これは後知恵ではなく、先見性です。 Quantum Levels PROの機能 あらゆる銘柄——株式、FX、暗号資産、コモディティ、指数——のスイング構造を分析し、4つの精密な価格ターゲットを算出します: UP Trend Target ——最大上昇水準。ロングの利確目標、またはショートの反転エントリー。 UP Correction Target ——最小上昇水準、保守的な上昇目標。ロングの部分決済ゾーン。 DOWN Tren
The indicator detects divergence signals - the divergences between the price peaks and the MACD oscillator values. The signals are displayed as arrows in the additional window and are maintained by the messages in a pop-up window, e-mails and push-notifications. The conditions which formed the signal are displayed by lines on the chart and in the indicator window. The indicator parameters MacdFast - fast MACD line period MacdSlow - slow MACD line period MacdSignal - MACD signal line period Macd
# DRAWDOWN INDICATOR V4.0 - The Essential Tool to Master Your Trading ## Transform Your Trading with a Complete Real-Time Performance Overview In the demanding world of Forex and CFD trading, **knowing your real-time performance** isn't a luxury—it's an **absolute necessity**. The **Drawdown Indicator V4.0** is much more than a simple indicator: it's your **professional dashboard** that gives you a clear, precise, and instant view of your trading account status. --- ## Why This Indicator
FiveStarFX Gold Reversal Edge Professional automated trading solution designed for structured execution and controlled risk management in the Gold market. Built for traders who value discipline, precision, and consistency. Key Features Fully automated trading One trade at a time (controlled exposure) Fixed Stop Loss and Take Profit Smart Break-Even protection Profit lock with buffer Step-based trailing management Spread protection system Works on any broker Trade Management The E
FREE
A lot of professional traders use high quality divergence signals as a part of their strategy to enter a position. Spotting correct divergences quickly can often be hard, especially if your eye isn’t trained for it yet. For this reason we’ve created a series of easy to use professional oscillator divergence indicators that are very customisable so you get only the signals you want to trade. We have this divergence indicator for RSI, MACD, Stochastics, CCI and OBV. RSI:   https://www.mql5.com/en/
RBreaker Gold Indicatorsは、金先物の短期日内取引戦略であり、トレンドフォローと日内反転の2つの取引手法を組み合わせたものです。トレンド相場での利益を捉えるだけでなく、相場が反転した際には迅速に利確し、その流れに沿ってポジションを反転させることができます。 この戦略は、アメリカの雑誌『Futures Truth』において、15年連続で最も収益性の高い取引戦略トップ10に選ばれた実績を持ち、非常に長いライフサイクルを誇り、現在も国内外で広く使用・研究されています。 本インディケーターは、2026年の金先物の値動きに対応し、14日間のATR指標に基づいて、ブレイクアウト係数A、観察係数B、リバーサル係数Rをより合理的な値で定義しています。非常に優れたインディケーターであり、安定的な年間収益を実現しています。ぜひおすすめします〜
The "Channel Craft" indicator is a classic tool from the family of channel indicators, allowing traders to react promptly to price movement beyond the established channel boundaries. This channel is formed based on the analysis of several candles, starting from the last one, which helps identify the extremes within the studied range and construct channel lines. Trading within the channel is one of the most popular strategies in the forex market, and its simplicity makes it accessible even to no
Type: Oscillator This is Gekko's Cutomized Moving Average Convergence/Divergence (MACD), a customized version of the famous MACD indicator. Use the regular MACD and take advantage of several entry signals calculations and different ways of being alerted whenever there is potential entry point. Inputs Fast MA Period: Period for the MACD's Fast Moving Average (default 12); Slow MA Period: Period for the MACD's Slow Moving Average (default 26); Signal Average Offset Period: Period for the Signal A
平均方向性指数(ADX)マルチカレンシースキャナー MT5 は、複数の通貨ペアを同時に分析するために設計された高度なトレーディングインジケーターです。これは、平均方向性指数に基づくリアルタイムのシグナルを提供することで、意思決定プロセスを強化したいトレーダーに利益をもたらし、効率的な市場トレンド分析を可能にします。 このツールは、トレンドの強さと方向の動きを簡単に特定できるようにし、ADXに基づく戦略を採用するトレーダーにとって不可欠な資産となっています。リアルタイムのアラートとユーザーフレンドリーなダッシュボードを備え、トレーダーは市場の状況を迅速に評価し、情報に基づいた取引選択を行うことができます。 MQL製品のインストールガイド | MT4/MT5で購入したMQL製品の更新 | 一般的なトラブルシューティングガイド | インジケーター設定 / ガイド 主な機能 バッファ統合: インジケーターの値をアクセス可能なバッファとして公開し、Expert Advisorが自動取引のためにシグナルデータを利用できるようにします。 視覚的矢印シグナル: シグナルキャンドルのチャート上に明確なB
Crypto_Forex MT5用インジケーター「DeMarker Speed」(リペイント機能なし) - このインジケーターの計算は物理学の方程式に基づいています。DeMarker Speedは、DeMarker自体の1次導関数です。 - DeMarkerオシレーター曲線は、インジケーター計算期間中の過去の高値と安値に対する現在の価格ポジションを示します。 - DeMarker Speedインジケーターは、スキャルピングでの高速エントリーに適しています(画像をご覧ください)。 - DeMarker Speedは、DeMarker自体の方向転換速度を示します。非常に敏感です。 - DeMarker Speedインジケーターの値が0未満の場合、速度はマイナス、0超の場合、速度はプラスです。 - このインジケーターには、モバイルとPCの両方でアラート機能が組み込まれています。 Click here to see high quality Trading Robots and Indicators! これは、このMQL5ウェブサイトでのみ提供されるオリジナル製品です。
Boom and Crash Sniper Spike Detector - Boom 1000 The Boom and Crash Sniper Spike Detector is the ultimate tool for spike trading on Boom 1000, offering clear and reliable signals to help you capture high-probability trades. This advanced indicator is designed to enhance your trading strategy by simplifying spike detection and maximizing your profits. Key Features: Multi-Timeframe Compatibility : The indicator can be used on M1, M5, M15, M30, and H1 timeframes, but it works best on the M1 timefra
The indicator - "ATR Line" determines the current trend and gives signals to buy (green arrow to the top) or sell (red arrow to the bottom). The indicator calculation is based on the deviation of the average price of the instrument from its average true range - ATR. The moving average of prices is used to reduce "market noise". If the main line of the indicator - "ATR Line" is lower the instrument price chart, then the market is in a "bullish" trend. If the main line of the indicator is higher t
Crypto_Forexインジケーター「 MFI with Dynamic OverSold/OverBought zones 」MT5用、リペイント機能なし。 - Money_Flow_Index (MFI) は、価格と出来高データを用いて売られ過ぎと買われ過ぎのゾーンを特定するテクニカルオシレーターです。 - ダイナミックな買われ過ぎゾーンでは売りトレードを、売られ過ぎゾーンでは買いトレードを行うのに最適です。 - MFIはダイバージェンスの検出に非常に有効で、プライスアクションと組み合わせるのも効果的です。 - ダイナミックな買われ過ぎゾーン - 黄色の線より上。 - ダイナミックな売られ過ぎゾーン - 緑の線より下。 - MFIオシレーターは、強気と弱気の価格モメンタムに関する情報を提供します。 - PCとモバイルアラート機能付き。 高品質のトレーディングロボットとインジケーターをご覧になるにはここをクリックしてください! これは、このMQL5ウェブサイトでのみ提供されるオリジナル製品です。
Advanced Fakeout Detection Indicator   Professional Liquidity Sweep & Market Structure Analysis for MetaTrader 5 The Advanced Fakeout Detection Indicator is a sophisticated technical analysis tool designed to identify high-probability market reversal opportunities by detecting liquidity sweeps and structural breaks in price action. What This Indicator Does This indicator automatically identifies and visualizes potential fakeout scenarios where price temporarily breaks through significant level
The main application of the Faradenza indicator is to generate buy and sell signals. The indicator tracks the market trend with unrivaled reliability, ignoring sharp market fluctuations and noise around the average price. Determining the market trend is an important task for traders. The Faradenza indicator implements an advanced algorithm for visualizing the market trend. It catches the trend and shows favorable moments of entering the market with arrows. The main purpose of the indicator is to
The Antique Trend Indicator is a revolutionary trend trading and filtering solution with all the important features of a trend tool built into one tool! The Antique Trend indicator is good for any trader, suitable for any trader both for Forex and binary options. There is no need to configure anything, everything has been perfected by time and experience, it works great during flats and trends. The Antique Trend indicator is a tool for technical analysis of financial markets, reflecting curren
The Hybrid Trend Impulse indicator is an advanced tool that combines modern approaches to trend and impulse analysis, offering unique capabilities for effective deposit management. Key advantages of the HybridTrendImpulse_indicator: Nonlinear dynamics: The method of interaction between opening prices forms a unique nonlinear model that is particularly sensitive to significant price fluctuations, increasing their significance and making the indicator ideal for working in high volatility conditio
Простой индикатор тренда в NRTR виде с отрисовкой линий стоплосса и тейпрофита, цвет и направление движения которых определяются действующим трендом. Индикатор имеет возможность подавать алерты, отправлять почтовые сообщения и push-сигналы при смене направления тренда. Следует учесть что значение входного параметра индикатора Deviation of the take profit line in points для каждого финансового актива на каждом таймфрейме   необходимо подбирать индивидуально!
This indicator shows a candle combination based on dodge, dodge and pin bar. The logic of the pattern is to stand on the side of strength, after uncertainty. The indicator is universal and is useful for trading binary options, forex, ETFs, cryptocurrency, stocks. The indicator supports timeframes from M5 to MN, including non-standard TF presented in MT5. (М5,М6,М10,M12, M15, M20, M30, H1, H2, H3, H4, H6, H8, H12, D1, W1, MN). The ability to enable and disable TF is implemented. Sound alerts and
Gartley Butterfly Pattern EA 説明 このエキスパートアドバイザー(EA)は、ハーモニックパターンに基づいて自動取引を行います。ハーモニックパターンはテクニカル分析の人気パターンであり、初めにハロルド・マッキンリー・ガートリー(Harold McKinley Gartley)によって提唱され、その後スコット・カーニー(Scott Carney)によって体系化および拡張されました。カーニーはBat、Crab、Shark、Deep Crab、Alternate Batといったパターンも開発しています。 このロボットは以下のパターンを認識し、取引します:Gartley、Butterfly、Bat、Crab、Shark、Cypher、Deep Crab、Alternate Bat、AB=CD、Three Drives。 これらのパターンはフィボナッチレベルを基に形成されており、許容誤差を柔軟に設定可能です。 EAの機能 指定された時間足(例:H1、H4。デフォルトはH3)でチャートをスキャン、 確認されたパターンに基づき、設定されたパラメータで取引を開始、 ポジシ
Energy Gravity — User Guide Energy Gravity is a structural market analysis tool that visualizes the hidden energetic geometry of price. The indicator treats the market as a dynamic field of distributed mass, where past price interaction forms: attraction zones equilibrium areas structural tension probable return directions Core concept: Price does not move randomly — it interacts with accumulated liquidity and time. Energy Gravity shows where equilibrium is located, where liquidity is concentrat
このプロダクトを購入した人は以下も購入しています
SuperScalp Pro
Van Minh Nguyen
4.53 (19)
SuperScalp Pro — 高度なマルチフィルター対応スキャルピングインジケーターシステム SuperScalp Pro は、クラシックな Supertrend と複数のインテリジェントな確認フィルターを組み合わせた高度なスキャルピング用インジケーターシステムです。M1〜H4 のすべての時間足で効率的に機能し、特に XAUUSD、BTCUSD、および主要なFX通貨ペアに適しています。単体のシステムとして、また既存の取引戦略へ柔軟に統合して使用できます。 本インジケーターは 11 以上のフィルターを統合しており、短期・長期の EMA、トレンド判定に用いる 3 本の EMA、EMA スロープ(EMA slope)、RSI、ADX、出来高、VWAP、ボリンジャーバンドのブレイクアウト、MACD ダイバージェンスフィルターなどを含みます。スマートキャンドルフィルターはローソク足の終値を確認して弱いシグナルを排除し、3 本の EMA と MACD ダイバージェンスを組み合わせたトレンド認識メカニズムにより勝率の高いシグナルの選別を支援します。 SuperScalp Pro は ATR に基
Entry In The Zone and SMC Multi Timeframe is a real-time 2-in-1 market analysis tool that combines market structure analysis and a No Repaint BUY / SELL signal system into a single indicator, built on Smart Money Concepts (SMC) — a widely adopted framework used by professional traders to understand market structure. This indicator helps you see the market more clearly, make decisions based on structure rather than guesswork, and focus on high-probability zones where price is more likely to react
Azimuth Pro
Ottaviano De Cicco
5 (6)
Azimuth Pro V2:MT5向けシンセティック・フラクタル構造分析と確認済みエントリー 概要 Azimuth Pro は Merkava Labs によるマルチレベルスイング構造インジケーターです。4つのネストされたスイングレイヤー、スイングアンカーVWAP、ABCパターン検出、3タイムフレーム構造フィルタリング、そして確定バーでの確認済みエントリー — 1つのチャートで、ミクロスイングからマクロサイクルまでを網羅するワークフロー。 これはブラインドシグナル製品ではありません。ロケーション、コンテキスト、タイミングを重視するトレーダーのための構造ファーストワークフローです。 V2発売記念オファー — Azimuth Pro V2をUSD 399で(次の100本)。最終価格:USD 499。 1. V2での変更点 シンセティック・マルチタイムフレームエンジン 上位タイムフレーム分析をMeridian Proと同じ独自のシンセティックアーキテクチャで一から再構築。よりクリーンなHTFコンテキスト、安定したライブ動作、従来のMTF同期問題なし。シンセティックエンジンは 固定比率タ
このインジケーターを購入された方には、以下の特典を 無料 で提供しています: 各トレードを自動で管理し、ストップロスとテイクプロフィットを設定し、戦略ルールに基づいてポジションを決済する補助ツール 「Bomber Utility」 様々な銘柄に合わせたインジケーターの設定ファイル(セットファイル) 「最小リスク」、「バランスリスク」、「待機戦略」 の3つのモードで使用できる Bomber Utility 用の設定ファイル このトレーディング戦略をすぐに導入・設定・開始できる ステップバイステップのビデオマニュアル ご注意: 上記の特典を受け取るには、MQL5のプライベートメッセージシステムを通じて販売者にご連絡ください。 オリジナルのカスタムインジケーター 「Divergence Bomber(ダイバージェンス・ボンバー)」 をご紹介します。これは、MACDのダイバージェンス(乖離)戦略に基づいた 「オールインワン」型のトレーディングシステム です。 このテクニカルインジケーターの主な目的は、価格とMACDインジケーターの間に発生するダイバージェンスを検出 し、将来の価格の動きを示す
Power Candles – あらゆる市場に対応した強度ベースのエントリーシグナル Power Candles は、Stein Investments が長年培ってきた強度分析を価格チャート上に直接反映します。価格だけに反応するのではなく、各ローソク足は実際の市場の強さに基づいて色分けされ、モメンタムの蓄積、強度の加速、明確なトレンド転換を瞬時に把握できます。 すべての市場に共通する単一ロジック Power Candles は すべての取引シンボル で自動的に動作します。現在のシンボルが Forex か非 Forex 市場かを自動判別し、内部で適切な強度モデルを適用します。 Forex および Gold :FX Power のデルタ値を使用(絶対値レンジ最大 100) 指数、暗号資産、CFD :IX Power の強度値を使用(絶対値レンジ最大 50) 必要な強度計算は Power Candles に直接組み込まれています。ローソク足のカラーリングやシグナルロジックに、追加のインジケーターは不要です。 価格ノイズではなく「強度状態」 各ローソク足は、以下の 9 つの明確に定義された強
OmniSync Projection
Antonio-alin Teculescu
5 (1)
Chronos Fractal Engine is an innovative price projection indicator for MetaTrader 5, designed to transform your technical analysis by intelligently identifying and projecting historical price patterns. Built upon an advanced correlation algorithm and the fractal principles of the market, this powerful tool visualizes potential future price movements, giving you a unique edge in your trading decisions. What is Chronos Fractal Engine? At its core, the Chronos Fractal Engine employs a sophisticat
このインジケーターを購入すると、プロ仕様のトレードマネージャーを無料で差し上げます。 まず第一に、このトレーディングシステムがノンリペイント、ノンリドロー、ノンラグのインジケーターであることを強調する価値がある。これにより、手動取引とロボット取引の両方に理想的なものになっています。 オンラインコース、マニュアル、プリセットのダウンロード。 「スマートトレンドトレーディングシステム MT5」は、新規および経験豊富なトレーダー向けにカスタマイズされた包括的なトレーディングソリューションです。10以上のプレミアムインジケーターを組み合わせ、7つ以上の堅実なトレーディング戦略を備えており、多様な市場状況に対応する多目的な選択肢となっています。 トレンドフォロー戦略:トレンドを効果的に乗り越えるための正確なエントリーとストップロス管理を提供します。 リバーサル戦略:潜在的なトレンドの反転を特定し、トレーダーがレンジ相場を活用できるようにします。 スキャルピング戦略:高速で正確なデイトレードおよび短期取引のために設計されています。 安定性:すべてのインジケーターはノンリペイント、ノンリドロー、ノ
トレンド スクリーナー インジケーターでトレンド取引の力を解き放ちます。ファジー ロジックと複数通貨システムを活用した究極のトレンド取引ソリューションです。 ファジー ロジックを活用した革新的なトレンド インジケーターである Trend Screener を使用して、トレンド取引を向上させます。 これは、13 を超えるプレミアム ツールと機能、および 3 つの取引戦略を組み合わせた強力なトレンド追跡インジケーターであり、Metatrader をトレンド アナライザーにする多用途の選択肢となります。 期間限定オファー : トレンド スクリーナー インジケーターは、わずか 100 ドルで生涯ご利用いただけます。 (元の価格 50$ ) (オファー延長) Trend Screener の 100% 非再描画精度の揺るぎない精度を体験して、取引の決定が過去の価格変動の影響を受けないようにしてください。 マルチタイムフレームおよびマルチ通貨機能の多用途性を解放し、比類のない自信を持って外国為替、商品、暗号通貨、インデックスの世界を取引できるようにします。 Trend Screener の包括的な
Meridian Pro
Ottaviano De Cicco
5 (1)
Meridian Pro:MT5用プロフェッショナル・マルチタイムフレーム・トレンドマトリックス 概要 Meridian Pro は Merkava Labs が開発したマルチタイムフレーム・トレンドマトリックスで、方向性の状態、強度、モメンタムの状況、マトリックスの合意をひとつのコンパクトなパネルに集約します。ひとつのアダプティブエンジンがM1からW1まで一貫して適用されます。シンボルごとの調整は不要。インジケーターの積み重ねも不要。すべてのアセットとすべてのタイムフレームをカバーするひとつの構造化された読み取りです。 発売キャンペーン — Meridian Proを USD 99 (導入価格)で入手。通常価格:USD 149 。 1. Meridian Proが他と異なる理由 ひとつのエンジン、バラバラなインジケーターのダッシュボードではない 多くのMTFダッシュボードは、タイムフレームごとに生のインジケーター値を繰り返すだけです。Meridian Proはマトリックス全体でひとつのアダプティブ・トレンドエンジンを使用するため、パネルの各行が同じ構造化フレームワークから導出されます
Quantum TrendPulse を ご紹介します。これは、   SuperTrend   、   RSI   、および Stochastic のパワーを 1 つの包括的なインジケーターに組み合わせて、取引の可能性を最大限に引き出す究極の取引ツールです。精度と効率を求めるトレーダー向けに設計されたこのインジケーターは、市場のトレンド、勢いの変化、最適なエントリー ポイントとエグジット ポイントを自信を持って特定するのに役立ちます。 主な特徴: SuperTrend 統合: 現在の市場動向に簡単に追従し、収益性の波に乗ることができます。 RSI精度: 買われすぎと売られすぎのレベルを検出し、市場の反転のタイミングに最適で、SuperTrendのフィルターとして使用されます。 確率的精度: 確率的振動を活用して、変動の激しい市場で隠れたチャンスを見つけます。SuperTrend のフィルターとして使用されます。 マルチタイムフレーム分析:   M5 から H1 または H4 まで、さまざまなタイムフレームで市場を常に把握します。 カスタマイズ可能なアラート: カスタム取引条件が満たされ
Gann Made Easy   は、ミスター・ギャンの理論を使用した取引の最良の原則に基づいた、プロフェッショナルで使いやすい外国為替取引システムです。 W・D・ガン。このインジケーターは、ストップロスとテイクプロフィットレベルを含む正確な買いと売りのシグナルを提供します。 PUSH通知を利用して外出先でも取引可能です。 ご購入後、取引方法の説明と優れた追加インジケーターを無料で入手するには、私にご連絡ください! おそらく、ギャンの取引手法についてはすでに何度も聞いたことがあるでしょう。通常、ギャンの理論は初心者のトレーダーだけでなく、すでにある程度の取引経験がある人にとっても非常に複雑なものです。なぜなら、ギャンの取引手法は理論的にはそれほど簡単に適用できるものではないからです。私はその知識を磨き、最良の原則を私の外国為替インジケーターに組み込むために数年を費やしました。 このインジケーターは非常に簡単に適用できます。必要なのは、それをチャートに添付し、簡単な取引推奨事項に従うだけです。このインジケーターは常に市場分析の仕事を行い、取引の機会を探します。適切なエントリーポイントを検
BTMM State Engine Pro is a MetaTrader 5 indicator for traders who use the Beat The Market Maker approach: Asian session context, kill zone timing, level progression, peak formation detection, and a multi-pair scanner from a single chart. It combines cycle state logic with a built-in scanner dashboard so you do not need the same tool on many charts at once. What it does Draws the Asian session range; session times can follow broker server offset or be set in inputs. Tracks level progression (L
FX Trend NG:次世代マルチマーケット・トレンドインテリジェンス 概要 FX Trend NG は、複数の時間足に対応したプロフェッショナル向けトレンド分析およびマーケット監視ツールです。 市場全体の構造を数秒で把握することができます。 複数のチャートを切り替える必要はありません。どの銘柄がトレンド中なのか、どこでモメンタムが弱まっているのか、そしてどの時間足で強い整合性があるのかを瞬時に確認できます。 ローンチ特別オファー – FX Trend NG を $30(6ヶ月) または $80 永久ライセンス でご利用いただけます。 すでに Stein Investments のユーザーですか? -> メッセージを送信 して、プライベートグループへアクセスしてください。 セットアップや詳細情報が必要ですか? -> Stein Investments 公式ページ をご覧ください。 1. FX Trend NG が他と異なる理由 3ステート・トレンドロジック ― Buy と Sell だけではない • 多くのインジケーターは Buy または Sell の2状態のみを表示します。
ARICoin is a powerful trading companion designed to generate high-probability entry signals with dynamic TP/SL/DP levels based on volatility. Built-in performance tracking shows win/loss stats, PP1/PP2 hits, and success rates all updated live. Key Features: Buy/Sell signals with adaptive volatility bands Real-time TP/SL/DP levels based on ATR Built-in MA Filter with optional ATR/StdDev volatility Performance stats panel (Success, Profit/Loss, PP1/PP2) Alerts via popup, sound, push, or email Cust
Crystal Heikin Ashi Signals - Professional Trend & Signal Detection Indicator Advanced Heikin Ashi Visualization with Intelligent Signal System for Manual & Automated Trading Final Price: $149 ---------> Price goes up $10 after every 10 sales . Limited slots available — act fast . Overview Crystal Heikin Ashi Signals is a professional-grade MetaTrader 5 indicator that combines pure Heikin Ashi candle visualization with an advanced momentum-shift detection system. Designed for both manual traders
まず第一に、この取引ツールはノンリペイント、ノンリドロー、ノンラグの指標であり、プロの取引に理想的ですことを強調する価値があります。 オンラインコース、ユーザーマニュアル、デモ。 スマートプライスアクションコンセプトインジケーターは、新米から経験豊富なトレーダーまで、非常 に強力なツールです。Inner Circle Trader AnalysisやSmart Money Concepts Trading Strategiesなど、20以上の有用な指標を1つに組み合わせています。このインジケーターはスマートマネーコンセプトに焦点を当て、大手機関の取引方法を提供し、彼らの動きを予測するのに役立ちます。 特に、流動性分析に優れており、機関がどのように取引しているかを理解しやすくしています。市場のトレンドを予測し、価格の動きを慎重に分析するのに優れています。機関の戦略とトレードを合わせることで、市場の動向についてより正確な予測ができます。このインジケーターは多目的であり、市場構造を分析し、重要な注文ブロックを特定し、さまざまなパターンを認識するのに優れています。 このインジケーター
Trend Ai indicatorは、トレンドの識別と実用的なエントリポイントと反転アラートを組み合わせることで、トレーダーの市場分析を強化する優れたツールです。 この指標は、ユーザーが自信と正確さで外国為替市場の複雑さをナビゲートすることを可能にします トレンドAiインジケーターは、主要なシグナル以外にも、プルバックやリトレースメント中に発生するセカンダリエントリポイントを識別し、トレーダーが確立されたトレンド内の価格修正を活用できるようにします。 重要な利点: *MT4およびMT5の仕事 *明確な買いまたは売りシグナル *再描画しません ·すべての資産で動作します 私はeaやセットをtelegram it詐欺で販売しないように注意してください。 すべての設定はここでブログで無料です。  重要! 指示とボーナスを得るために購入後すぐに私に連絡してください! 私の他のプロダクトと同様、実質操作の監視はここに見つけることができます: https://www.mql5.com/en/users/mechanic/seller&nbsp ; 設定および入力: すべての
FX Power: 通貨の強弱を分析して、より賢い取引を実現 概要 FX Power は主要通貨と金の実際の強弱をあらゆる市場状況で理解するための必須ツールです。強い通貨を買い、弱い通貨を売ることで、 FX Power は取引の意思決定を簡素化し、高い確率の取引機会を見出します。トレンドを追従する場合でも、極端なデルタ値を使用して反転を予測する場合でも、このツールはあなたの取引スタイルに完全に適応します。ただ取引するだけではなく、 FX Power で賢く取引をしましょう。 1. なぜ FX Power がトレーダーにとって非常に有益なのか 通貨と金のリアルタイム強弱分析 • FX Power は主要通貨と金の相対的な強弱を計算し、マーケットダイナミクスに関する明確な洞察を提供します。 • どの資産がリードしているか、または後れを取っているかを監視して、取引するペアを賢く選びましょう。 マルチタイムフレームの包括的なビュー • 短期、中期、長期のタイムフレームで通貨と金の強弱を追跡し、マーケットトレンドに基づいて取引戦略を調整できます。 • スキャルピングからスイングトレード
あなたのシンボルでどの戦略が実際に機能するか確認しましょう - リアルマネーをリスクにさらす前に。 Power Barは、あらゆるシンボルとあらゆるタイムフレームで 極端な価格バー を検出し、3つの異なるトレード戦略を即座にバックテストします。勝率、プロフィットファクター、損益を並べて比較できます。すべてが1つのインタラクティブなパネルに集約されています。 推測なし。カーブフィッティングなし。データだけです。 Power Barが特別な理由 ほとんどのインジケーターはシグナルを出すだけで、それが機能するかどうかは推測に任されます。Power Barはさらに先を行きます - すべてのシグナルを 3つの戦略 に対してテストし、統計を表示します。FlipFlop、Momentum、Reversalをワンクリックで切り替え、数値が即座に変化するのを確認できます。 FlipFlop - 常にポジションを保有。シグナルでエントリーし、反対シグナルでイグジット。当社のリサーチでは、US30、US500、DAXなどのトレンドのあるインデックスで最も効果的です。 Momentum - シグナルの方向に
Auto Optimized Parabolic RSI: 高度な3Dモメンタムエンジン ほとんどのリテール向けインジケーターは、市場のボラティリティが変化した瞬間に破綻する静的な入力値に依存しているため、失敗に終わります。Auto Optimized Parabolic RSIは、自らの数学的優位性を継続的に再計算することで「インジケーターの陳腐化」問題を解決し、機関投資家レベルの定量的適応力をMT5ターミナルに直接もたらします。 最大の強み: カスタムインメモリ3D最適化 標準的な自動最適化ツールは、インジケーターの呼び出しで端末に過負荷をかけるため、頻繁にMT5プラットフォームをフリーズさせます。本ツールは、このボトルネックを完全に回避しています。RAMベースのカスタムネイティブ計算機を内蔵した内部エンジンは、チャートを読み込んだりタイムフレームを変更したりするたびに、超高速の3Dグリッド探索を実行します。RSI期間(頻度)、SARステップ(加速度)、SAR最大値(制限速度)を同時にスイープし、プラットフォームを遅延させることなく、数万通りものパラメーターの組み合わせを絶対的なミ
Bill Williams Advanced is designed for automatic chart analysis using Bill Williams' "Profitunity" system. The indicator analyzes four timeframes at once. Manual (Be sure to read before purchasing) Advantages 1. Analyzes the chart using Bill Williams' "Profitunity" system. Signals are displayed in a table in the corner of the screen and on the price chart. 2. Finds all known AO and AC signals, as well as zone signals. Equipped with a trend filter based on the Alligator. 3. Finds "Divergence Bar
まず第一に、この取引インジケーターは再描画されず、再描画されず、遅延しないことを強調する価値があります。これにより、手動取引とロボット取引の両方に理想的なものになります。 ユーザーマニュアル:設定、入力、戦略。 アトミックアナリストは、価格の強さとモメンタムを利用して市場でより良いエッジを見つけるためのPA価格アクションインジケーターです。ノイズや誤ったシグナルを除去し、取引ポテンシャルを高めるための高度なフィルターを備えています。複雑なインジケーターの複数のレイヤーを使用して、アトミックアナリストはチャートをスキャンし、複雑な数学的計算をシンプルなシグナルと色に変換します。これにより、どのような初心者トレーダーでも理解して使用し、一貫した取引の決定を行うことができます。 「アトミックアナリスト」は、新規および経験豊富なトレーダー向けにカスタマイズされた包括的な取引ソリューションです。プレミアムインジケーターとトップノッチの機能を1つの取引戦略に組み合わせ、すべてのタイプのトレーダーにとって汎用性のある選択肢にします。 デイリートレーディングとスキャルピング戦略:高速で正確なデイ
Smart Stop Indicator – チャート上で実現するインテリジェントなストップロス精度 概要 Smart Stop Indicator は、ストップロスを勘や感情ではなく、明確で体系的に設定したいトレーダーのために設計されています。本ツールは、クラシックなプライスアクション(高値更新・安値切り下げ)と最新のブレイクアウト認識ロジックを組み合わせ、次に来るべき論理的なストップレベルを正確に特定します。トレンド相場、レンジ、急速なブレイクアウト局面のいずれであっても、最適な SL ゾーンとその状態(“new”、“broken”、“valid”)をチャート上に直接表示します。さらに今回、SL 距離の %ADR 表示も新たに追加されています。 主な特徴 マーケット構造に基づく自動ストップ配置 • 市場構造とリアルタイムの値動きに基づき、意味のあるストップロスレベルを自動検出します。 スマートなブレイクアウト感知 • 急激な方向転換やブレイクアウトにも柔軟に対応し、早すぎるストップ調整を避けます。 SL %ADR の表示 • ストップロスまでの距離を ADR(Averag
RelicusRoad Pro: 定量的市場オペレーティングシステム 【期間限定】無制限アクセス 70% OFF - 2,000人超のトレーダーと共に なぜ多くのトレーダーは「完璧な」インジケーターを使っても失敗するのでしょうか? それは、文脈を無視して 単一の概念 だけでトレードしているからです。文脈のないシグナルは単なるギャンブルです。勝ち続けるには、 根拠の重なり(コンフルエンス) が必要です。 RelicusRoad Proは単なる矢印インジケーターではありません。完全な 定量的市場エコシステム です。独自のボラティリティモデリングを用いて、価格が推移する「適正価値の道(Fair Value Road)」をマッピングし、ノイズと真の構造的ブレイクを判別します。 推測はやめましょう。機関投資家レベルの「ロード・ロジック」でトレードを。 コアエンジン:「Road」アルゴリズム システムの中心となる Road Algo は、市場環境にリアルタイムで適応するダイナミックなボラティリティチャネルです。 安全ライン(平衡点) と、価格が数学的に反転しやすい 拡張レベル を投影します。 Si
Berma Bands
Muhammad Elbermawi
5 (8)
Berma Bands (BBs) インジケーターは、市場のトレンドを特定して活用したいトレーダーにとって貴重なツールです。価格と BBs の関係を分析することで、トレーダーは市場がトレンド段階にあるか、レンジ段階にあるかを判断できます。 詳細については、[ Berma Home Blog ] をご覧ください。 バーマ バンドは、上部バーマ バンド、中部バーマ バンド、下部バーマ バンドの 3 つの異なる線で構成されています。これらの線は価格の周りにプロットされ、全体的な傾向に対する価格の動きを視覚的に表します。これらのバンド間の距離から、ボラティリティや潜在的な傾向の反転についての洞察を得ることができます。 バーマ バンドの線がそれぞれ離れると、市場が横ばいまたはレンジ相場の期間に入っていることを示すことがよくあります。これは、明確な方向性の偏りがないことを示しています。トレーダーは、これらの期間中にトレンドを特定するのが難しいと感じる可能性があり、より明確なトレンドが出現するまで待つ場合があります。 バーマ バンドの線が 1 本の線に収束すると、強いトレンド環境の兆候となること
ARIPoint is a powerful trading companion designed to generate high-probability entry signals with dynamic TP/SL/DP levels based on volatility. Built-in performance tracking shows win/loss stats, PP1/PP2 hits, and success rates all updated live. Key Features: Buy/Sell signals with adaptive volatility bands Real-time TP/SL/DP levels based on ATR Built-in MA Filter with optional ATR/StdDev volatility Performance stats panel (Success, Profit/Loss, PP1/PP2) Alerts via popup, sound, push, or email Cu
現在33%オフ 初心者にもエキスパートトレーダーにも最適なソリューション このインジケーターは独自の機能と新しい公式を多数内蔵しており、ユニークで高品質かつ手頃な取引ツールです。このアップデートでは、2つの時間枠ゾーンを表示できるようになります。より長いTFだけでなく、チャートTFとより長いTF(ネストゾーンを表示)の両方を表示できます。すべてのSupply Demandトレーダーの皆さんのお気に召すはずです。:) 重要情報の公開 Advanced Supply Demandの可能性を最大化するには、 https://www.mql5.com/ja/blogs/post/720245 にアクセスしてください。   エントリーまたはターゲットの正確なトリガーポイントを正確に特定できれば取引がどのように改善されるか想像してみてください。新しい基盤となるアルゴリズムに基づいて構築されているため、買い手と売り手の間の潜在的な不均衡をさらに簡単に特定できます。これは、最も強い需要と供給のゾーンと、過去のパフォーマンス(古いゾーンを表示)がグラフィカルに表現されるためです。これらの機能は、最適な
ICT PO3 (Power of 3) AMD Protocol Framework Indicator True Time & Structure Integration   |  Non-Repainting | Real-Time  | Multi-Asset  | MT4 Version Available Full Setup Guide & Strategy Playbook: https://www.mql5.com/en/blogs/post/768683 MT4 Version: https://www.mql5.com/en/market/product/171742 Indicator Overview The ICT PO3 AMD Protocol Framework is a complete structural overlay for MetaTrader 5 that maps the True Daily Cycle directly onto your lower-timeframe execution chart. It projects
トレンドトレーディング は、タイミングのプルバックとブレイクアウトにより、市場で起こっているトレンドから可能な限り利益を得るように設計された指標です。確立されたトレンドの中で価格が何をしているかを分析することにより、取引の機会を見つけます。 [ インストールガイド | 更新ガイド | トラブルシューティング | よくある質問 | すべての製品 ] 自信を持って効率的に金融市場を取引する むち打ちにならずに確立されたトレンドから利益を得る 収益性の高いプルバック、ブレイクアウト、早期の逆転を認識する この指標は、独自の品質とパフォーマンスを分析します 複数時間枠のダッシュボードを実装します インジケーターは再描画されていません 電子メール/音声/視覚アラートを実装します 確立されたトレンドは多くの取引機会を提供しますが、ほとんどのトレンド指標はそれらを完全に無視しています。インジケーターの解釈はかなり簡単です: (1) トレンドの変化 (2) トレンドの方向への後退 (3) トレンドの方向へのブレイクアウト 赤いダッシュ は下降トレンド中の修正です 青いダッシュ は上昇トレンド中
サポート線と抵抗線のプロットにうんざりしていませんか? サポートレジスタンス は、非常に興味深いひねりを加えてチャート内のサポートとレジスタンスラインを自動検出およびプロットするマルチタイムフレームインジケーターです。価格レベルは時間とともにテストされ、その重要性が高まるにつれて、ラインは太くなり、暗くなります。 [ インストールガイド | 更新ガイド | トラブルシューティング | よくある質問 | すべての製品 ] 一晩でテクニカル分析を強化 チャートを閲覧せずに重要な価格レベルを検出 一目ですべての価格レベルの相対的な強さを認識する すべての取引で最大30時間のプロットラインを節約 インジケーターは、すべての価格レベルの年齢を表示します インジケーターは再描画されていません 過去および現在の価格レベルは近接によって崩壊し、現在の市場行動に合わせて調整されます。動作は、必ずしもピークではない場所に線が引かれます。 価格レベルは、時間とともに拒否されるにつれて、より暗く、より広くなります ノイズを避けるために、重要でない価格レベルは定期的にクリアされます カスタマイズ可能な時間枠の
作者のその他のプロダクト
Overview The Market Perspective Structure Indicator is a comprehensive MetaTrader indicator designed to provide traders with a detailed analysis of market structure across multiple timeframes. It identifies and visualizes key price action elements, including swing highs and lows, Break of Structure (BOS), Change of Character (CHOCH), internal structures, equal highs/lows, premium/discount levels, previous levels from higher timeframes, and trading session zones. With extensive customization opt
Candle Perspective Structure Indicator MT5 is a simple indicator that defines and displays the candlestick structure of the market. This indicator will suit both experienced traders and beginners who find it difficult to follow the structure visually. If you want to see more high-quality products or order the development/conversion of your own products, visit my partners' website: 4xDev Get 10% OFF on manual strategies automation services or indicator development/conversion services at 4xDev
FREE
Zero Lag SMA for MT5 The Zero Lag SMA (ZLSMA) indicator for MT5 provides a variation of the Simple Moving Average (SMA) designed to minimize lag, offering traders a more responsive moving average that adjusts more quickly to price changes. This makes it useful for identifying potential trend reversals and key price levels in a timely manner. If you want to see more high-quality products or order the development/conversion of your own products, visit my partners' website: 4xDev Get 10% OFF on m
FREE
Overview The Market Perspective Structure Indicator is an indicator designed to provide traders with a detailed analysis of market structure across multiple timeframes. It identifies and visualizes key price action elements, including swing highs and lows, Break of Structure (BOS), Change of Character (CHOCH), internal structures, equal highs/lows, premium/discount levels, previous levels from higher timeframes, and trading session zones. With extensive customization options, this indicator is
ATR Bands with Take-Profit Zones for MT5 Optimize your risk management and trading strategy with the ATR Bands indicator for MT5 – a powerful tool designed to help you navigate market volatility, identify key price levels, and set realistic stop-loss and take-profit targets. Key Features: ATR-Based Bands : The core of this indicator relies on the Average True Range (ATR) to calculate dynamic upper and lower bands that adapt to market volatility. The bands provide a clear indication of potential
FREE
ATR Bands with Take-Profit Zones for MT4 The ATR Bands indicator for MT4 is designed to assist traders in managing risk and navigating market volatility. By using the Average True Range (ATR), it helps identify key price levels and set realistic stop-loss and take-profit zones. Key Features: ATR-Based Bands : The indicator calculates dynamic upper and lower bands using ATR. These bands adjust based on price volatility, helping to indicate potential support and resistance levels. Customizable Par
FREE
Overview The Williams VIX Fix Indicator is a MetaTrader 5 tool designed to help traders identify potential market tops and bottoms. By analyzing price extremes relative to recent highs and lows, it highlights overbought and oversold conditions using two histograms displayed in a separate window. The indicator combines the Williams VIX Fix calculation with Bollinger Bands and percentile-based thresholds to provide clear signals for potential reversals.  Key Features Market Tops and Bottoms Market
Overview The %R Trend Exhaustion Indicator is a powerful technical analysis tool adapted from TradingView for MetaTrader 4. It helps traders identify trend exhaustion points, potential reversals, and trend continuation signals across various market conditions. With multiple display modes, customizable settings, and enhanced features, this indicator is suitable for diverse trading strategies. If you want to see more high-quality products or order the development/conversion of your own products,
Overview The Williams VIX Fix Indicator is a MetaTrader 4 tool designed to help traders identify potential market tops and bottoms. By analyzing price extremes relative to recent highs and lows, it highlights overbought and oversold conditions using two histograms displayed in a separate window. The indicator combines the Williams VIX Fix calculation with Bollinger Bands and percentile-based thresholds to provide clear signals for potential reversals.  Key Features Market Tops and Bottoms Market
Overview Harmonic Patterns MT4 is a technical analysis indicator designed for the MetaTrader 5 platform. It identifies and displays harmonic price patterns, such as Butterfly, Cypher, Crab, Bat, Shark, and Gartley, in both bullish and bearish directions. The indicator calculates key price levels, including entry, stop loss, and three take-profit levels, to assist traders in analyzing market movements. Visual elements and customizable alerts enhance usability on the chart. Features Detects six ha
Market Structure Oscillator Overview The Market Structure Oscillator is a technical indicator designed for MetaTrader platforms to analyze market trends across multiple timeframes. It provides a clear visualization of short-term, intermediate-term, and long-term market structures through an oscillator and histogram display in a separate window. The indicator also supports optional chart objects to highlight key market structure points. Features Displays a composite oscillator combining short-ter
MACD ADX Oscillator – a powerful indicator that combines the best of the Moving Average Convergence Divergence (MACD) and the Average Directional Index (ADX) to provide unparalleled insights into market momentum and trend strength. Key Features: Dual Momentum Analysis: This indicator merges MACD's ability to detect changes in market momentum with ADX's strength measurement, giving you a comprehensive view of the market's direction and power. Customizable Settings: Tailor the indicator to your t
Percentage Price Oscillator (PPO) for MT5 – a dynamic tool designed to measure price momentum and trend direction with precision. Core Features: Flexible Configuration : Customize the PPO to match your trading approach by adjusting the Fast Length, Slow Length, and Signal Length. The indicator is also versatile enough to adapt to any market condition with various source inputs. Intuitive Histogram Display : Choose to visualize the difference between the PPO and Signal lines with a histogram, pro
Chandelier Exit for MT5 The Chandelier Exit indicator is designed to dynamically set stop-loss levels based on market volatility, measured through the Average True Range (ATR). Key Features: ATR-Based Stops : The indicator calculates stop-loss levels for long and short positions using a moving average of the True Range (ATR), adapting to market volatility changes. Customizable Parameters : Users can set the ATR period, ATR multiplier, and choose whether to use the closing price to determine pric
Overview Heiken Ashi CE Filtered MT5 is a technical indicator for the MetaTrader 5 platform. It integrates smoothed candlestick charting with a dynamic exit strategy and a customizable trend filter to deliver clear buy and sell signals. The indicator is designed to improve trend detection and signal reliability by reducing market noise. If you want to see more high-quality products or order the development/conversion of your own products, visit my partners' website: 4xDev Get 10% OFF on manual
Triple EMA Trend Following + Signals indicator is a tool for traders who are looking for accurate trend identification and buy/sell signals! Key Features: Triple EMA Trend Analysis: This indicator uses two Triple Exponential Moving Averages (TEMA1 and TEMA2) to capture short-term and long-term trends effectively. TEMA1 reacts to rapid price changes, while TEMA2 filters out market noise, helping you stay on the right side of the trend. RSI and ATR Filters: It incorporates the RSI (Relative Streng
Trend Lines Supports and Resistances is an indicator that analyses the market structure, identifies Pivot Points, displays active Support/Resistance zones and trend levels. Main Features: Defining and displaying Pivot Points. Analyse Pivot Points to build and display trend lines. Setting up visual display of trend lines. Setting up trend lines broken notifications. Analyse Pivot Points to define and display support and resistance levels. Setting up visual display of support and resistance leve
Trend Levels Indicator Elevate your trading strategy with the Trend Levels Indicator , a sophisticated tool designed to detect market trends and highlight critical price levels. This cutting-edge indicator is packed with features to simplify trend analysis and empower your decision-making process. Key Features: Dynamic Trend Levels : Accurately plots high, mid, and low levels based on market dynamics. Custom Alerts & Notifications : Get real-time alerts and notifications when trends change, ensu
Overview Harmonic Patterns MT5 is a technical analysis indicator designed for the MetaTrader 5 platform. It identifies and displays harmonic price patterns, such as Butterfly, Cypher, Crab, Bat, Shark, and Gartley, in both bullish and bearish directions. The indicator calculates key price levels, including entry, stop loss, and three take-profit levels, to assist traders in analyzing market movements. Visual elements and customizable alerts enhance usability on the chart. Features Detects six ha
Overview Short-Term Basket EA MT5 is an Expert Advisor for the MetaTrader 5 platform, designed to manage a sequence of trades with a basket trading strategy, aiming to achieve a specified profit target. Features Opens an initial trade in a user-specified direction. Reopens a trade in the same direction with the same lot size and target if the previous trade closes in profit. Opens a hedge trade in the opposite direction with the same lot size and target, plus an additional trade in the opposite
The Koncorde Plus Indicator is a sophisticated and versatile technical analysis tool for MetaTrader 5 (MT5), meticulously converted and enhanced from the acclaimed Koncorde [+] indicator on TradingView. Optimized for Forex volume analysis while preserving the original algorithm for all volume-based markets, it integrates six core components—four trend-based (RSI, MFI, Bollinger Bands, Stochastic) and two volume-based (Positive Volume Index (PVI) and Negative Volume Index (NVI))—to deliver a comp
Market Structure Oscillator Overview The Market Structure Oscillator is a technical indicator designed for MetaTrader platforms to analyze market trends across multiple timeframes. It provides a clear visualization of short-term, intermediate-term, and long-term market structures through an oscillator and histogram display in a separate window. The indicator also supports optional chart objects to highlight key market structure points. Features Displays a composite oscillator combining short-ter
フィルタ:
レビューなし
レビューに返信