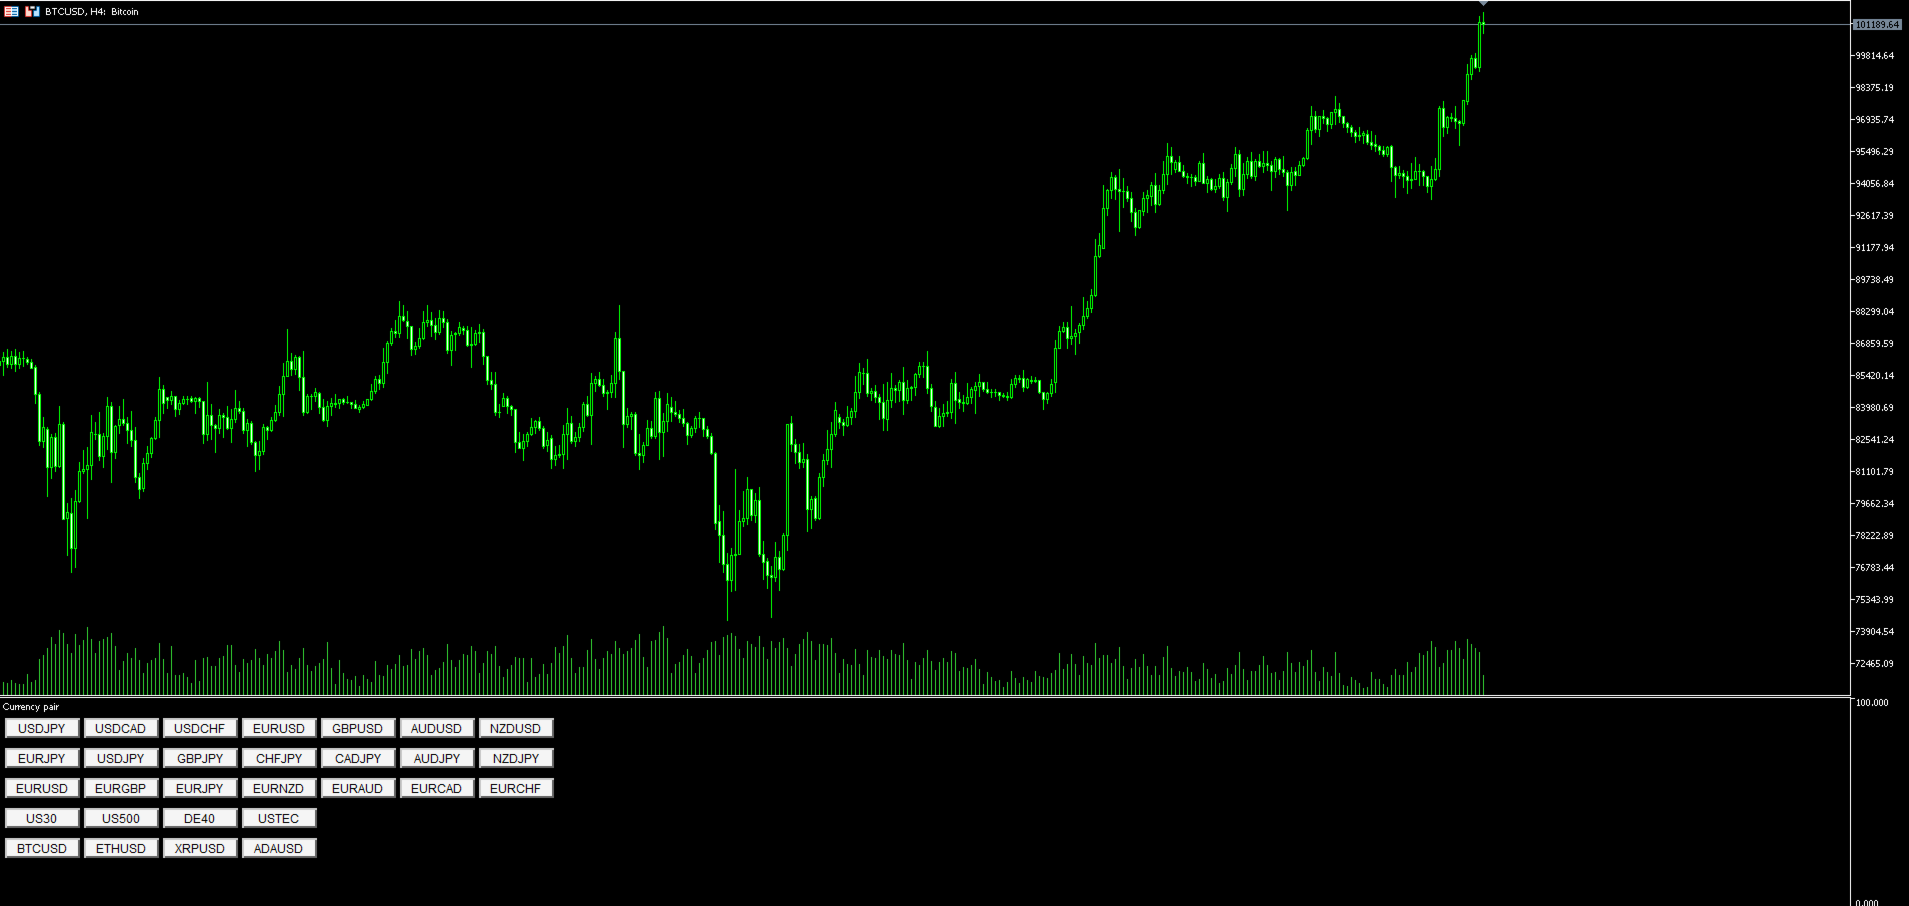
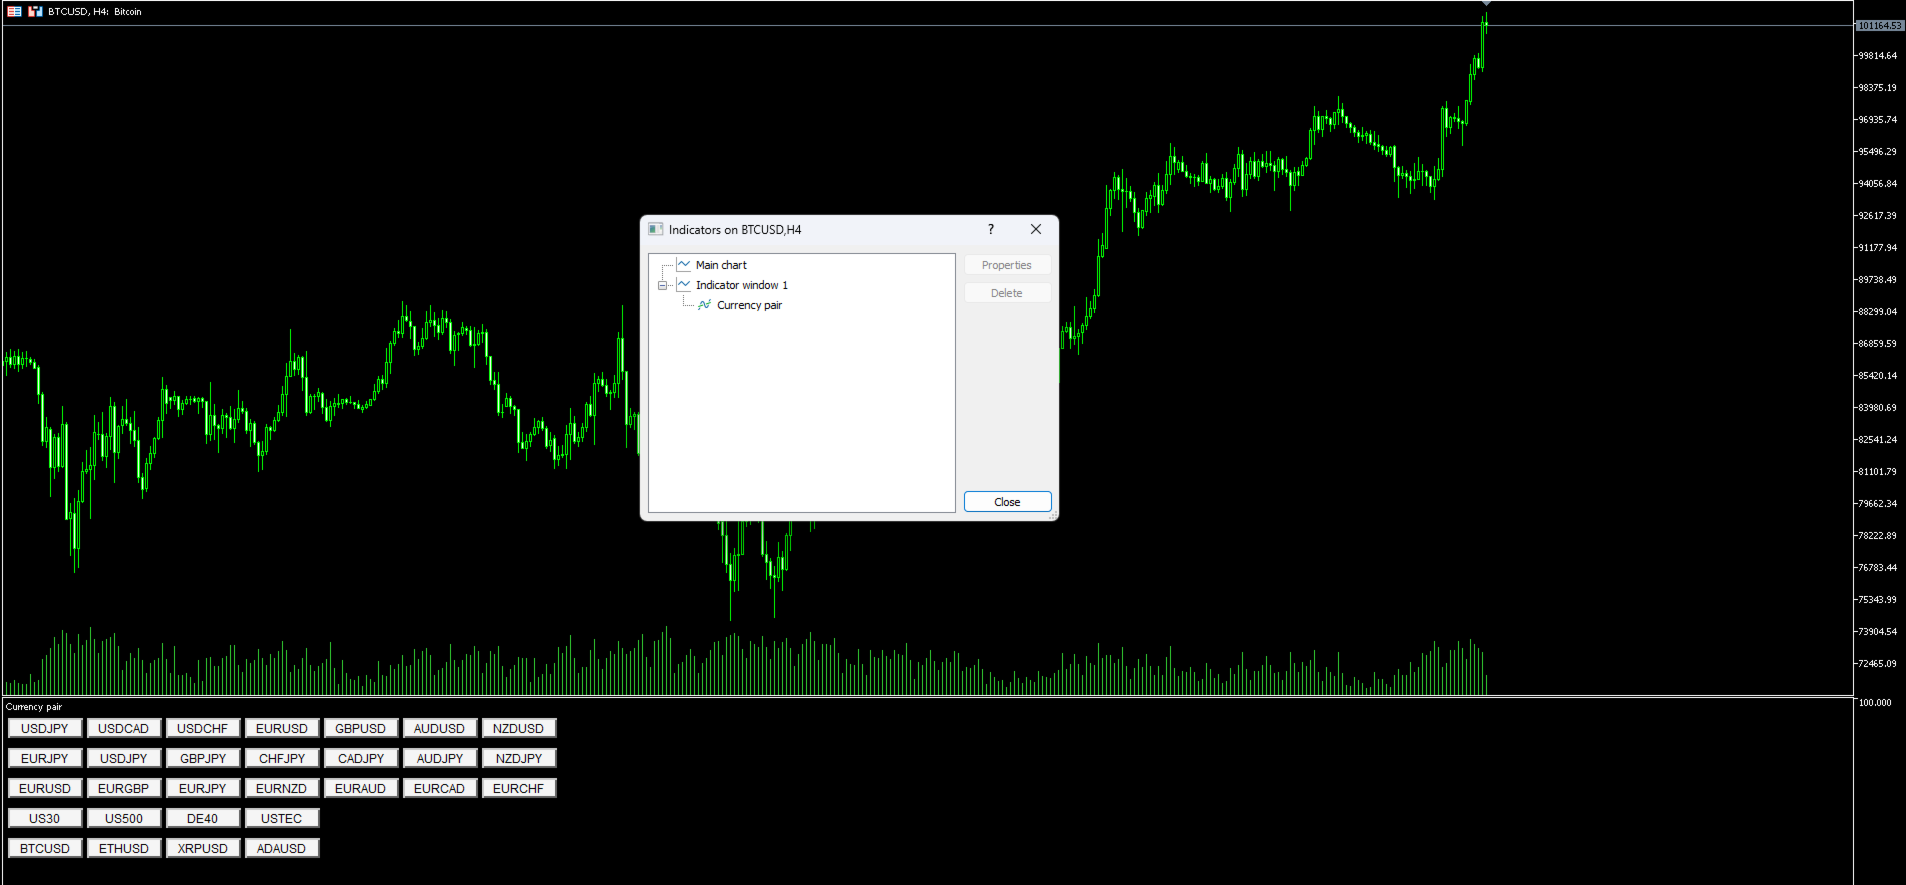
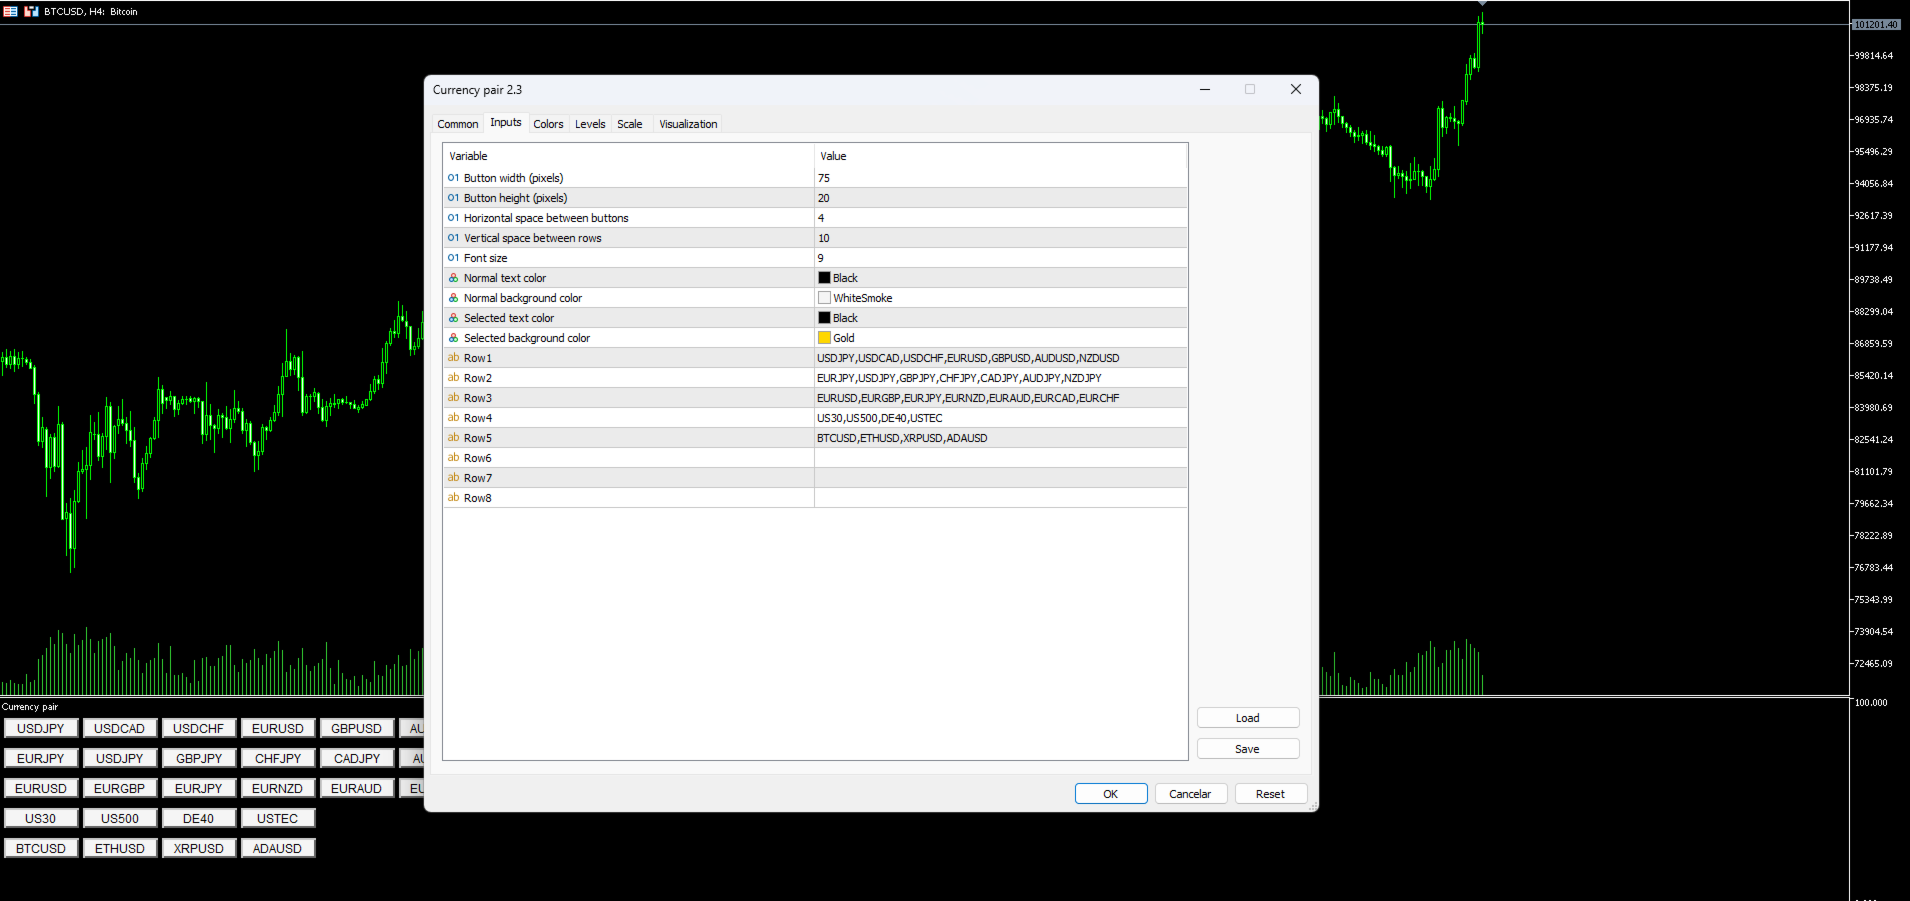
Currency pair

Key Points:

 One-Click Pair Switching – Instantly change between your favorite currency pairs with a single click, eliminating manual searches.

 Fully Customizable Layout – Organize up to 8 rows of trading pairs, adjusting button size, spacing, and colors to fit your workflow.

 Visual Selection Feedback – Clearly highlights the active pair for quick reference, reducing errors in fast-moving markets.

 Optimized for Speed – Lightweight design ensures smooth performance without slowing down your trading platform.

 Works with Any Symbol – Compatible with all Forex pairs, stocks, commodities, and indices available in Market Watch.

 Beginner & Pro-Friendly – Simple setup with intuitive controls, making it ideal for all traders.

Why Traders Love This Indicator:

🚀 Saves Time – No more scrolling through long lists of assets. Switch charts instantly.

📊 Multi-Pair Trading Made Easy – Perfect for technical analysts, scalpers, and news traders who monitor multiple instruments.

🎨 Personalized Appearance – Match the interface to your chart style with customizable colors and sizing.

 Seamless Integration – Works smoothly in all timeframes and chart types without lag.

How It Works:

1️⃣ Set Up Your Pairs – Enter your preferred symbols in the input settings (e.g.,  EURUSD,GBPUSD,XAUUSD ).

2️⃣ Click & Switch – Just tap any button to load the chart immediately.

3️⃣ Stay Organized – Keep your most-traded pairs visible for ultra-fast access.

Ideal For:

  • Forex traders analyzing correlations between majors/minors

  • Multi-timeframe analysts comparing trends

  • News traders jumping between volatile pairs

  • Anyone who wants faster navigation than MT5’s default system


おすすめのプロダクト
Volume Display Indicator – Clean and Powerful Volume Visualization This professional MT5 indicator displays tick volume as a color-coded histogram and automatically adds clear volume labels above each bar for the current trading day. Rising candles are painted blue, falling candles red, giving you instant insight into market strength and momentum. Key Features: Colored volume histogram (blue/red) Automatic volume labels for each bar of the current day Smart scaling for perfect readability Auto-c
Pivot Prof
Paul Anscombe
4.91 (35)
Ulimate MTF Support & Resistance - 5 Star Best Seller  New Year Sale - save $20    (normal price $79) Beginner or Professional our best selling multi-timeframe Pivot Prof will enhance your trading and bring you great trade opportunities with the Support and Resistance levels that professionals use. Pivot trading is a simple effective method for entering and exiting the market at key levels and has been used by professionals for decades and works on all symbols: Forex, Crypto, Stocks, Indicies et
Multi Chart Synchronizer: 究極のマルチチャート同期装置  Multi Chart Synchronizer は、マルチタイムフレーム分析とヒストリカルバックテストを効率化するために設計されたプロフェッショナルグレードの同期ツールです。チャートを手動で調整する手間が省けるため、プライスアクションと戦略策定に集中できます。 主なメリット 履歴バックテストに最適化:   過去の市場データを分析して優位性を高めるトレーダーに最適です。 シームレスなMTF分析:   同じ銘柄の複数のチャートを瞬時に同期します。上位時間枠でトレンドの成立を特定すると、キーを1回押すだけで、下位時間枠のチャートもすべてその瞬間に合わせて同期されます。 多用途アプリケーション:   複数の時間枠にわたってエントリー条件を確認する必要がある裁量トレーダーと EA 開発者の両方にとって不可欠なツールです。 主な特徴 インスタント同期(Qキー):   特定のローソク足にマウスを移動し、   「Q」   キーを押すだけです。その瞬間、同じ銘柄の開いているすべてのチャートに垂直同期ラインが表示されます
If you want test the breakeven indicator contact me here on mql5 and i send to you a demo version active for 1 week. Breakeven line is usefull tool for you trading. The aim of breakeven line is shown graphically the price level where your positions start start to be profitable. There are 2 simple functions in this breakeven indicator : 1- Is possible calculate the breakeven price only for the symbol where you attached the indicator. 2- Is possible calculate the breakeven price for all the po
The Multi Asset Monitor Panel is a game-changer for traders who need to keep an eye on multiple markets simultaneously. This innovative panel allows you to monitor any symbol and any timeframe you need, all within a single, organized interface. With up to three lists of symbols and customizable MT5 templates, you can tailor your monitoring setup to fit your specific trading strategy. What sets the Multi Asset Monitor Panel apart is its flexibility and customization options. You can control the s
The   Correlation Matrix   indicator shows the actual correlation between the selected instruments. The default setting is set to 28 currency pairs, gold, and silver, but the indicator can compare any other symbols. Interpretation of the indicator Positive correlation  (correlation is above 80 %). Negative correlation  (correlation is below -80 %). Weak or no correlation  (correlation is between -80 and 80 %). Main features The indicator shows the actual correlation between the selected instr
MA Distance Histogram
Pablo Filipe Soares De Almeida
MA Distance Histogram MA Distance Histogram は、終値(Close)と移動平均線(Moving Average)の距離をヒストグラム形式で表示する指標で、市場における買いと売りの力を明確に視覚化できます。 正の値(緑のバー)は価格が移動平均線の上にあることを示し、買い圧力(強気)を表します。 負の値(赤のバー)は価格が移動平均線の下にあることを示し、売り圧力(弱気)を表します。 この指標は ATR(Average True Range)を使用して距離を正規化し、異なるボラティリティ条件やあらゆる資産・時間足においてより正確な読み取りを可能にします。その結果、強い動きと弱い動きを比例的に比較できます。 移動平均線をヒストグラムとして使用する利点 トレンドの強さを識別しやすくなります。 価格と移動平均線の距離を明確かつ客観的に視覚化できます。 買われ過ぎ・売られ過ぎの可能性ゾーンを検出するのに役立ちます。 ヒストグラムがゼロラインをクロスするとモメンタムの変化を示します。 トレンドと強さの両方のオシレーターとして機能します。 追加機能 移動平均線の
Simple Japanese candlestick indicator Contains 3 patterns: - bearish engulfing - bullish engulfing - doji Only contains these 3 because after rigorous testing and trading (data) these seem to be the most efficient. Also contains: - alerts if enabled  When japanese candlestick is detected it is colored with relevant color depending on bias, and also shows label next to it. Labels: - BEG = Bearish engulfing - BE = Bullish engulfing - DO = Doji
トレードチャンスを逃したくないけど、ずっとチャートを見続けるのは辛い・・・・ そんなあなたのために、この商品が存在します!! Touch Alert Pro - 商品概要 価格がアラートオブジェクトに到達したら「MetaTrader5」アプリに通知を送るインジケーターです。チャート上のボタンを押して自由にアラートオブジェクトを追加・削除できます。また、アラートオブジェクトごとに通知上限回数を設定することができます。自動売買の機能はないため、トレード補助のツールとしてお使いください。 - 機能説明 ①コントロールパネル 6つのボタンで構成されています。上からボタンの機能を紹介します。 ・水平線作成ボタン:アラート機能を持つ水平線を1つチャート上に設置します。 ・チャネルライン作成ボタン:アラート機能を持つチャネルラインを1つチャート上に設置します。 ・トレンドライン作成ボタン:アラート機能を持つトレンドラインを1つチャート上に設置します。 ・フィボナッチリトレースメント作成ボタン:アラート機能を持つフィボナッチリトレースメントを1つチャート上に設置します。 ・フィボナ
The Standard Deviation (StdDev) indicator drawn using a tick chart. After launching it, wait for enough ticks to come. Parameters: Period - period of averaging. Method - method of averaging. calculated bar - number of bars for the indicator calculation.
Quick Draw Panel lets you instantly draw custom present trading objects (zones and trendlines) instantly with one click from the panel fixed neatly in any chart corner. No more searching through toolbars or menus one click, one object, done. Fully customizable colors, line size, and style.  Ideal For: Institutional / Smart Money Concept (SMC) / Supply and Demand traders. Supply and Demand zone marking. Technical Analysis marking. Liquidity and ICT Order Block marking. Clean, minimalist charting
L3 Banker Fund Flow Trend Oscillator v5 is a simple translation of blackcat's work from pine script (language used by TradingView platform) to mql5. It generates buy and sell signals when two calculated buffers cross over each other in the oversold and overbought oscillator territory. Current version does not offer any changable inputs, but could be easily added in the modified version if requested.
Main purpose:   "Pin Bars"   is designed to automatically detect pin bars on financial market charts. A pin bar is a candle with a characteristic body and a long tail, which can signal a trend reversal or correction. How it works:   The indicator analyzes each candle on the chart, determining the size of the body, tail and nose of the candle. When a pin bar corresponding to predefined parameters is detected, the indicator marks it on the chart with an up or down arrow, depending on the directi
FREE
Pips on Candles shows the number of pips involved in each candle on the chart. It is possible to set 3 different ranges for counting on each single candle via the RangeType parameter: With "HighLow" you count the pips present between the minimum and the maximum. The number is shown under each candlestick on the chart. With "OpenClose" you count the pips present between the opening and closing price of the candle. The number is shown under each candlestick on the chart. With "HighDistAndLowDist"
Chart Background Changer Utility
AL MOOSAWI ABDULLAH JAFFER BAQER
5 (1)
Chart Background Changer Utility v1.90 Professional Chart Customization Tool for MetaTrader 5 Product Description Transform your MetaTrader 5 trading experience with the Chart Background Changer Utility - a professional tool that allows you to personalize your charts with custom backgrounds, images, or colors. Whether you want to create a more visually appealing workspace or reduce eye strain with custom colors, this utility makes it simple and effortless. Key Features Three Background Modes:
Visual Book
Gustavo Barbeiro Alonso
A visual Order Book is a powerful tool used in the financial market to provide a detailed view of buy and sell orders in a given financial instrument in real time. This visual representation allows traders to observe the liquidity available in the market, identify the supply and demand levels at different prices and follow the evolution of orders as they are placed, modified or withdrawn. By analyzing the visual Order Book, traders can identify trading patterns, detect possible reversal point
インディケータは現在のクオートを作成し、これを過去のものと比較して、これに基づいて価格変動予測を行います。インジケータには、目的の日付にすばやく移動するためのテキスト フィールドがあります。 オプション: シンボル - インジケーターが表示するシンボルの選択; SymbolPeriod - 指標がデータを取る期間の選択; IndicatorColor - インジケータの色; HorisontalShift - 指定されたバー数だけインディケータによって描画されたクオートのシフト; Inverse - true は引用符を逆にします。false - 元のビュー。 ChartVerticalShiftStep - チャートを垂直方向にシフトします (キーボードの上下矢印)。 次は日付を入力できるテキストフィールドの設定で、「Enter」を押すとすぐにジャンプできます。
Our Spike Detector is specifically engineered to cater to the unique needs of traders in the Boom and Crash indices markets. This tool is optimized for M1 (1-minute) and M5 (5-minute) timeframes, ensuring you receive timely and actionable insights. Key Features: 1. Non-Repainting**: Our detector guarantees accuracy with non-repainting signals, ensuring your data remains consistent and reliable. 2. Push Notifications**: Stay updated with real-time push notifications, so you never miss a criti
Speed Alert is a professional volatility-based indicator designed to detect fast market movements and high-speed candles in real-time. When the market suddenly accelerates and a candle moves with abnormal speed compared to recent price action, Speed Alert instantly notifies the trader. The indicator continuously analyzes recent candles to calculate the average price speed. When the current candle exceeds the defined speed threshold, it indicates strong momentum and increased volatility, which
MA RSI Trend Precision:プロフェッショナル・トレンドナビゲーター MA RSI Trend Precision は、単なる「サインツール」ではありません。移動平均線(MA)の古典的な信頼性と、RSIのモメンタム確認、そして市場のノイズを低減する独自の**スロープフィルタ(Slope Filter)**アルゴリズムを組み合わせた、包括的な分析スイートです。 なぜこのインジケーターが必要なのか? トレンドインジケーターの最大の課題は、レンジ相場(保ち合い)での「だまし」です。 MA RSI Trend Precision はこれを解決します。トレンドが弱いときはラインがグレーに変わり、真の相場エネルギーが現れたときのみ、鮮やかなブルーまたはレッドに切り替わります。 あらゆるトレードスタイルに対応する柔軟性: スキャルピング (M1-M5): 短いMA期間(例:21と50)に設定し、RSIで素早い反転を捉えます。 デイトレード (H1): 標準設定(50と100)を使用し、スロープフィルタ( Min Slope )を調整して、最も強いセッションのみを抽
ZeroLag T 3 Signal Suite The Ultimate All-in-One Trading   Companion for XAU USD 15-Minute Charts Join the Group Chat -  Community Group Download the Free   Simple Trade Utility  making your pending order placement simple. Unlock the power   of   precision trading with the ZeroLag T 3 Signal Suite —an advanced indicator designed for traders   who demand speed , accuracy, and actionable insights . Built on the renowned Zero Lag T 3 smoothing algorithm, this tool delivers   lightning-fast trend d
CosmiCLab SMC FIBO CosmiCLab SMC FIBO is a professional trading indicator designed for traders who use Smart Money Concepts (SMC), market structure analysis and Fibonacci retracement levels. The indicator automatically detects market swings and builds Fibonacci levels based on the latest impulse movement. It also identifies market structure changes such as BOS (Break of Structure) and CHOCH (Change of Character), helping traders understand the current market direction. CosmiCLab SMC FIBO also pr
Long Short Pro
Thalles Nascimento De Carvalho
Long & Short インジケーター - Pro バージョン: 市場分析の無限の可能性を解き放とう! すべての資産に制限なし Long & Short インジケーターの Pro バージョンは、すべての金融資産に対して完全な自由を提供します。制限なしで、同じインジケーターをお気に入りのすべての資産に適用できます! 制限なし インジケーターのすべての機能を制限なしでお楽しみください。Pro バージョンは、完全かつ無制限の体験を提供し、市場のあらゆる機会を最大限に活用できるようにします。 Pro バージョンの特徴 無制限のアクセス : インジケーターをすべての金融資産で使用し、その完全な可能性を探ります。 高度な精度 : 詳細な分析と明確なシグナルを活用して、情報に基づいた安全な決定を下すことができます。 完全な柔軟性 : 資産や戦略に関係なく、取引のニーズに合わせてインジケーターを調整します。 重要な機会のアラートを受け取る アラートを有効にして、重要なレベルを注意深く監視し、市場機会の最前線に立ち続けましょう。 EA 作成のためのバッファパラメ
FZR indicator determines fractal zigzag reversal pattern of all the time frames of the chosen symbol and shows the information in the Info label. Indicator draws the detected pattern in the chosen time frame and also you can select in the menu to draw the trend line according to FZR peaks. What it is FZR? See the first picture in the screenshots. As you can see for every peak of FZR the AO indicator must cross zero line. FZR indicator determines the trend direction. How to use FZR for trading?
Volume plays a crucial role in trading, serving as a key indicator of market activity and investor sentiment. Here are some important roles of volume in trading: Confirming trends: Dow Theory emphasizes the importance of volume in determining market trends. Larger volume usually indicates greater disagreement between bulls and bears, while smaller volume may indicate higher market agreement with the current price. Capturing institutional moves: By analyzing volume over a period of time, one ca
The US Dollar Index, also known as DXY, is used by traders seeking a measure of the value of USD against a basket of currencies used by US trade partners. The index will rise if the Dollar strengthens against these currencies and will fall if the Dollar weakens against these currencies. Plan your technical analysis of the US Dollar Index by tracking its price in the chart and keep up with the latest market movements with news, advice pieces, and the dollar index forecast. The U.S. dollar index (
VR Grid Mt5
Vladimir Pastushak
3.25 (8)
VR グリッド インジケーターは、ユーザー定義の設定を使用してグラフィカル グリッドを作成するように 設計 されています。 標準グリッド とは異なり、VR グリッドは 円形レベル を構築するために使用されます。ユーザーの選択に応じて、ラウンド レベル間のステップは任意に設定できます。さらに、他のインジケーターやユーティリティとは異なり、VR Grid は期間が変更されたり、端末が再起動されたりした場合でも、 グリッドの位置を維持 します。 設定、設定ファイル、デモ版、説明書、問題解決方法は、以下から入手できます。 [ブログ] レビューを読んだり書いたりすることができます。 [リンク] のバージョン [MetaTrader 4] 垂直レベル は実際の時間間隔に基づいており、 欠落している または存在しない期間は無視します。したがって、レベル間のステップは、ユーザーが選択した値に厳密に対応します。 VR グリッド インジケーターを使用すると、トレーダーは任意のレベルで 垂直線と水平線のスタイル 、色、太さを変更できます。これにより、金融商品の ラウンドレベル を制御できます。 ラウンド
FREE
Price Statistics MT5
Miguel Antonio Rojas Martinez
This indicator works only 5 digits Brokers. It is impossible to talk about the study of the Forex market or any market without considering of that market statistics. In this case, our indicator "price statistics" we have a new way to study our chart, giving information of the price in a range of pips you want to study for example, can we know how many times the price closes or opens into spaces 10, 20, 30, 50, 100 pips or more; and know them not only in numbers but also draws this relationship a
Position Stress Monitor Position Stress Monitor is a utility for MetaTrader 5 designed to visualize position structure and risk conditions directly on the chart through a compact panel. The tool does not attempt to predict the market or generate entry signals. Instead, it focuses on a different problem that many traders encounter in practice: understanding how a group of positions behaves as a whole. In real trading, especially when managing multiple entries or holding both buy and sell positio
Interactive Volume Profile Indicator !! Interactive Volume Profile is a powerful MT5 indicator that brings advanced volume profiling capabilities to your chart, similar to what professional traders use on TradingView. This custom-designed tool allows you to analyze price levels based on traded volume, helping you identify key support and resistance areas, potential breakout points, and optimal entry/exit levels. Key Features: Fully Interactive : Select any chart range with two simple clicks to
このプロダクトを購入した人は以下も購入しています
SuperScalp Pro
Van Minh Nguyen
4.57 (21)
SuperScalp Pro – 高度なマルチフィルタースキャルピングインジケーターシステム SuperScalp Pro は、クラシックな Supertrend と複数のインテリジェント確認フィルターを組み合わせた高度なスキャルピングインジケーターです。M1 から H4 まで複数の時間足で効率的に動作し、XAUUSD、BTCUSD、主要 Forex 通貨ペア向けに最適化されています。 このインジケーターは明確な Buy / Sell シグナルを提供し、ATR に基づいてエントリー価格、Stop Loss、Take Profit を自動計算します。Fibonacci Take Profit 機能により、重要な価格帯で早期決済し、到達時に通知を送信します。 初期設定では Fibonacci Take Profit が有効化されており、より安定した取引体験を重視しています。チャートに適用するだけですぐ利用可能です。上級者向けに、すべてのパラメータは自由にカスタマイズできます。 EMA、RSI、ADX、Volume、VWAP、Bollinger Bands、MACD Divergence な
このインジケーターを購入された方には、以下の特典を 無料 で提供しています: 各トレードを自動で管理し、ストップロスとテイクプロフィットを設定し、戦略ルールに基づいてポジションを決済する補助ツール 「Bomber Utility」 様々な銘柄に合わせたインジケーターの設定ファイル(セットファイル) 「最小リスク」、「バランスリスク」、「待機戦略」 の3つのモードで使用できる Bomber Utility 用の設定ファイル このトレーディング戦略をすぐに導入・設定・開始できる ステップバイステップのビデオマニュアル ご注意: 上記の特典を受け取るには、MQL5のプライベートメッセージシステムを通じて販売者にご連絡ください。 オリジナルのカスタムインジケーター 「Divergence Bomber(ダイバージェンス・ボンバー)」 をご紹介します。これは、MACDのダイバージェンス(乖離)戦略に基づいた 「オールインワン」型のトレーディングシステム です。 このテクニカルインジケーターの主な目的は、価格とMACDインジケーターの間に発生するダイバージェンスを検出 し、将来の価格の動きを示す
Entry In The Zone and SMC Multi Timeframe is a real-time 2-in-1 market analysis tool that combines market structure analysis and a No Repaint BUY / SELL signal system into a single indicator, built on Smart Money Concepts (SMC) — a widely adopted framework used by professional traders to understand market structure. This indicator helps you see the market more clearly, make decisions based on structure rather than guesswork, and focus on high-probability zones where price is more likely to react
Azimuth Pro
Ottaviano De Cicco
5 (6)
Azimuth Pro V2:MT5向けシンセティック・フラクタル構造分析と確認済みエントリー 概要 Azimuth Pro は Merkava Labs によるマルチレベルスイング構造インジケーターです。4つのネストされたスイングレイヤー、スイングアンカーVWAP、ABCパターン検出、3タイムフレーム構造フィルタリング、そして確定バーでの確認済みエントリー — 1つのチャートで、ミクロスイングからマクロサイクルまでを網羅するワークフロー。 これはブラインドシグナル製品ではありません。ロケーション、コンテキスト、タイミングを重視するトレーダーのための構造ファーストワークフローです。 V2発売記念オファー — Azimuth Pro V2をUSD 399で(次の100本)。最終価格:USD 499。 1. V2での変更点 シンセティック・マルチタイムフレームエンジン 上位タイムフレーム分析をMeridian Proと同じ独自のシンセティックアーキテクチャで一から再構築。よりクリーンなHTFコンテキスト、安定したライブ動作、従来のMTF同期問題なし。シンセティックエンジンは 固定比率タ
Quantum TrendPulse を ご紹介します。これは、   SuperTrend   、   RSI   、および Stochastic のパワーを 1 つの包括的なインジケーターに組み合わせて、取引の可能性を最大限に引き出す究極の取引ツールです。精度と効率を求めるトレーダー向けに設計されたこのインジケーターは、市場のトレンド、勢いの変化、最適なエントリー ポイントとエグジット ポイントを自信を持って特定するのに役立ちます。 主な特徴: SuperTrend 統合: 現在の市場動向に簡単に追従し、収益性の波に乗ることができます。 RSI精度: 買われすぎと売られすぎのレベルを検出し、市場の反転のタイミングに最適で、SuperTrendのフィルターとして使用されます。 確率的精度: 確率的振動を活用して、変動の激しい市場で隠れたチャンスを見つけます。SuperTrend のフィルターとして使用されます。 マルチタイムフレーム分析:   M5 から H1 または H4 まで、さまざまなタイムフレームで市場を常に把握します。 カスタマイズ可能なアラート: カスタム取引条件が満たされ
このインジケーターを購入すると、プロ仕様のトレードマネージャーを無料で差し上げます。 まず第一に、このトレーディングシステムがノンリペイント、ノンリドロー、ノンラグのインジケーターであることを強調する価値がある。これにより、手動取引とロボット取引の両方に理想的なものになっています。 オンラインコース、マニュアル、プリセットのダウンロード。 「スマートトレンドトレーディングシステム MT5」は、新規および経験豊富なトレーダー向けにカスタマイズされた包括的なトレーディングソリューションです。10以上のプレミアムインジケーターを組み合わせ、7つ以上の堅実なトレーディング戦略を備えており、多様な市場状況に対応する多目的な選択肢となっています。 トレンドフォロー戦略:トレンドを効果的に乗り越えるための正確なエントリーとストップロス管理を提供します。 リバーサル戦略:潜在的なトレンドの反転を特定し、トレーダーがレンジ相場を活用できるようにします。 スキャルピング戦略:高速で正確なデイトレードおよび短期取引のために設計されています。 安定性:すべてのインジケーターはノンリペイント、ノンリドロー、ノ
Power Candles – あらゆる市場に対応した強度ベースのエントリーシグナル Power Candles は、Stein Investments が長年培ってきた強度分析を価格チャート上に直接反映します。価格だけに反応するのではなく、各ローソク足は実際の市場の強さに基づいて色分けされ、モメンタムの蓄積、強度の加速、明確なトレンド転換を瞬時に把握できます。 すべての市場に共通する単一ロジック Power Candles は すべての取引シンボル で自動的に動作します。現在のシンボルが Forex か非 Forex 市場かを自動判別し、内部で適切な強度モデルを適用します。 Forex および Gold :FX Power のデルタ値を使用(絶対値レンジ最大 100) 指数、暗号資産、CFD :IX Power の強度値を使用(絶対値レンジ最大 50) 必要な強度計算は Power Candles に直接組み込まれています。ローソク足のカラーリングやシグナルロジックに、追加のインジケーターは不要です。 価格ノイズではなく「強度状態」 各ローソク足は、以下の 9 つの明確に定義された強
OmniSync Projection
Antonio-alin Teculescu
5 (1)
Chronos Fractal Engine is an innovative price projection indicator for MetaTrader 5, designed to transform your technical analysis by intelligently identifying and projecting historical price patterns. Built upon an advanced correlation algorithm and the fractal principles of the market, this powerful tool visualizes potential future price movements, giving you a unique edge in your trading decisions. What is Chronos Fractal Engine? At its core, the Chronos Fractal Engine employs a sophisticat
FX Trend NG:次世代マルチマーケット・トレンドインテリジェンス 概要 FX Trend NG は、複数の時間足に対応したプロフェッショナル向けトレンド分析およびマーケット監視ツールです。 市場全体の構造を数秒で把握することができます。 複数のチャートを切り替える必要はありません。どの銘柄がトレンド中なのか、どこでモメンタムが弱まっているのか、そしてどの時間足で強い整合性があるのかを瞬時に確認できます。 ローンチ特別オファー – FX Trend NG を $30(6ヶ月) または $80 永久ライセンス でご利用いただけます。 すでに Stein Investments のユーザーですか? -> メッセージを送信 して、プライベートグループへアクセスしてください。 セットアップや詳細情報が必要ですか? -> Stein Investments 公式ページ をご覧ください。 1. FX Trend NG が他と異なる理由 3ステート・トレンドロジック ― Buy と Sell だけではない • 多くのインジケーターは Buy または Sell の2状態のみを表示します。
Gann Made Easy   は、ミスター・ギャンの理論を使用した取引の最良の原則に基づいた、プロフェッショナルで使いやすい外国為替取引システムです。 W・D・ガン。このインジケーターは、ストップロスとテイクプロフィットレベルを含む正確な買いと売りのシグナルを提供します。 PUSH通知を利用して外出先でも取引可能です。 ご購入後、取引方法の説明と優れた追加インジケーターを無料で入手するには、私にご連絡ください! おそらく、ギャンの取引手法についてはすでに何度も聞いたことがあるでしょう。通常、ギャンの理論は初心者のトレーダーだけでなく、すでにある程度の取引経験がある人にとっても非常に複雑なものです。なぜなら、ギャンの取引手法は理論的にはそれほど簡単に適用できるものではないからです。私はその知識を磨き、最良の原則を私の外国為替インジケーターに組み込むために数年を費やしました。 このインジケーターは非常に簡単に適用できます。必要なのは、それをチャートに添付し、簡単な取引推奨事項に従うだけです。このインジケーターは常に市場分析の仕事を行い、取引の機会を探します。適切なエントリーポイントを検
ご紹介     Quantum Breakout PRO は 、ブレイクアウト ゾーンの取引方法を変革する画期的な MQL5 インジケーターです。 13年以上の取引経験を持つ経験豊富なトレーダーのチームによって開発されました。     クォンタム ブレイクアウト プロ   は、革新的でダイナミックなブレイクアウト ゾーン戦略により、あなたのトレーディングの旅を新たな高みに押し上げるように設計されています。 クォンタム ブレイクアウト インジケーターは、5 つの利益ターゲット ゾーンを備えたブレイクアウト ゾーン上のシグナル矢印と、ブレイクアウト ボックスに基づいたストップロスの提案を提供します。 初心者トレーダーにもプロのトレーダーにも適しています。 量子EAチャネル:       ここをクリック 重要!購入後、インストールマニュアルを受け取るためにプライベートメッセージを送ってください。 推奨事項: 時間枠: M15 通貨ペア: GBPJPY、EURJPY、USDJPY、NZDUSD、XAUUSD アカウントの種類: ECN、Raw、またはスプレッドが非常に低い R
CGE Trading Suite
Carl Gustav Johan Ekstrom
5 (2)
Institutional-Grade Analytics for MT5 C GE Trading Suite delivers the analytical edge typically reserved for professional trading desks. The platform integrates a full suite of analytical tools into one seamless workflow: dynamic grid mapping, liquidity behavior analysis, ECM, trend lines, MIDAS, trade cycles, and directional channel projections. Together, these provide a unified view of market structure and momentum. Directional clarity is further enhanced by the capital flow index, which meas
まず正直に言いましょう。 どんなインジケーターも、それ単体であなたを利益化させることはできません。もしそう言う人がいるなら、それは夢を売っているだけです。完璧な売買シグナル(矢印)を表示するインジケーターは、いくらでも“完璧に見せる”ことができます。正しい過去の区間を拡大して、勝ちトレードだけを切り取ればいいだけです。私たちはそれをしません。 SMC Intraday Formula はツールです。 市場構造を読み取り、最も高い確率の価格ゾーンを特定し、今この瞬間のスマートマネーの痕跡をシンプルな言葉で正確に示します。最終判断はあなたが行います。トレードを実行するのもあなたです。しかし今は「希望」ではなく「精度」でエントリーできます。 私たちはこのインジケーターを、ゴールド(XAUUSD)および主要FX通貨ペアで約3年間、日々のスキャルピングに使用してきました。M1、M5、M15、M30の主要ツールです。これは未来を予測しようとするのではなく、今まさに形成されている高確率セットアップを示し、その理由を説明します。 他のすべてのインジケーターと何が違うのか? ほとんどのトレーディングイ
あなたのシンボルでどの戦略が実際に機能するか確認しましょう - リアルマネーをリスクにさらす前に。 Power Barは、あらゆるシンボルとあらゆるタイムフレームで 極端な価格バー を検出し、3つの異なるトレード戦略を即座にバックテストします。勝率、プロフィットファクター、損益を並べて比較できます。すべてが1つのインタラクティブなパネルに集約されています。 推測なし。カーブフィッティングなし。データだけです。 Power Barが特別な理由 ほとんどのインジケーターはシグナルを出すだけで、それが機能するかどうかは推測に任されます。Power Barはさらに先を行きます - すべてのシグナルを 3つの戦略 に対してテストし、統計を表示します。FlipFlop、Momentum、Reversalをワンクリックで切り替え、数値が即座に変化するのを確認できます。 FlipFlop - 常にポジションを保有。シグナルでエントリーし、反対シグナルでイグジット。当社のリサーチでは、US30、US500、DAXなどのトレンドのあるインデックスで最も効果的です。 Momentum - シグナルの方向に
優れたテクニカルインジケーター「Grabber」をご紹介します。これは、すぐに使える「オールインワン」トレーディング戦略として機能します。 ひとつのコードに、市場のテクニカル分析ツール、取引シグナル(矢印)、アラート機能、プッシュ通知が強力に統合されています。 このインジケーターを購入された方には、以下の特典を無料で提供します: Grabberユーティリティ:オープンポジションを自動で管理するツール ステップバイステップのビデオマニュアル:インジケーターのインストール、設定、取引方法を解説 カスタムセットファイル:インジケーターをすばやく自動設定し、最大限の成果を出すための設定ファイル 他の戦略はもう忘れてください!Grabberだけが、あなたを新たなトレードの高みへと導いてくれるのです。 Grabber戦略の主な特徴: 推奨タイムフレーム:M5〜H4 対応通貨ペア・資産:どれでも使用可能ですが、私が実際に検証した以下を推奨します(GBPUSD、GBPCAD、GBPCHF、AUDCAD、AUDUSD、AUDSGD、AUDCHF、NZDUSD、NZDCAD、EURCAD、EURUSD、E
まず第一に、この取引インジケーターは再描画されず、再描画されず、遅延しないことを強調する価値があります。これにより、手動取引とロボット取引の両方に理想的なものになります。 ユーザーマニュアル:設定、入力、戦略。 アトミックアナリストは、価格の強さとモメンタムを利用して市場でより良いエッジを見つけるためのPA価格アクションインジケーターです。ノイズや誤ったシグナルを除去し、取引ポテンシャルを高めるための高度なフィルターを備えています。複雑なインジケーターの複数のレイヤーを使用して、アトミックアナリストはチャートをスキャンし、複雑な数学的計算をシンプルなシグナルと色に変換します。これにより、どのような初心者トレーダーでも理解して使用し、一貫した取引の決定を行うことができます。 「アトミックアナリスト」は、新規および経験豊富なトレーダー向けにカスタマイズされた包括的な取引ソリューションです。プレミアムインジケーターとトップノッチの機能を1つの取引戦略に組み合わせ、すべてのタイプのトレーダーにとって汎用性のある選択肢にします。 デイリートレーディングとスキャルピング戦略:高速で正確なデイ
FX Power: 通貨の強弱を分析して、より賢い取引を実現 概要 FX Power は主要通貨と金の実際の強弱をあらゆる市場状況で理解するための必須ツールです。強い通貨を買い、弱い通貨を売ることで、 FX Power は取引の意思決定を簡素化し、高い確率の取引機会を見出します。トレンドを追従する場合でも、極端なデルタ値を使用して反転を予測する場合でも、このツールはあなたの取引スタイルに完全に適応します。ただ取引するだけではなく、 FX Power で賢く取引をしましょう。 1. なぜ FX Power がトレーダーにとって非常に有益なのか 通貨と金のリアルタイム強弱分析 • FX Power は主要通貨と金の相対的な強弱を計算し、マーケットダイナミクスに関する明確な洞察を提供します。 • どの資産がリードしているか、または後れを取っているかを監視して、取引するペアを賢く選びましょう。 マルチタイムフレームの包括的なビュー • 短期、中期、長期のタイムフレームで通貨と金の強弱を追跡し、マーケットトレンドに基づいて取引戦略を調整できます。 • スキャルピングからスイングトレード
Bill Williams Advanced is designed for automatic chart analysis using Bill Williams' "Profitunity" system. The indicator analyzes four timeframes at once. Manual (Be sure to read before purchasing) Advantages 1. Analyzes the chart using Bill Williams' "Profitunity" system. Signals are displayed in a table in the corner of the screen and on the price chart. 2. Finds all known AO and AC signals, as well as zone signals. Equipped with a trend filter based on the Alligator. 3. Finds "Divergence Bar
トレンド スクリーナー インジケーターでトレンド取引の力を解き放ちます。ファジー ロジックと複数通貨システムを活用した究極のトレンド取引ソリューションです。 ファジー ロジックを活用した革新的なトレンド インジケーターである Trend Screener を使用して、トレンド取引を向上させます。 これは、13 を超えるプレミアム ツールと機能、および 3 つの取引戦略を組み合わせた強力なトレンド追跡インジケーターであり、Metatrader をトレンド アナライザーにする多用途の選択肢となります。 期間限定オファー : トレンド スクリーナー インジケーターは、わずか 100 ドルで生涯ご利用いただけます。 (元の価格 50$ ) (オファー延長) Trend Screener の 100% 非再描画精度の揺るぎない精度を体験して、取引の決定が過去の価格変動の影響を受けないようにしてください。 マルチタイムフレームおよびマルチ通貨機能の多用途性を解放し、比類のない自信を持って外国為替、商品、暗号通貨、インデックスの世界を取引できるようにします。 Trend Screener の包括的な
BTMM State Engine Pro is a MetaTrader 5 indicator for traders who use the Beat The Market Maker approach: Asian session context, kill zone timing, level progression, peak formation detection, and a multi-pair scanner from a single chart. It combines cycle state logic with a built-in scanner dashboard so you do not need the same tool on many charts at once. What it does Draws the Asian session range; session times can follow broker server offset or be set in inputs. Tracks level progression (L
SignalTech MT5 is a trading system for EURUSD, USDCHF, USDJPY, AUDUSD, NZDUSD, EURJPY, AUDJPY, NZDJPY, CADJPY H2 and H3 Timeframe.  It can generate signals with Buy/Sell Arrows and Pop-Up/Sound Alerts. Each signal has clear Entry and Stop Loss levels, which should be automatically flagged on the chart, as well as potential Targets 1, 2, and 3. The Entry and TP levels are fixed after the trade is taken. The exit level is dynamic. If there are signs of a potential short-term trend reversal, the
Crystal Heikin Ashi Signals - Professional Trend & Signal Detection Indicator Advanced Heikin Ashi Visualization with Intelligent Signal System for Manual & Automated Trading Final Price: $149 ---------> Price goes up $10 after every 10 sales . Limited slots available — act fast . Overview Crystal Heikin Ashi Signals is a professional-grade MetaTrader 5 indicator that combines pure Heikin Ashi candle visualization with an advanced momentum-shift detection system. Designed for both manual traders
Berma Bands
Muhammad Elbermawi
5 (8)
Berma Bands (BBs) インジケーターは、市場のトレンドを特定して活用したいトレーダーにとって貴重なツールです。価格と BBs の関係を分析することで、トレーダーは市場がトレンド段階にあるか、レンジ段階にあるかを判断できます。 詳細については、[ Berma Home Blog ] をご覧ください。 バーマ バンドは、上部バーマ バンド、中部バーマ バンド、下部バーマ バンドの 3 つの異なる線で構成されています。これらの線は価格の周りにプロットされ、全体的な傾向に対する価格の動きを視覚的に表します。これらのバンド間の距離から、ボラティリティや潜在的な傾向の反転についての洞察を得ることができます。 バーマ バンドの線がそれぞれ離れると、市場が横ばいまたはレンジ相場の期間に入っていることを示すことがよくあります。これは、明確な方向性の偏りがないことを示しています。トレーダーは、これらの期間中にトレンドを特定するのが難しいと感じる可能性があり、より明確なトレンドが出現するまで待つ場合があります。 バーマ バンドの線が 1 本の線に収束すると、強いトレンド環境の兆候となること
Meridian Pro
Ottaviano De Cicco
5 (1)
Meridian Pro:MT5用プロフェッショナル・マルチタイムフレーム・トレンドマトリックス 概要 Meridian Pro は Merkava Labs が開発したマルチタイムフレーム・トレンドマトリックスで、方向性の状態、強度、モメンタムの状況、マトリックスの合意をひとつのコンパクトなパネルに集約します。ひとつのアダプティブエンジンがM1からW1まで一貫して適用されます。シンボルごとの調整は不要。インジケーターの積み重ねも不要。すべてのアセットとすべてのタイムフレームをカバーするひとつの構造化された読み取りです。 発売キャンペーン — Meridian Proを USD 99 (導入価格)で入手。通常価格:USD 149 。 1. Meridian Proが他と異なる理由 ひとつのエンジン、バラバラなインジケーターのダッシュボードではない 多くのMTFダッシュボードは、タイムフレームごとに生のインジケーター値を繰り返すだけです。Meridian Proはマトリックス全体でひとつのアダプティブ・トレンドエンジンを使用するため、パネルの各行が同じ構造化フレームワークから導出されます
Auto Optimized Parabolic RSI: 高度な3Dモメンタムエンジン ほとんどのリテール向けインジケーターは、市場のボラティリティが変化した瞬間に破綻する静的な入力値に依存しているため、失敗に終わります。Auto Optimized Parabolic RSIは、自らの数学的優位性を継続的に再計算することで「インジケーターの陳腐化」問題を解決し、機関投資家レベルの定量的適応力をMT5ターミナルに直接もたらします。 最大の強み: カスタムインメモリ3D最適化 標準的な自動最適化ツールは、インジケーターの呼び出しで端末に過負荷をかけるため、頻繁にMT5プラットフォームをフリーズさせます。本ツールは、このボトルネックを完全に回避しています。RAMベースのカスタムネイティブ計算機を内蔵した内部エンジンは、チャートを読み込んだりタイムフレームを変更したりするたびに、超高速の3Dグリッド探索を実行します。RSI期間(頻度)、SARステップ(加速度)、SAR最大値(制限速度)を同時にスイープし、プラットフォームを遅延させることなく、数万通りものパラメーターの組み合わせを絶対的なミ
ARICoin is a powerful trading companion designed to generate high-probability entry signals with dynamic TP/SL/DP levels based on volatility. Built-in performance tracking shows win/loss stats, PP1/PP2 hits, and success rates all updated live. Key Features: Buy/Sell signals with adaptive volatility bands Real-time TP/SL/DP levels based on ATR Built-in MA Filter with optional ATR/StdDev volatility Performance stats panel (Success, Profit/Loss, PP1/PP2) Alerts via popup, sound, push, or email Cust
IX Power MT5
Daniel Stein
4.92 (13)
IX Power: 指数、商品、暗号資産、外国為替市場の洞察を発見 概要 IX Power は、指数、商品、暗号資産、外国為替市場の強弱を分析するための多用途ツールです。 FX Power が全ての利用可能な通貨ペアデータを活用して外為ペアで最高の精度を提供する一方、 IX Power は基礎資産の市場データにのみ焦点を当てています。この特性により、 IX Power は非外為市場に最適であり、単純な外為分析にも信頼性の高いツールです。どのチャートでもスムーズに機能し、取引判断を向上させるための明確で実行可能な洞察を提供します。 1. IX Power がトレーダーにとって価値がある理由 複数市場での強弱分析 • IX Power は指数、商品、暗号資産、外為シンボルの強弱を計算し、それぞれの市場に合わせた洞察を提供します。 • US30、WTI、ゴールド、ビットコイン、または通貨ペアなどの資産を監視して取引機会を発見できます。 幅広い市場に適応 • 外為取引では、 FX Power が関連する全ての通貨ペアを分析することで比類のない精度を提供します。 • IX Power
MERAVITH SCANNERは、MetaTrader 5用のプロフェッショナルな金融市場インジケーターで、複数の分析ツールを一つの統合システムにまとめています。独自の出来高加重平均価格(VWAP)手法を使用してすべての計算を自動で行い、主観的な解釈を完全に排除します。 このインジケーターは、すべての資産クラス(FX、株式、指数、商品、暗号通貨)およびM1から月足までのすべての時間軸で動作します。基本原理は「価格は出来高に従う」というものです。MERAVITHは機関投資家の出来高が集中するポイントを特定し、その集中から数学的に正確な価格レベルを導き出します。予測や投機は行わず、計算のみを行います。 MERAVITH SCANNERを使用すると、28の主要FX通貨ペアをすべての時間軸でわずか2~3分でスキャンできます。また、任意の市場をスキャンすることも可能です。例えば、約100銘柄の株式を約10分でスキャンできます。 インジケーターは、消耗レベル、均衡線、偏差、統計レベル、およびターゲット予測を算出します。 チャート要素 Origin Point :すべての計算が始まる起点です。イン
Market Structure Patterns
Samuel Manoel De Souza
4.47 (19)
Available for   MT4   and   MT5 . Join the Market Structure Patterns channel to download materials available for study and/or additional informations. Related posts: Market Structure Patterns - Introduction Beyond Fancy Order Blocks: Using True Volumetric Analysis with Market Structure Patterns & Timeless Charts Market Structure Patterns – Complete SMC Indicator Guide (Concepts + Settings) Market Structure Patterns   is an indicator based on   smart money concepts   that displays   SMC/ICT   e
FX Levels: あらゆる市場における非常に高精度なサポート&レジスタンス 概要 通貨ペア、株式指数、個別銘柄やコモディティなど、どのような市場でも信頼できるサポートとレジスタンスを特定したいですか? FX Levels は伝統的な “Lighthouse” メソッドと先進的な動的アプローチを融合し、ほぼ汎用的な精度を実現します。ブローカーの実務経験を活かし、自動化されたデイリー更新とリアルタイム更新を組み合わせることで、 FX Levels は反転ポイントを見つけ、利益目標を設定し、自信をもってトレードを管理するための手助けをします。今すぐ試してみて、サポート/レジスタンス分析の正確性がどれほどトレードを向上させるかを実感してください! 1. FX Levels がトレーダーにとって非常に有用な理由 非常に正確なサポート&レジスタンスゾーン • FX Levels は異なるブローカー環境でもほぼ同一のゾーンを生成するよう設計されており、データフィードの差異や時刻設定のずれによる不一致を解消します。 • つまり、どのブローカーを利用していても一貫したレベルが得られるため、戦
フィルタ:
レビューなし
レビューに返信