Quantitative and Qualitative Estimation MT4
Quantitative and Qualitative Estimation (QQE) indicator MT4
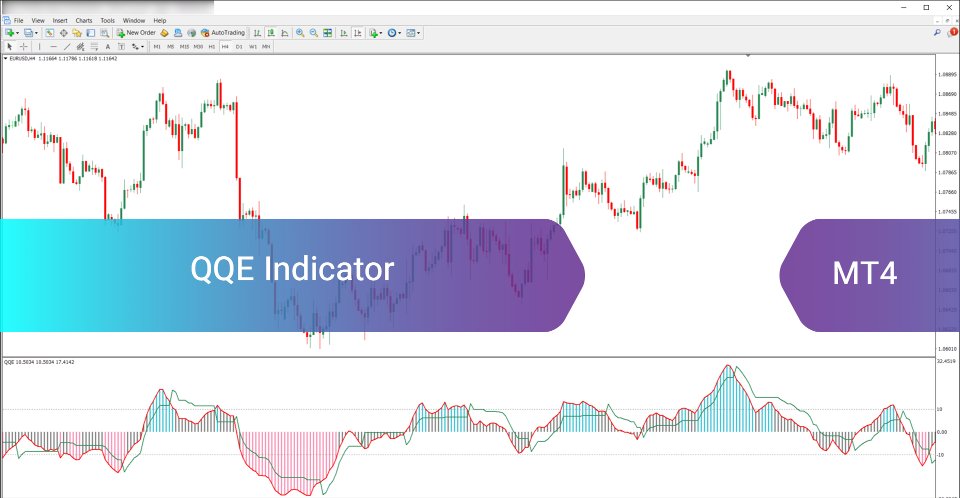
The Quantitative and Qualitative Estimation (QQE) indicator MT4 is a reliable analytical tool used for detecting market trends and generating trade entries with enhanced precision. It functions within MetaTrader 4 and integrates both quantitative metrics and qualitative evaluation through advanced smoothing algorithms to reduce noise and minimize false triggers. This indicator is derived from the Relative Strength Index (RSI) and visualized through two smoothed signal lines.
«Indicator Installation & User Guide»
MT4 Indicator Installation | Quantitative and Qualitative Estimation MT5 | ALL Products By TradingFinderLab | Best MT4 Indicator: Refined Order Block Indicator for MT4 | Best MT4 Utility: Trade Assistant Expert TF MT4 | TP & SL Tool: Risk Reward Ratio Calculator RRR MT4 | Money Management: Easy Trade Manager MT4 | Trade Copier: Free Fast Local Trade Copier MT4
Indicator Specifications Table
| Category | Oscillator – Strength – Trend Signal |
| Platform | MetaTrader 4 |
| Skill Level | Intermediate |
| Indicator Type | Trend Continuation – Reversal |
| Time Frame | Multiple Timeframes |
| Trading Style | Day Trading |
| Markets | Forex – Crypto – Stocks |
General Functionality
A key strength of the QQE indicator lies in its divergence detection capability. It identifies bullish divergence when the indicator forms descending lows while price action produces ascending lows, signaling potential bullish reversal. Conversely, a bearish divergence is noted when the indicator line shows falling highs while the price marks rising highs, indicating weakening upward momentum.
Bullish Scenario Analysis
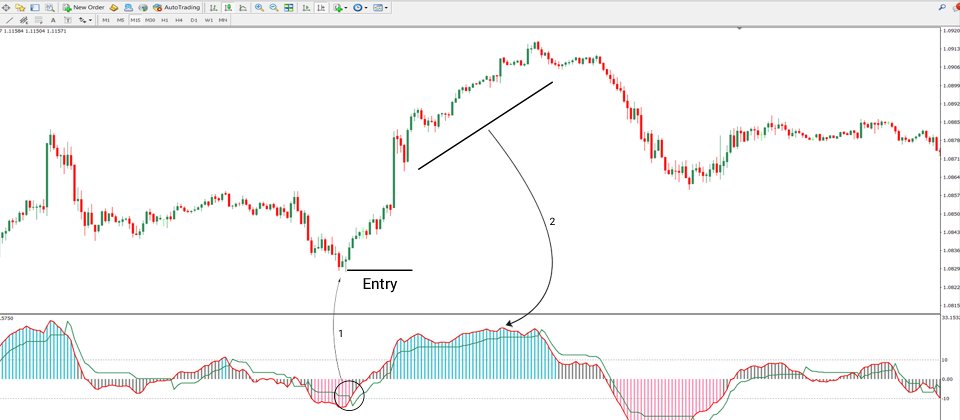
In the 15-minute EUR/USD chart, the Quantitative and Qualitative Estimation (QQE) indicator MT4 demonstrates a bullish setup. As marked by the first arrow, the faster QQE line (in red) crosses above the slower QQE line (in green) and moves beyond the midline. This crossover may signal a shift toward bullish dominance. The second arrow highlights a situation where both lines hover above the 50 level, reinforcing positive momentum without divergence.
Bearish Scenario Analysis
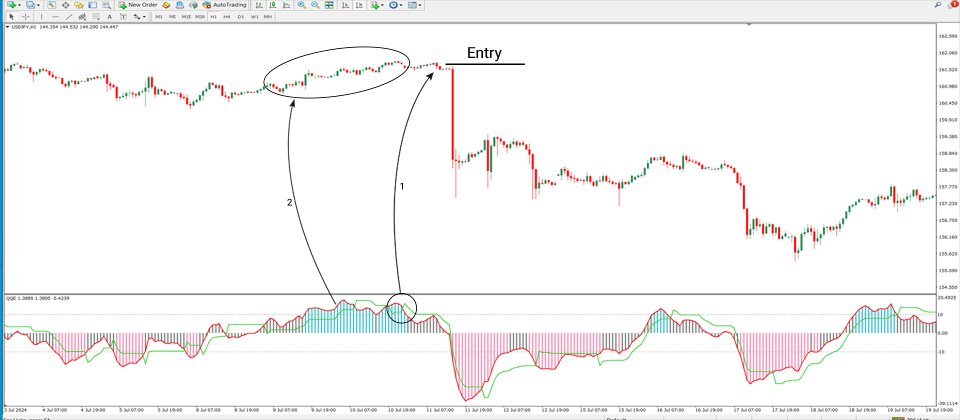
The one-hour chart of USD/JPY illustrates how this indicator behaves during a downward trend. Arrow 1 shows the fast QQE line descending below the slow QQE line and approaching the zero threshold, a potential entry for short trades. Arrow 2 indicates a bearish divergence occurring shortly before a sharp decline, aligning with weakening price action.
Configuration Options
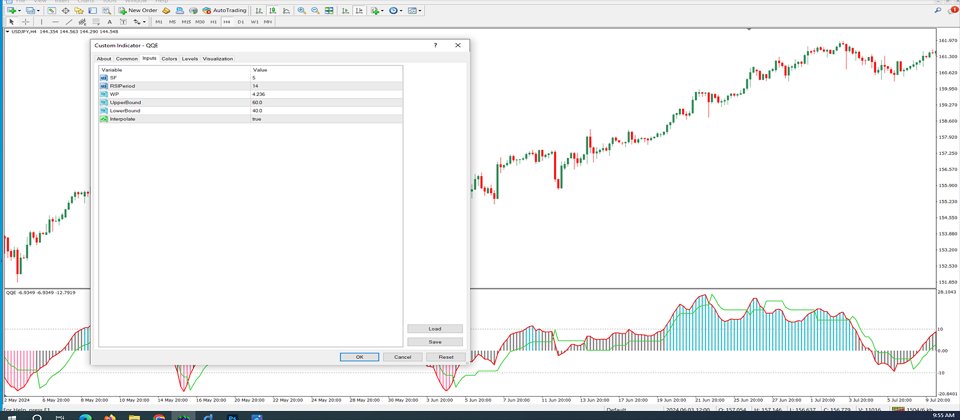
- SF: Smoothing factor applied during the line calculations.
- RSI Period: Determines the calculation window for RSI values.
- WP: Controls the EMA smoothing for RSI transformation.
- Upper Bound: Threshold setting for identifying overbought territory.
- Lower Bound: Threshold setting for identifying oversold conditions.
- Interpolate: Controls the interpolation of values for smoother chart display.
Summary
The Quantitative and Qualitative Estimation (QQE) indicator MT4 offers a versatile and adaptable solution for traders looking to improve accuracy in trade entries. Its combination of RSI foundations and refined smoothing filters makes it ideal for those using structured technical strategies across various financial markets.
