Volume Thermal Vision

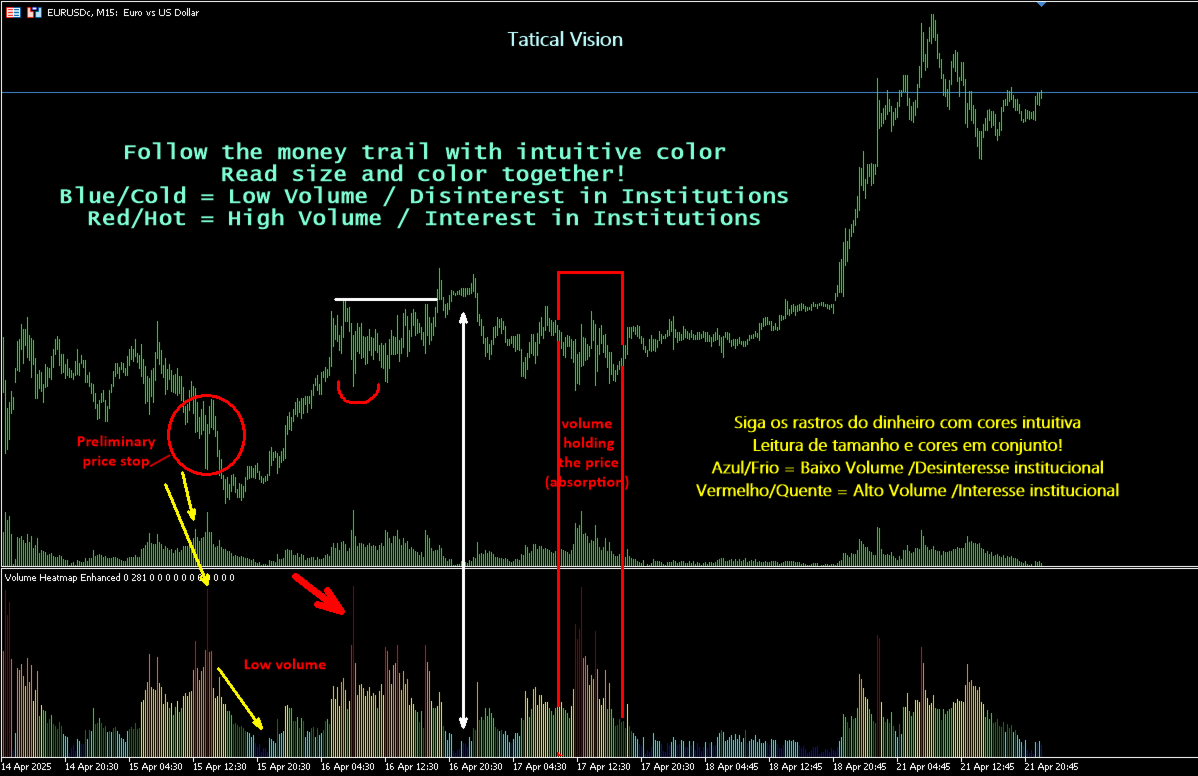
Volume Thermal Visionでボリュームの力を体感

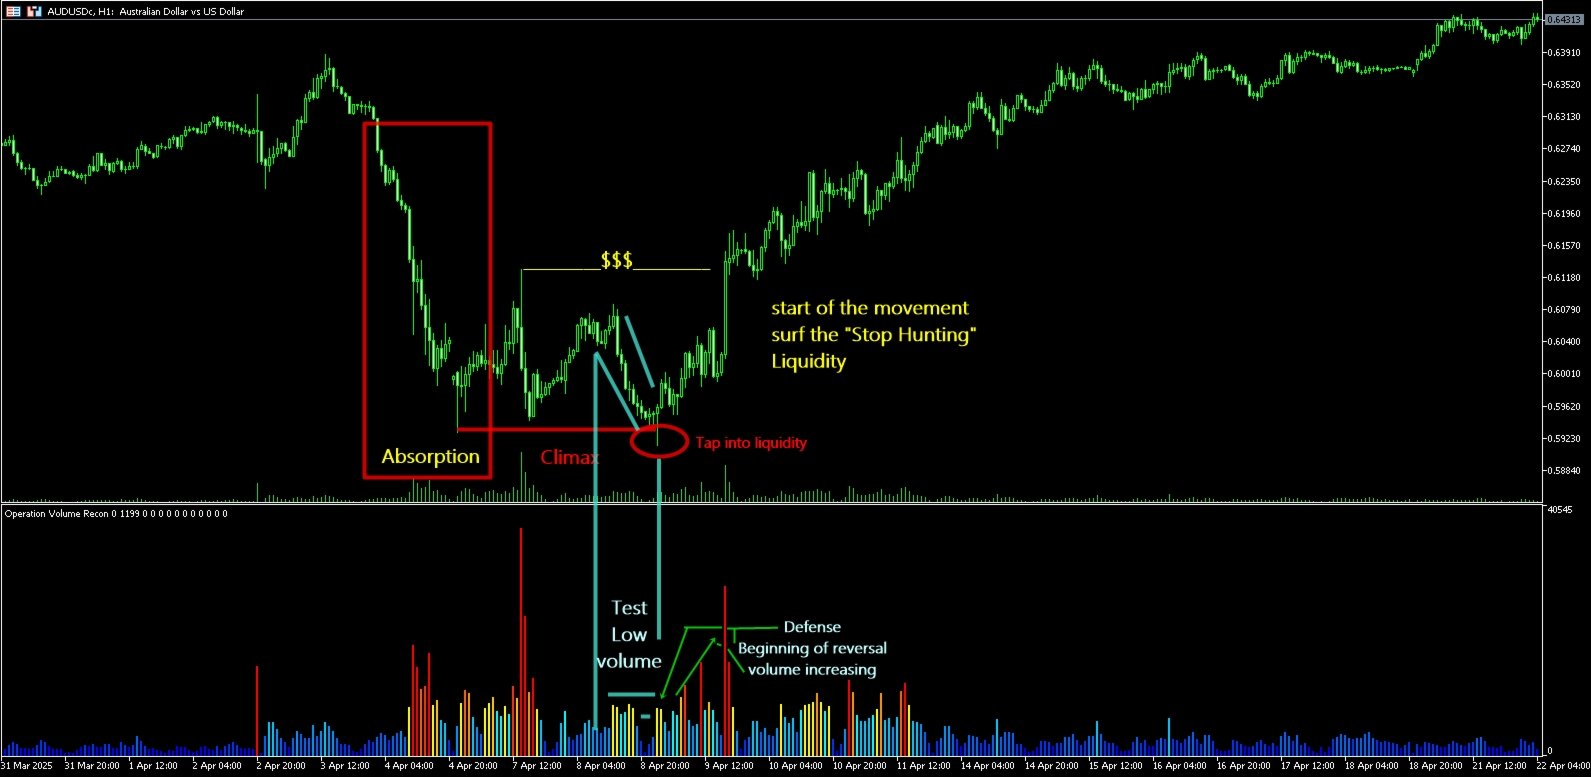
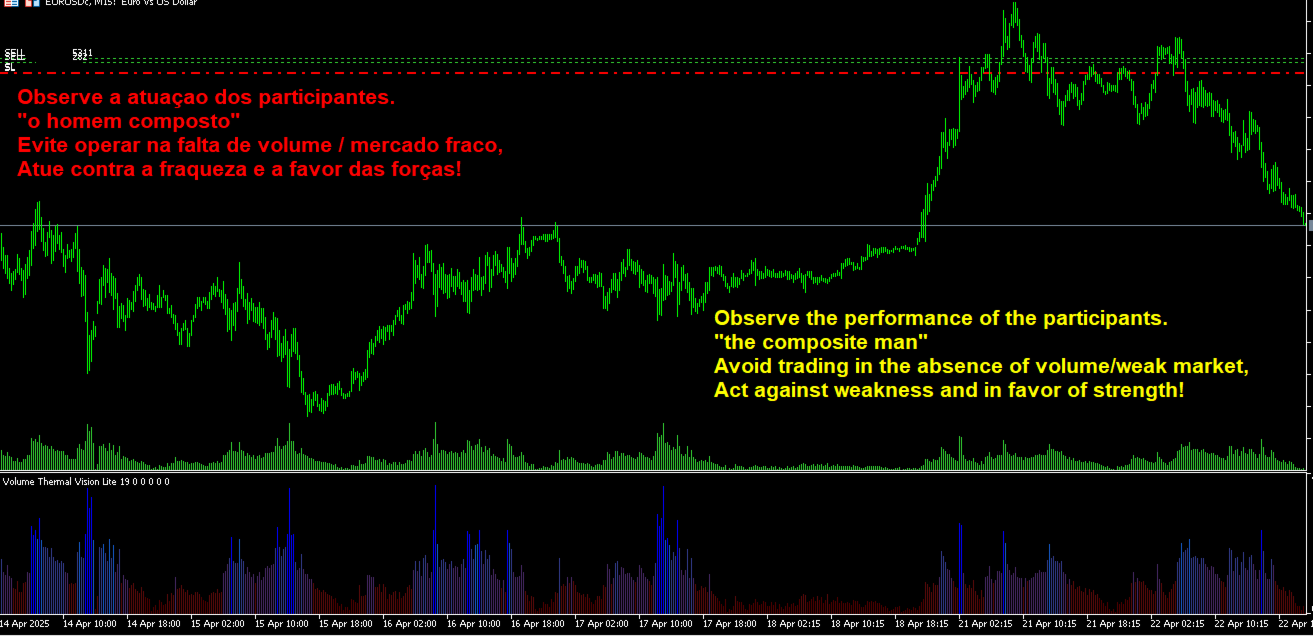
トレーディングを次のレベルへ引き上げる準備はできていますか?MetaTrader 5用の究極のボリュームインジケーター、Volume Thermal Visionを紹介します。ボリューム分析を戦略的優位に変えるこのインジケーターは、高確率のトレード機会を見極めたいトレーダー向けに開発され、VSA(Volume Spread Analysis)、ICT(Inner Circle Trader)、SMC(Smart Money Concepts)、Wyckoffなどの手法に最適です。EURUSD、GBPUSD、US30などの通貨ペア/インデックスの市場動向を解読するのに役立ちます。

なぜVolume Thermal Visionを選ぶのか?

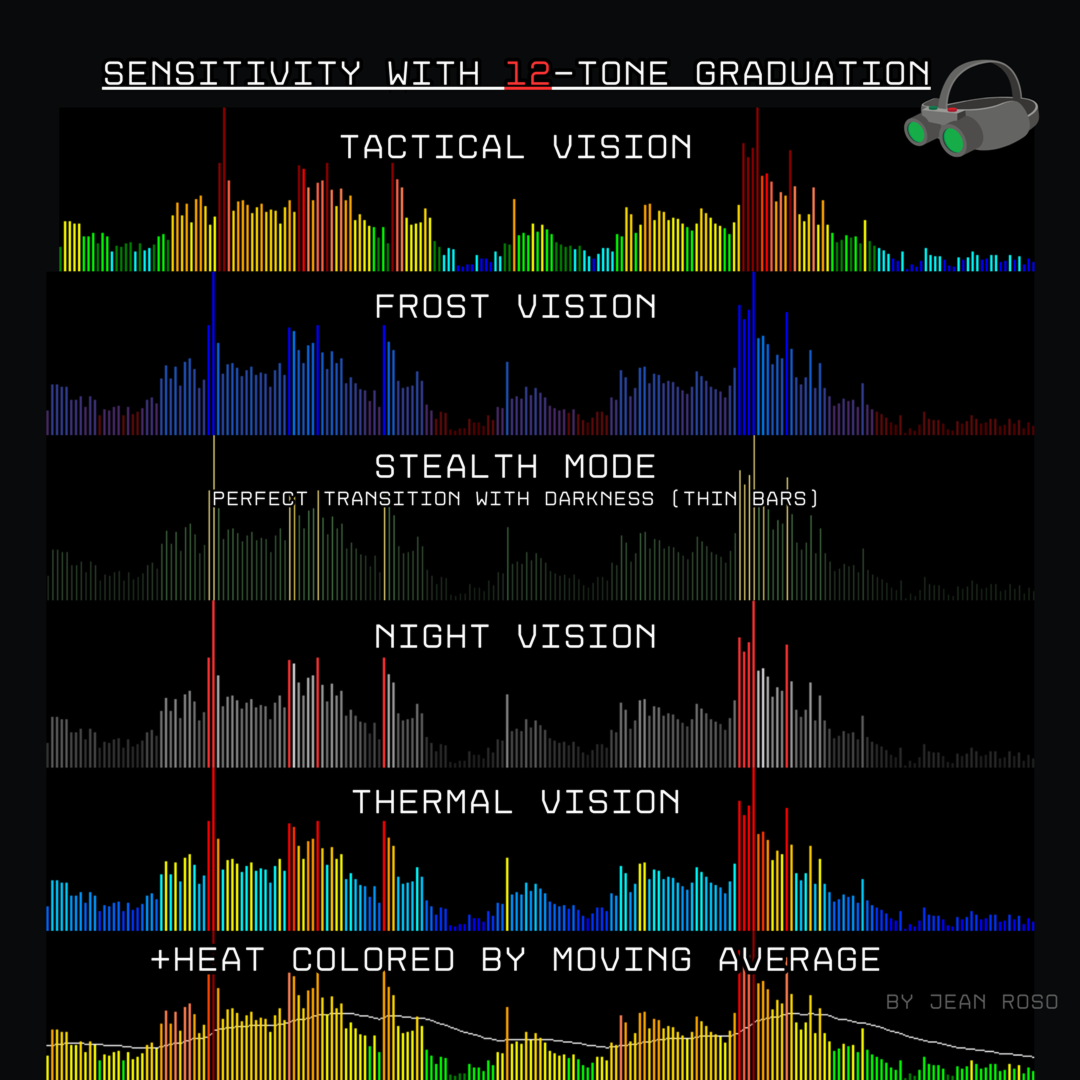
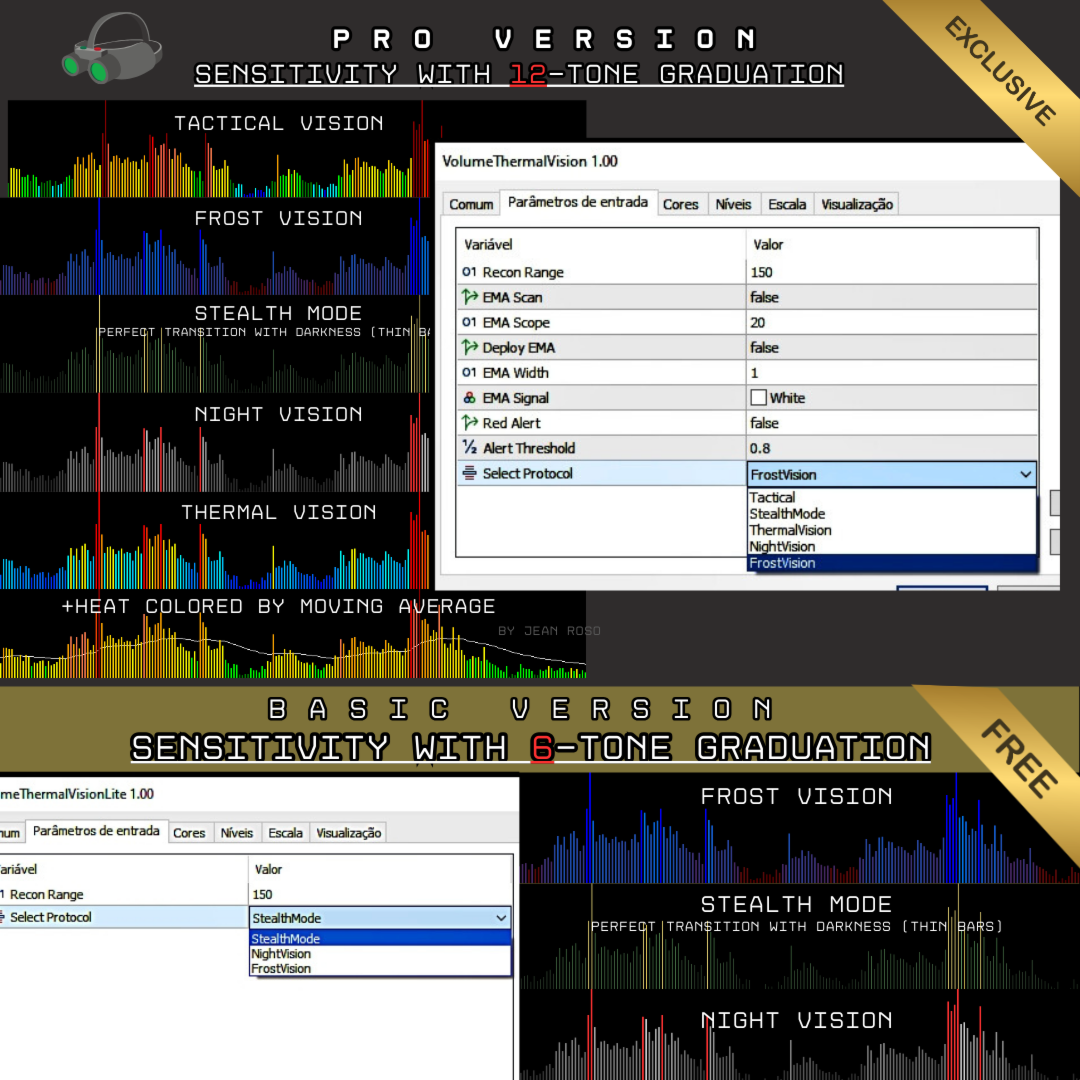
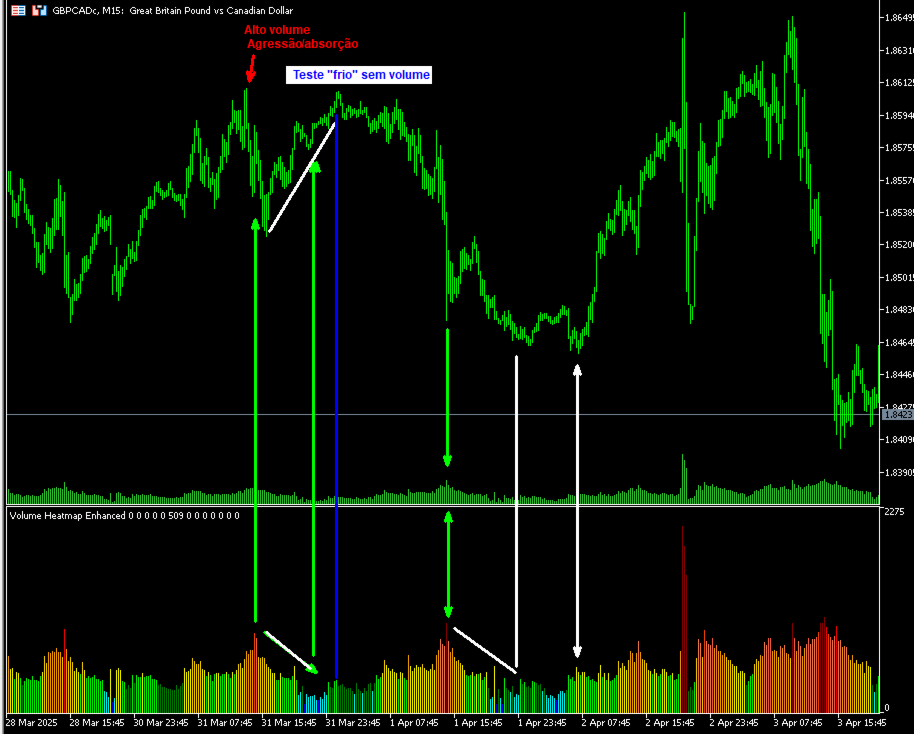
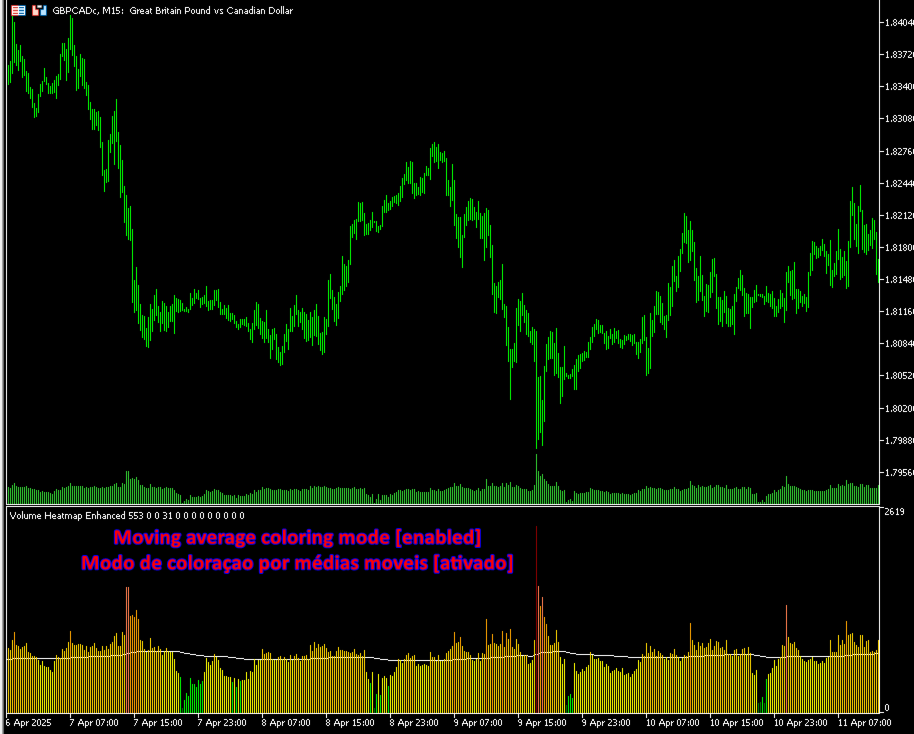
  • 高度なボリューム分析: 12段階のカラーレベルでボリュームの強弱を可視化し、蓄積、分配、機関トレーダーの動きを鮮明に捉えます。

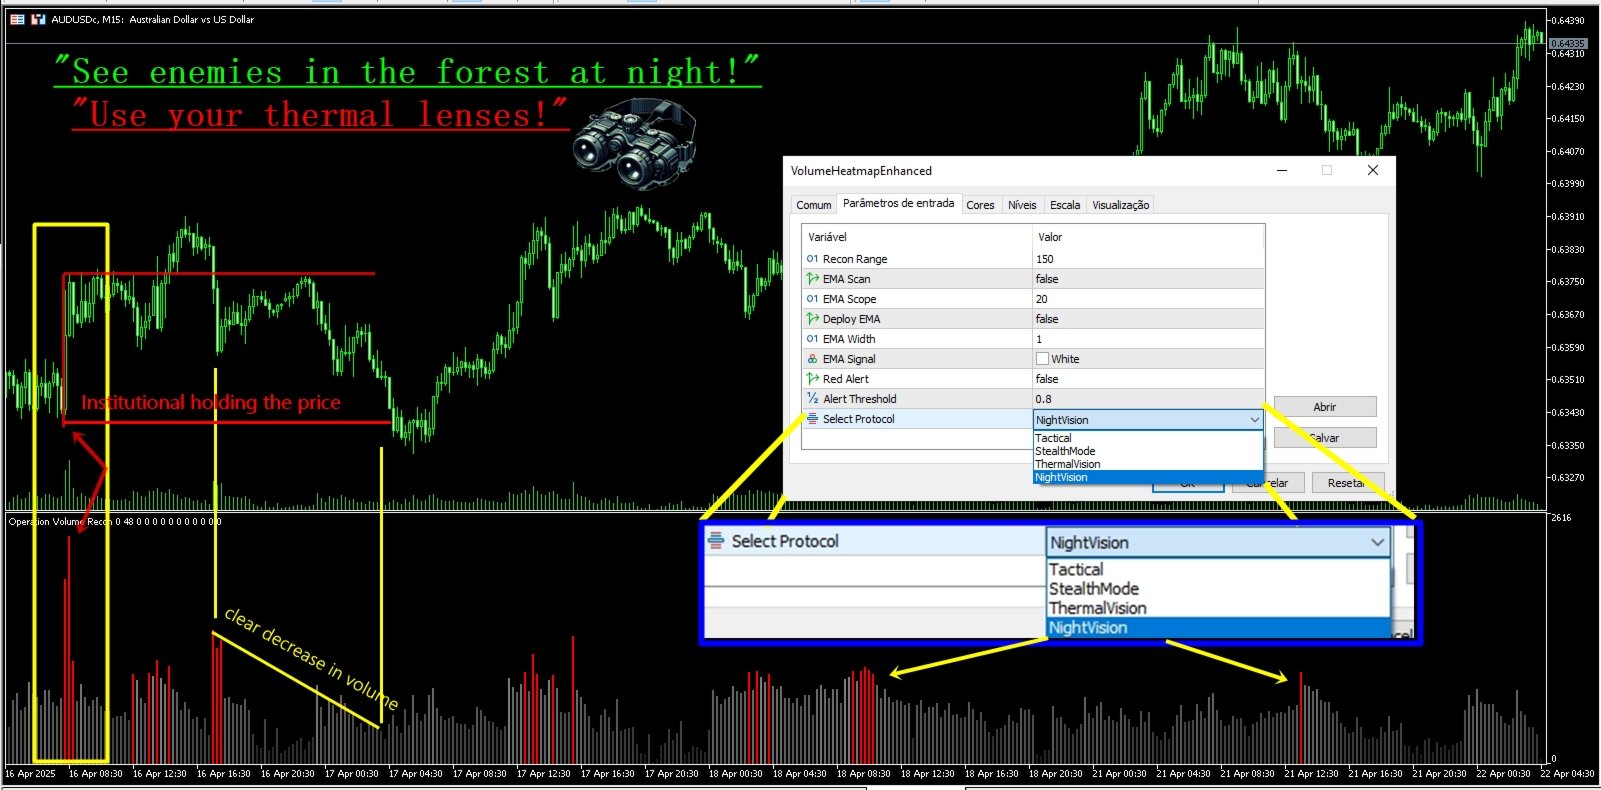
  • 独自のビジュアルプロトコル: Tactical、StealthMode、ThermalVision、NightVisionの4モードから選択可能。あなたのトレーディングスタイルに合わせて表示をカスタマイズできます。

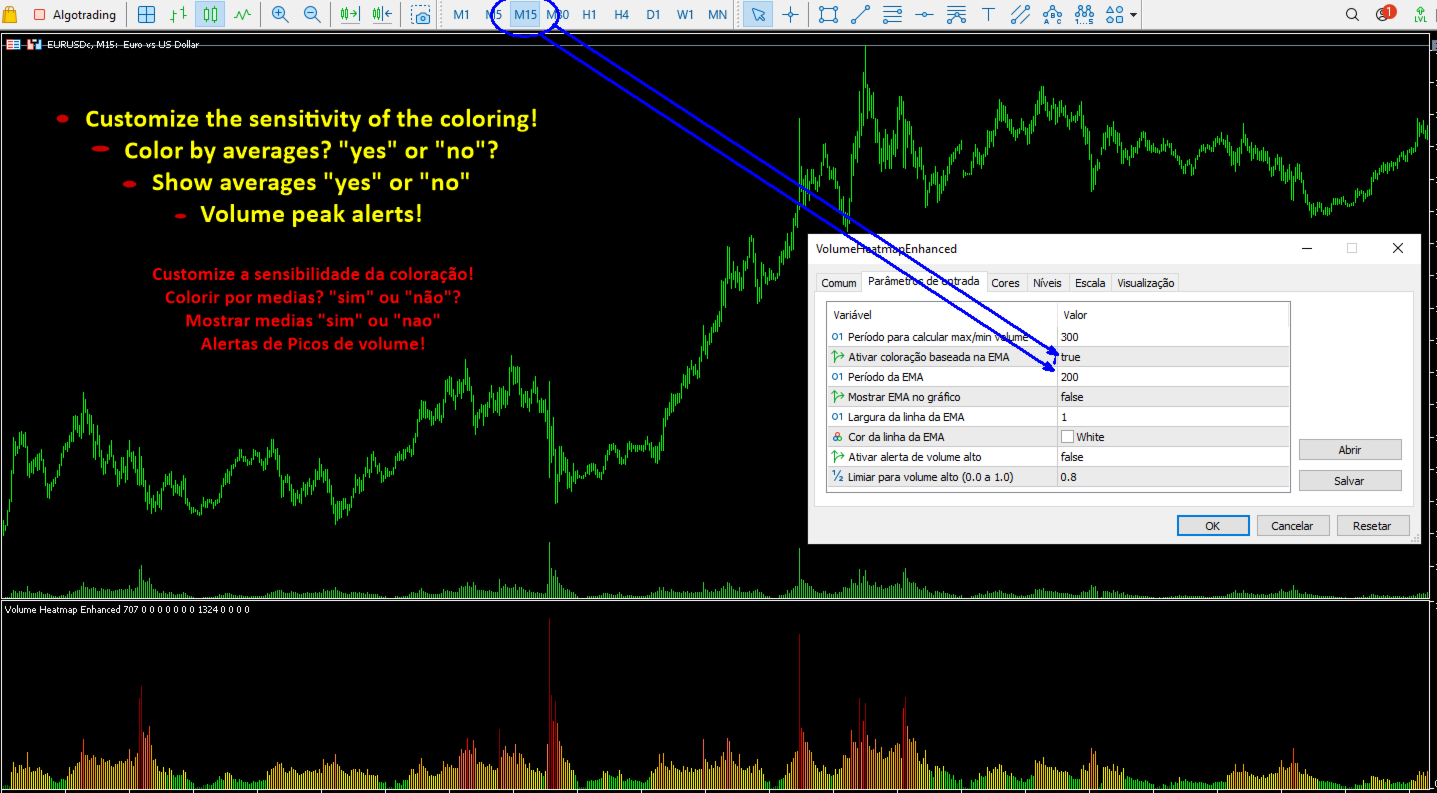
  • EMA統合: 指数移動平均線(EMA)を追加し、トレンドの確認やエントリー・イグジットポイントを精度高く特定します。

  • 高強度アラート: ボリュームが重要レベルに達した際に自動で通知を受け取り、市場の一歩先を行きます。

  • 簡単設定: 分析範囲(Recon Range)やアラート閾値などのパラメータを調整可能で、すぐに戦略にフィットさせられます。

すべてのトレーダーに最適
初心者でもベテラントレーダーでも、Volume Thermal Visionは市場解読の必須ツールです。あらゆるタイムフレーム、あらゆる資産(FXからインデックスまで)で使用でき、VSA、ICT、SMC、Wyckoffの手法をより効果的に組み合わせて取引判断を最適化します。

今すぐMQL5 Marketで試そう
MQL5 Marketで無料トライアル版をダウンロードし、Volume Thermal Visionの威力を実感してください。市場分析のアプローチを変え、今日からより自信を持ってトレードを始めましょう。

専用サポート: ご不明点はjeantw7@gmail.comまで。Volume Thermal Visionを最大限に活用するお手伝いをいたします。

Volume Thermal Vision – トレーディングに差をつけるビジョン


おすすめのプロダクト
SMC VALID EA (MT5) Version: 1.10 Author: Marrion Brave Wabomba Category: Smart Money Concepts (SMC) and  ICT concepts ICT Smart Money Daily Zones (SMC Pro)  ICT Smart Money Daily Zones (SMC Pro) – ICT Daily Buy & Sell Zones Pro is a professional-grade Smart Money Concepts (SMC) / ICT trading indicator for MetaTrader 5, designed to clearly map institutional daily levels and guide traders with high-probability decision zones . This indicator automatically analyzes the Daily timeframe (PDH / PD
Stackable VWAP
Flavio Javier Jarabeck
3.5 (4)
Volume Weighted Average Price (VWAP) is a trading benchmark commonly used by Big Players that gives the average price a Symbol has traded throughout the day. It is based on both Volume and price. Additionally we put in this indicator the MVWAP (Moving Volume Weighted Average Price). For those who do not know the usage and the importance od this indicator I recommend a great article about this subject at Investopedia ( https://www.investopedia.com/articles/trading/11/trading-with-vwap-mvwap.asp
FREE
Premium https://www.mql5.com/en/market/product/167272 BITCOIN DAILY TOP BOTTOM ENGINE (V1) This is not a simple indicator. This is a professional-grade market observation and decision engine designed for serious Bitcoin traders who demand clarity, structure, and precision. The Bitcoin Daily Top Bottom Engine is built to identify high-probability daily extremes using adaptive range logic, sweep behavior analysis, and market condition filtering. Instead of reacting late, this engine prepares y
FREE
VWAP Simple
Deibson Carvalho
4.24 (29)
The Volume Weighted Average Price is similar to a moving average, except volume is included to weight the average price over a period.    Volume-Weighted Average Price [VWAP] is a dynamic, weighted average designed to more accurately reflect  a security’s true average price over a given period . Mathematically, VWAP is the summation of money (i.e., Volume x Price) transacted divided by the total volume over any time horizon, typically from market open to market close. VWAP reflects the capitali
FREE
White Weis Volume This indicator shows the sum of the volume in each wave, bulish or bearish, as idealized by David Weis , but it brings an important addition , which is the marking of the bar with the highest volume of the wave (White Bar)! In coding the indicator, it was sought to optimize the code to require minimal processing during use and not to overload mt5. The indicator can be used for pre-trading analysis and study, where the trader analyzes possible points of support and resistance
Value Chart Candlesticks
Flavio Javier Jarabeck
4.69 (13)
The idea of a Value Chart indicator was presented in the very good book I read back in 2020 , " Dynamic Trading Indicators: Winning with Value Charts and Price Action Profile ", from the authors Mark Helweg and David Stendahl. The idea is simple and the result is pure genius: Present candlestick Price analysis in a detrended way! HOW TO READ THIS INDICATOR Look for Overbought and Oversold levels. Of course, you will need to test the settings a lot to find the "correct" one for your approach. It
FREE
VWAP Indicator
LUC JACOBUS A VERHEECKE
4.08 (26)
Volume Weighted Average Price (VWAP) The volume weighted average price (VWAP) is a  trading   benchmark  used by traders that gives the average price a security has traded at throughout the day, based on both volume and price. It is important because it provides traders with insight into both the trend and value of a security. This indicator VWAP V2 is free and is the manual version of the extended Easy VWAP indicator (30 Euro), where the date and time properties are automatically entered. With
FREE
Weis Waves(ワイス・ウェーブ) は、デビッド・ワイスが開発し、リチャード・ワイコフの理論に基づいたテクニカル指標です。 従来の出来高がバーごとに表示されるのとは異なり、Weis Waves は出来高を上昇または下降の「波」として蓄積し、価格の方向が変わると新しいカウントを開始します。 この方法により、トレーダーは市場の動きの 本当の強さ を明確に把握することができます。 主な特徴: 出来高を買いと売りの波にまとめる。 支配的な圧力(買い手または売り手)を強調。 トレンドの継続 または 反転の可能性 を識別。 ワイコフ理論に基づき、出来高・フロー分析で広く使用される。 Weis Waves は、価格と出来高のバランスを評価するために、多くのプロトレーダーによって利用され、市場ダイナミクスの詳細な視点を提供します。
FREE
VWAP and MVWAP
Flavio Javier Jarabeck
3.88 (8)
Volume Weighted Average Price (VWAP) is a trading benchmark commonly used by Big Players that gives the average price a Symbol has traded throughout the day. It is based on both Volume and price. Additionally we put in this indicator the MVWAP (Moving Volume Weighted Average Price). For those who do not know the usage and the importance od this indicator I recommend a great article about this subject at Investopedia ( https://www.investopedia.com/articles/trading/11/trading-with-vwap-mvwap.asp )
FREE
Automatic Vwap Midas
Ricardo Almeida Branco
5 (1)
The 3 Automatic Vwap (Midas) Indicator can be used for Price and Volume studyers to map the movement of market drivers. It automatically plots 3 Vwaps, two of which are dynamic and will be updated throughout the day if new highs or new lows emerge. The third Vwap is daily and can help if the trend is up or down. Also, an auxiliary indicator that plots (also dynamic) points of interest with OHLC prices (Open, High and Low of the current day and Close of the previous day) was inserted. Success and
Breakout Boxes with Volume Pressure This indicator automates the identification of key consolidation zones (Supply and Demand) based on Market Pivots and Volatility (ATR). Unlike standard support/resistance tools, this indicator provides a unique   Volume Pressure Analysis   inside every box, giving you insight into the battle between Buyers and Sellers before a breakout occurs. Key Features Automated Supply & Demand Zones:   Automatically detects significant Pivot Highs and Lows to draw dyna
AvgVolumes
Marco Montemari
5 (1)
This indicator is based on Volumes standard indicator, calculates the average of Volumes based on the last N bars set by users, and if the value of the volume is bigger then a set % respect the average a different color will be used. The indicator is shown in a separate indicator window. This version has now a limitation in setting the % about the threshold. If you are interested to set threshold consider to buy the PRO version ( https://www.mql5.com/en/market/product/35925 ) If you want to use
FREE
Percentage Range Consolidation O Percentage Range Consolidation é um indicador poderoso projetado para identificar zonas de consolidação de preço com base em variações percentuais ao longo do tempo. Ideal para traders que buscam detectar áreas de compressão de volatilidade e possíveis pontos de ruptura (breakout). Principais características: Identifica até 3 zonas de consolidação simultâneas, cada uma configurável de forma independente. Cálculo baseado na variação percentual entre a máxima e mín
The MarketProfileTPO indicator for MetaTrader 5 is a powerful tool designed to bring the Market Profile concept, based on Time Price Opportunity (TPO) analysis , directly onto your main chart window. This indicator calculates and displays the price distribution over a specified period, highlighting key areas of market activity and concentration. It is particularly optimized for high-volatility instruments like NAS100, US30, and XAUUSD when used on the M1 (1-minute) timeframe, offering a detailed
FREE
Waves Sizer
Flavio Javier Jarabeck
3.86 (7)
Wyckoff fans, enjoy! Ideally to be used with the Weis Waves indicator, but it can be easily used alone, the Waves Sizer puts the range (in resulting Price movement) done by the Price on its market swings. You can control how accurate or loose will be the swings. This tool is very helpful for visually know how much the Price has traveled in your Timeframe. This way you can confront this level of effort with the resulting Volume, etc... Weis Waves indicator: https://www.mql5.com/en/market/produc
FREE
Aggression Volume
Flavio Javier Jarabeck
4.29 (17)
Aggression Volume Indicator is the kind of indicator that is rarely found in the MQL5 community because it is not based on the standard Volume data provided by the Metatrader 5 platform. It requires the scrutiny of all traffic Ticks requested on the platform... That said, Aggression Volume indicator requests all Tick Data from your Broker and processes it to build a very special version of a Volume Indicator, where Buyers and Sellers aggressions are plotted in a form of Histogram. Additionally,
FREE
Phoenix Measured Box
Nigel Nii Darku Narnor Darko
PHOENIX MEASURED BOX DASHBOARD, engineered specifically for Phoenix Au Trading to provide "No dreams, just the tools" for high-precision institutional-style trading. 1. THE INDICATOR DEFINITION The Phoenix Measured Box is a multi-dimensional analysis tool designed for SMC (Smart Money Concepts) and ICT-style traders. It combines time-segmented price action with real-time volume metrics and automated target projections. Key Components: 15m Range Boxes: Automatically identifies and boxes every 15
FREE
MIDAS Super VWAP
Flavio Javier Jarabeck
4.27 (11)
Imagine VWAP, MVWAP and MIDAS in one place... Well, you found it! Now you can track the movement of Big Players in various ways, as they in general pursue the benchmarks related to this measuring, gauging if they had good execution or poor execution on their orders. Traders and analysts use the VWAP to eliminate the noise that occurs throughout the day, so they can measure what prices buyers and sellers are really trading. VWAP gives traders insight into how a stock trades for that day and deter
FREE
The indicator highlights the points that a professional trader sees in ordinary indicators. VisualVol visually displays different volatility indicators on a single scale and a common align. Highlights the excess of volume indicators in color. At the same time, Tick and Real Volume, Actual range, ATR, candle size and return (open-close difference) can be displayed. Thanks to VisualVol, you will see the market periods and the right time for different trading operations. This version is intended f
FREE
This z-score indicator shows the correct z-score of an asset, as it uses the normalized price data for calculation, which is the only correct way. Z-score is only applicable for normal distributed data, therefore not the actual price is considered, but the normalised returns, which were assumed to follow a normal distribution. Returns are mean reverting and assumed to follow a normal distribution, therefore z-score calculation of returns is more reliable than z-score on price, as price is NOT m
CRV Z-Score Engine is a professional market structure indicator that transforms raw price into normalized,  multi-horizon statistical structure model   It reveals: When price is statistically stretched When the market is transitioning between regimes When a move is structurally aligned across multiple horizons This is not a lagging oscillator . It is a multi-horizon statistical structure model built for serious traders. WHAT IS Z-SCORE? Z-Score measures how far price deviates from its n
Volume Above Average Indicator - MQL5 Introduction The Volume Above Average Indicator is a custom indicator for the MetaTrader 5 (MQL5) platform that helps traders identify the current trading volume compared to the historical average. The indicator uses three different sensitivity levels to classify volume into weak, medium, and strong, providing a clear visualization of market momentum. Key Features Displays trading volume in a separate window. Compares the current volume with the historical a
FREE
Macro-R Pro Signal — Advanced Trading Signal Indicator Macro-R Pro Signal is a professional trading indicator designed to deliver high-quality BUY and SELL signals with enhanced precision and reduced market noise. By combining Bollinger Bands, RSI, and adaptive volatility filtering , this indicator helps traders identify high-probability reversal points while avoiding unfavorable market conditions. How the Strategy Works This indicator is built on a mean reversion + momentum confirmation concep
FREE
Volume Profile Density V2.40 価格ごとの出来高分布を表示し、機関投資家が注目する価格帯を明らかにします。 時間軸ベースの出来高とは異なり、どこで取引量が集中したかを示します。 基本概念: 水平バー = 各価格の取引量 バーが長いほど出来高が多い 赤いゾーン = 主要なサポート/レジスタンス 主な用途: 実際のサポート・レジスタンスの特定 POC(コントロールポイント) の確認 バリューエリア(総出来高の70%) の定義 低出来高ゾーンをストップやターゲットに利用 カラーガイド: 青 = 低出来高(価格が素早く通過) 黄 = 中程度の出来高(バランスゾーン) 赤 = 高出来高(機関ゾーン) トレード戦略: 赤ゾーンでの反発買い VAHまたは赤ゾーンでの拒否売り 出来高を伴うPOCブレイクで参入 POCへの戻りでエントリー 青ゾーンを目標に設定 設定: 初心者: 1.0 / 100% / 1.0 スキャルピング: 0.5 / 200% / 0.5 スイング: 2.0 / 50% / 1.5 技術情報: バージョン: 2.40 プラットフォーム: MT5 対応資産
FREE
VP hidden
Emr Aljnaby
4.33 (12)
The indicator works to convert normal volume into levels and determine financial liquidity control points. It is very similar in function to Fixed Volume Profile. But it is considered more accurate and easier to use than the one found on Trading View because it calculates the full trading volumes in each candle and in all the brokers present in MetaTrade, unlike what is found in Trading View, as it only measures the broker’s displayed prices. To follow us on social media platforms: telegram
FREE
Weis Waves
Flavio Javier Jarabeck
2.83 (18)
The original author is David Weis, an expert in the Wyckoff Method. The Weis Wave is a modern adaptation of the 1930's Wyckoff Method, another expert in Tape Reading techniques and Chart Analysis. Weis Waves takes market volume and stacks it into waves according to price conditions giving the trader valuable insights about the market conditions. If you want to learn more about this subject you can find tons of videos in YouTube. Just look for "The Wickoff Method", "Weis Wave" and "Volume Spread
FREE
PivoTrack VP MetaTrader 5向けのピボット起点ボリュームプロファイル指標。連続するPivot HighとPivot Lowの間のボリューム分布を可視化し、価格が受け入れられた領域と拒否された領域を明確に示します。 PivoTrack VPはMetaTrader 5向けのボリューム分析指標です。任意のチャート上でPivot HighとPivot Lowを自動検出し、各区間のボリュームプロファイルを完全に描画します。コントロールポイント(POC)、バリューエリアハイ(VAH)、バリューエリアロー(VAL)、バリューエリアの背景塗りつぶしを表示し、各価格スイングのボリューム分布を明確に把握できます。また、直近の確認済みピボットから現在のバーまでの区間を追跡するデベロッピングプロファイルをリアルタイムで更新します。   概要 この指標は、左右のバー数を設定可能なPivot HighとPivot Lowを検出することでチャート履歴を区間に分割します。完了した各区間では、設定可能な価格行数にわたってボリュームがどのように分布しているかを計算し、ヒストグラムを描画、最大ボリュー
FREE
SMC LIQUIDITY Advanced Institutional-Grade Smart Money and Liquidity Analysis Suite for MT5 SMC LIQUIDITY is a comprehensive institutional toolkit engineered for traders who require precise liquidity mapping, market structure intelligence, smart money concepts, and order flow awareness in a single integrated interface. It is designed for professional workflow, multi-timeframe clarity, and seamless execution in fast-moving conditions. This indicator combines several institutional methodologies in
FREE
Midas VWAP
Paulo Henrique Faquineli Garcia
4 (2)
Volume Weighted Average Price (VWAP) is a trading benchmark commonly used by Big Players that gives the average price a Symbol has traded throughout the day. It is based on both Volume and price. This indicator contains Daily VWAP and MIDAS' VWAP, which means you are able to anchor the beggining of MIDAS' calculations and, therefore you will be able to use this methodology to study price versus volume moves after anchor point. You will be able to anchor up to 3 HIGH MIDAS VWAP's and 3 LOW. Wish
FREE
DS RVOL: The Relative Volume Indicator for MT5 RVOL is a straightforward Relative Volume (RVOL) indicator for MetaTrader 5. It shows you how current volume compares to a historical average, providing a quick way to gauge the strength of a price move. How it Works Relative Volume is a simple ratio: R V O L = C u rre n t V o l u m e ​/ A v er a g e H i s t or i c a l V o l u m e RVOL > 1.0 : Volume is higher than usual. This suggests there's strong interest and potential for a sustained move. RVOL
FREE
このプロダクトを購入した人は以下も購入しています
ARIPoint is a powerful trading companion designed to generate high-probability entry signals with dynamic TP/SL/DP levels based on volatility. Built-in performance tracking shows win/loss stats, PP1/PP2 hits, and success rates all updated live. Key Features: Buy/Sell signals with adaptive volatility bands Real-time TP/SL/DP levels based on ATR Built-in MA Filter with optional ATR/StdDev volatility Performance stats panel (Success, Profit/Loss, PP1/PP2) Alerts via popup, sound, push, or email Cu
SuperScalp Pro
Van Minh Nguyen
4.57 (21)
SuperScalp Pro – 高度なマルチフィルタースキャルピングインジケーターシステム SuperScalp Pro は、クラシックな Supertrend と複数のインテリジェント確認フィルターを組み合わせた高度なスキャルピングインジケーターです。M1 から H4 まで複数の時間足で効率的に動作し、XAUUSD、BTCUSD、主要 Forex 通貨ペア向けに最適化されています。 このインジケーターは明確な Buy / Sell シグナルを提供し、ATR に基づいてエントリー価格、Stop Loss、Take Profit を自動計算します。Fibonacci Take Profit 機能により、重要な価格帯で早期決済し、到達時に通知を送信します。 初期設定では Fibonacci Take Profit が有効化されており、より安定した取引体験を重視しています。チャートに適用するだけですぐ利用可能です。上級者向けに、すべてのパラメータは自由にカスタマイズできます。 EMA、RSI、ADX、Volume、VWAP、Bollinger Bands、MACD Divergence な
このインジケーターを購入された方には、以下の特典を 無料 で提供しています: 各トレードを自動で管理し、ストップロスとテイクプロフィットを設定し、戦略ルールに基づいてポジションを決済する補助ツール 「Bomber Utility」 様々な銘柄に合わせたインジケーターの設定ファイル(セットファイル) 「最小リスク」、「バランスリスク」、「待機戦略」 の3つのモードで使用できる Bomber Utility 用の設定ファイル このトレーディング戦略をすぐに導入・設定・開始できる ステップバイステップのビデオマニュアル ご注意: 上記の特典を受け取るには、MQL5のプライベートメッセージシステムを通じて販売者にご連絡ください。 オリジナルのカスタムインジケーター 「Divergence Bomber(ダイバージェンス・ボンバー)」 をご紹介します。これは、MACDのダイバージェンス(乖離)戦略に基づいた 「オールインワン」型のトレーディングシステム です。 このテクニカルインジケーターの主な目的は、価格とMACDインジケーターの間に発生するダイバージェンスを検出 し、将来の価格の動きを示す
Entry In The Zone and SMC Multi Timeframe is a real-time 2-in-1 market analysis tool that combines market structure analysis and a No Repaint BUY / SELL signal system into a single indicator, built on Smart Money Concepts (SMC) — a widely adopted framework used by professional traders to understand market structure. This indicator helps you see the market more clearly, make decisions based on structure rather than guesswork, and focus on high-probability zones where price is more likely to react
Power Candles V3 - 初の自己最適化ストレングス・インジケーター Power Candles V3 は、ストレングス分析をそのままトレード可能なシステムへと変えます。チャートを市場の強さで色分けするだけでなく、バックグラウンドでリアルタイムの自動最適化を実行し、あなたの銘柄に最適な Stop Loss、Take Profit、シグナル閾値を提示します。ワンクリックでライブトレードに適用できます。 このツールは Stein Investments エコシステムの一部です。  18 種のツール一覧、AI によるセットアップ提案、  そしてコミュニティ参加はこちら: https://stein.investments Version 3 の新機能 - AUTO-OPTIMIZER チャート読み込み時、そして各バーの確定ごとに、Power Candles V3 は該当銘柄の過去データ上で 3,000 を超えるトレードの組み合わせ をシミュレーションします: 2 つの戦略 を並列でテスト: Momentum (MOM) と Reversal (REV) 3 段階のシグナル閾値
優れたテクニカルインジケーター「Grabber」をご紹介します。これは、すぐに使える「オールインワン」トレーディング戦略として機能します。 ひとつのコードに、市場のテクニカル分析ツール、取引シグナル(矢印)、アラート機能、プッシュ通知が強力に統合されています。 このインジケーターを購入された方には、以下の特典を無料で提供します: Grabberユーティリティ:オープンポジションを自動で管理するツール ステップバイステップのビデオマニュアル:インジケーターのインストール、設定、取引方法を解説 カスタムセットファイル:インジケーターをすばやく自動設定し、最大限の成果を出すための設定ファイル 他の戦略はもう忘れてください!Grabberだけが、あなたを新たなトレードの高みへと導いてくれるのです。 Grabber戦略の主な特徴: 推奨タイムフレーム:M5〜H4 対応通貨ペア・資産:どれでも使用可能ですが、私が実際に検証した以下を推奨します(GBPUSD、GBPCAD、GBPCHF、AUDCAD、AUDUSD、AUDSGD、AUDCHF、NZDUSD、NZDCAD、EURCAD、EURUSD、E
このインジケーターを購入すると、プロ仕様のトレードマネージャーを無料で差し上げます。 まず第一に、このトレーディングシステムがノンリペイント、ノンリドロー、ノンラグのインジケーターであることを強調する価値がある。これにより、手動取引とロボット取引の両方に理想的なものになっています。 オンラインコース、マニュアル、プリセットのダウンロード。 「スマートトレンドトレーディングシステム MT5」は、新規および経験豊富なトレーダー向けにカスタマイズされた包括的なトレーディングソリューションです。10以上のプレミアムインジケーターを組み合わせ、7つ以上の堅実なトレーディング戦略を備えており、多様な市場状況に対応する多目的な選択肢となっています。 トレンドフォロー戦略:トレンドを効果的に乗り越えるための正確なエントリーとストップロス管理を提供します。 リバーサル戦略:潜在的なトレンドの反転を特定し、トレーダーがレンジ相場を活用できるようにします。 スキャルピング戦略:高速で正確なデイトレードおよび短期取引のために設計されています。 安定性:すべてのインジケーターはノンリペイント、ノンリドロー、ノ
SignalTech MT5 is a trading system for EURUSD, USDCHF, USDJPY, AUDUSD, NZDUSD, EURJPY, AUDJPY, NZDJPY, CADJPY H2 and H3 Timeframe.  It can generate signals with Buy/Sell Arrows and Pop-Up/Sound Alerts. Each signal has clear Entry and Stop Loss levels, which should be automatically flagged on the chart, as well as potential Targets 1, 2, and 3. The Entry and TP levels are fixed after the trade is taken. The exit level is dynamic. If there are signs of a potential short-term trend reversal, the
Quantum TrendPulse を ご紹介します。これは、   SuperTrend   、   RSI   、および Stochastic のパワーを 1 つの包括的なインジケーターに組み合わせて、取引の可能性を最大限に引き出す究極の取引ツールです。精度と効率を求めるトレーダー向けに設計されたこのインジケーターは、市場のトレンド、勢いの変化、最適なエントリー ポイントとエグジット ポイントを自信を持って特定するのに役立ちます。 主な特徴: SuperTrend 統合: 現在の市場動向に簡単に追従し、収益性の波に乗ることができます。 RSI精度: 買われすぎと売られすぎのレベルを検出し、市場の反転のタイミングに最適で、SuperTrendのフィルターとして使用されます。 確率的精度: 確率的振動を活用して、変動の激しい市場で隠れたチャンスを見つけます。SuperTrend のフィルターとして使用されます。 マルチタイムフレーム分析:   M5 から H1 または H4 まで、さまざまなタイムフレームで市場を常に把握します。 カスタマイズ可能なアラート: カスタム取引条件が満たされ
Gann Made Easy   は、ミスター・ギャンの理論を使用した取引の最良の原則に基づいた、プロフェッショナルで使いやすい外国為替取引システムです。 W・D・ガン。このインジケーターは、ストップロスとテイクプロフィットレベルを含む正確な買いと売りのシグナルを提供します。 PUSH通知を利用して外出先でも取引可能です。 ご購入後、取引方法の説明と優れた追加インジケーターを無料で入手するには、私にご連絡ください! おそらく、ギャンの取引手法についてはすでに何度も聞いたことがあるでしょう。通常、ギャンの理論は初心者のトレーダーだけでなく、すでにある程度の取引経験がある人にとっても非常に複雑なものです。なぜなら、ギャンの取引手法は理論的にはそれほど簡単に適用できるものではないからです。私はその知識を磨き、最良の原則を私の外国為替インジケーターに組み込むために数年を費やしました。 このインジケーターは非常に簡単に適用できます。必要なのは、それをチャートに添付し、簡単な取引推奨事項に従うだけです。このインジケーターは常に市場分析の仕事を行い、取引の機会を探します。適切なエントリーポイントを検
これはMT5のインジケーターで、再描画なしで取引に参入するための正確なシグナルを提供します。 外国為替、暗号通貨、金属、株式、インデックスなど、あらゆる金融資産に適用できます。かなり正確な見積もりを提供し、取引を開始して終了するのに最適な時期を教えてくれます。1つのシグナルを処理しただけでインジケーターの元が取れた例の 動画 (6:22)をご覧ください。Entry PointsPro インジケーターの助けを借りたほとんどのトレーダーの最初の1週間の結果が改善しています。 Telegramグループ に登録してください。Entry Points Proインジケーターのメリットは次の通りです。 再描画のないエントリーシグナル 再描画されるインジケーターでは一度表示されたシグナルが削除されて大きな金銭的損失につながることがありますが、これと異なり、表示されて確認されたシグナルは消えることがありません。 エラーなしの取引開始 インジケーターアルゴリズムによって取引を開始する(資産を売買する)理想的な瞬間を見つけることができます。それを使用するすべてのトレーダーの成功率が向上します。 あら
Azimuth Pro
Ottaviano De Cicco
5 (7)
Azimuth Pro V2:MT5向けシンセティック・フラクタル構造分析と確認済みエントリー 概要 Azimuth Pro は Merkava Labs によるマルチレベルスイング構造インジケーターです。4つのネストされたスイングレイヤー、スイングアンカーVWAP、ABCパターン検出、3タイムフレーム構造フィルタリング、そして確定バーでの確認済みエントリー — 1つのチャートで、ミクロスイングからマクロサイクルまでを網羅するワークフロー。 これはブラインドシグナル製品ではありません。ロケーション、コンテキスト、タイミングを重視するトレーダーのための構造ファーストワークフローです。 V2発売記念オファー — Azimuth Pro V2をUSD 399で(次の100本)。最終価格:USD 499。 1. V2での変更点 シンセティック・マルチタイムフレームエンジン 上位タイムフレーム分析をMeridian Proと同じ独自のシンセティックアーキテクチャで一から再構築。よりクリーンなHTFコンテキスト、安定したライブ動作、従来のMTF同期問題なし。シンセティックエンジンは 固定比率タ
FX Trend NG:次世代マルチマーケット・トレンドインテリジェンス 概要 FX Trend NG は、複数の時間足に対応したプロフェッショナル向けトレンド分析およびマーケット監視ツールです。 市場全体の構造を数秒で把握することができます。 複数のチャートを切り替える必要はありません。どの銘柄がトレンド中なのか、どこでモメンタムが弱まっているのか、そしてどの時間足で強い整合性があるのかを瞬時に確認できます。 ローンチ特別オファー – FX Trend NG を $30(6ヶ月) または $80 永久ライセンス でご利用いただけます。 すでに Stein Investments のユーザーですか? -> メッセージを送信 して、プライベートグループへアクセスしてください。 セットアップや詳細情報が必要ですか? -> Stein Investments 公式ページ をご覧ください。 1. FX Trend NG が他と異なる理由 3ステート・トレンドロジック ― Buy と Sell だけではない • 多くのインジケーターは Buy または Sell の2状態のみを表示します。
マーケットメーカーのためのツール。 Meravith は次の機能を提供します: すべての時間足を分析し、現在有効なトレンドを表示します。 強気と弱気の出来高が等しくなる流動性ゾーン(出来高均衡)を強調表示します。 異なる時間足のすべての流動性レベルをチャート上に直接表示します。 テキスト形式の市場分析を生成し、参考情報として表示します。 現在のトレンドに基づいて目標値、サポートレベル、ストップロスを計算します。 取引のリスクリワード比を算出します。 口座残高に基づいてポジションサイズを計算し、潜在的な利益を推定します。 また、市場に大きな変化があった場合には警告を表示します。 インジケーターの主要ライン: 強気/弱気の出来高エグゾーストライン ― 目標値として機能します。 市場のトレンドを示すライン。市場が強気か弱気かによって色が変わり、トレンドのサポートとして機能します。主にその色が市場センチメントを示します。 出来高均衡ライン(Eq)。Eq(Volume Equilibrium)ラインはシステムの中核です。これは買い手と売り手の出来高のバランスポイントを表します。市場の流動性を示し
BTMM State Engine Pro is a MetaTrader 5 indicator for traders who use the Beat The Market Maker approach: Asian session context, kill zone timing, level progression, peak formation detection, and a multi-pair scanner from a single chart. It combines cycle state logic with a built-in scanner dashboard so you do not need the same tool on many charts at once. What it does Draws the Asian session range; session times can follow broker server offset or be set in inputs. Tracks level progression (L
トレンド スクリーナー インジケーターでトレンド取引の力を解き放ちます。ファジー ロジックと複数通貨システムを活用した究極のトレンド取引ソリューションです。 ファジー ロジックを活用した革新的なトレンド インジケーターである Trend Screener を使用して、トレンド取引を向上させます。 これは、13 を超えるプレミアム ツールと機能、および 3 つの取引戦略を組み合わせた強力なトレンド追跡インジケーターであり、Metatrader をトレンド アナライザーにする多用途の選択肢となります。 期間限定オファー : トレンド スクリーナー インジケーターは、わずか 100 ドルで生涯ご利用いただけます。 (元の価格 50$ ) (オファー延長) Trend Screener の 100% 非再描画精度の揺るぎない精度を体験して、取引の決定が過去の価格変動の影響を受けないようにしてください。 マルチタイムフレームおよびマルチ通貨機能の多用途性を解放し、比類のない自信を持って外国為替、商品、暗号通貨、インデックスの世界を取引できるようにします。 Trend Screener の包括的な
まず第一に、この取引インジケーターは再描画されず、再描画されず、遅延しないことを強調する価値があります。これにより、手動取引とロボット取引の両方に理想的なものになります。 ユーザーマニュアル:設定、入力、戦略。 アトミックアナリストは、価格の強さとモメンタムを利用して市場でより良いエッジを見つけるためのPA価格アクションインジケーターです。ノイズや誤ったシグナルを除去し、取引ポテンシャルを高めるための高度なフィルターを備えています。複雑なインジケーターの複数のレイヤーを使用して、アトミックアナリストはチャートをスキャンし、複雑な数学的計算をシンプルなシグナルと色に変換します。これにより、どのような初心者トレーダーでも理解して使用し、一貫した取引の決定を行うことができます。 「アトミックアナリスト」は、新規および経験豊富なトレーダー向けにカスタマイズされた包括的な取引ソリューションです。プレミアムインジケーターとトップノッチの機能を1つの取引戦略に組み合わせ、すべてのタイプのトレーダーにとって汎用性のある選択肢にします。 デイリートレーディングとスキャルピング戦略:高速で正確なデイ
ご紹介     Quantum Breakout PRO は 、ブレイクアウト ゾーンの取引方法を変革する画期的な MQL5 インジケーターです。 13年以上の取引経験を持つ経験豊富なトレーダーのチームによって開発されました。     クォンタム ブレイクアウト プロ   は、革新的でダイナミックなブレイクアウト ゾーン戦略により、あなたのトレーディングの旅を新たな高みに押し上げるように設計されています。 クォンタム ブレイクアウト インジケーターは、5 つの利益ターゲット ゾーンを備えたブレイクアウト ゾーン上のシグナル矢印と、ブレイクアウト ボックスに基づいたストップロスの提案を提供します。 初心者トレーダーにもプロのトレーダーにも適しています。 量子EAチャネル:       ここをクリック 重要!購入後、インストールマニュアルを受け取るためにプライベートメッセージを送ってください。 推奨事項: 時間枠: M15 通貨ペア: GBPJPY、EURJPY、USDJPY、NZDUSD、XAUUSD アカウントの種類: ECN、Raw、またはスプレッドが非常に低い R
Bill Williams Advanced is designed for automatic chart analysis using Bill Williams' "Profitunity" system. The indicator analyzes four timeframes at once. Manual (Be sure to read before purchasing) Advantages 1. Analyzes the chart using Bill Williams' "Profitunity" system. Signals are displayed in a table in the corner of the screen and on the price chart. 2. Finds all known AO and AC signals, as well as zone signals. Equipped with a trend filter based on the Alligator. 3. Finds "Divergence Bar
OmniSync Projection
Antonio-alin Teculescu
5 (1)
Chronos Fractal Engine is an innovative price projection indicator for MetaTrader 5, designed to transform your technical analysis by intelligently identifying and projecting historical price patterns. Built upon an advanced correlation algorithm and the fractal principles of the market, this powerful tool visualizes potential future price movements, giving you a unique edge in your trading decisions. What is Chronos Fractal Engine? At its core, the Chronos Fractal Engine employs a sophisticat
FX Power: 通貨の強弱を分析して、より賢い取引を実現 概要 FX Power は主要通貨と金の実際の強弱をあらゆる市場状況で理解するための必須ツールです。強い通貨を買い、弱い通貨を売ることで、 FX Power は取引の意思決定を簡素化し、高い確率の取引機会を見出します。トレンドを追従する場合でも、極端なデルタ値を使用して反転を予測する場合でも、このツールはあなたの取引スタイルに完全に適応します。ただ取引するだけではなく、 FX Power で賢く取引をしましょう。 1. なぜ FX Power がトレーダーにとって非常に有益なのか 通貨と金のリアルタイム強弱分析 • FX Power は主要通貨と金の相対的な強弱を計算し、マーケットダイナミクスに関する明確な洞察を提供します。 • どの資産がリードしているか、または後れを取っているかを監視して、取引するペアを賢く選びましょう。 マルチタイムフレームの包括的なビュー • 短期、中期、長期のタイムフレームで通貨と金の強弱を追跡し、マーケットトレンドに基づいて取引戦略を調整できます。 • スキャルピングからスイングトレード
Crystal Heikin Ashi Signals - Professional Trend & Signal Detection Indicator Advanced Heikin Ashi Visualization with Intelligent Signal System for Manual & Automated Trading Final Price: $149 ---------> Price goes up $10 after every 10 sales . Limited slots available — act fast . Overview Crystal Heikin Ashi Signals is a professional-grade MetaTrader 5 indicator that combines pure Heikin Ashi candle visualization with an advanced momentum-shift detection system. Designed for both manual traders
Trend Ai indicatorは、トレンドの識別と実用的なエントリポイントと反転アラートを組み合わせることで、トレーダーの市場分析を強化する優れたツールです。 この指標は、ユーザーが自信と正確さで外国為替市場の複雑さをナビゲートすることを可能にします トレンドAiインジケーターは、主要なシグナル以外にも、プルバックやリトレースメント中に発生するセカンダリエントリポイントを識別し、トレーダーが確立されたトレンド内の価格修正を活用できるようにします。 重要な利点: *MT4およびMT5の仕事 *明確な買いまたは売りシグナル *再描画しません ·すべての資産で動作します 私はeaやセットをtelegram it詐欺で販売しないように注意してください。 すべての設定はここでブログで無料です。  重要! 指示とボーナスを得るために購入後すぐに私に連絡してください! 私の他のプロダクトと同様、実質操作の監視はここに見つけることができます: https://www.mql5.com/en/users/mechanic/seller&nbsp ; 設定および入力: すべての
あなたのシンボルでどの戦略が実際に機能するか確認しましょう - リアルマネーをリスクにさらす前に。 Power Barは、あらゆるシンボルとあらゆるタイムフレームで 極端な価格バー を検出し、3つの異なるトレード戦略を即座にバックテストします。勝率、プロフィットファクター、損益を並べて比較できます。すべてが1つのインタラクティブなパネルに集約されています。 推測なし。カーブフィッティングなし。データだけです。 Power Barが特別な理由 ほとんどのインジケーターはシグナルを出すだけで、それが機能するかどうかは推測に任されます。Power Barはさらに先を行きます - すべてのシグナルを 3つの戦略 に対してテストし、統計を表示します。FlipFlop、Momentum、Reversalをワンクリックで切り替え、数値が即座に変化するのを確認できます。 FlipFlop - 常にポジションを保有。シグナルでエントリーし、反対シグナルでイグジット。当社のリサーチでは、US30、US500、DAXなどのトレンドのあるインデックスで最も効果的です。 Momentum - シグナルの方向に
Gartley Hunter Multi - An indicator for searching for harmonic patterns simultaneously on dozens of trading instruments and on all possible timeframes. Manual (Be sure to read before purchasing) | Version for MT4 Advantages 1. Patterns: Gartley, Butterfly, Shark, Crab. Bat, Alternate Bat, Deep Crab, Cypher 2. Simultaneous search for patterns on dozens of trading instruments and on all possible timeframes 3. Search for patterns of all possible sizes. From the smallest to the largest 4. All fou
このダッシュボードは、選択されたシンボルの最新の利用可能なハーモニックパターンを表示するので、時間を節約し、より効率的に /   MT4バージョン 。 無料インジケーター:   Basic Harmonic Pattern インジケーター列 Symbol : 選択したシンボルが表示されます。 Trend :   強気または弱気 Pattern : パターンの種類(ガートレー、バタフライ、バット、カニ、サメ、サイファー、ABCD) Entry : エントリー価格 SL: ストップロス価格 TP1: 1回目の利食い価格 TP2: 2回目の利食い価格 TP3:   3回目の利食い価格 Current price :   現在値 Age (in bars):    最後に描画されたパターンの年齢 主な入力項目 Symbols:   "28 Major Currency Pairs "または "Selected Symbols "から選択。 Selected Symbols:   カンマで区切られた監視したいシンボル("EURUSD,GBPUSD,XAUUSD")。ブローカーがペアに接
ARICoin is a powerful trading companion designed to generate high-probability entry signals with dynamic TP/SL/DP levels based on volatility. Built-in performance tracking shows win/loss stats, PP1/PP2 hits, and success rates all updated live. Key Features: Buy/Sell signals with adaptive volatility bands Real-time TP/SL/DP levels based on ATR Built-in MA Filter with optional ATR/StdDev volatility Performance stats panel (Success, Profit/Loss, PP1/PP2) Alerts via popup, sound, push, or email Cust
メタポイントプロ   これは、取引における推測を排除し、市場が既に決定を下したポイントを示すトレンドフォローツールです。この指標は、トレンド、動向、構造が変化する重要なポイントを特定し、主要プレーヤーがポジションを取るべき価格の戻り領域を強調表示します。 単に値動きを見るだけでなく、その背後にある論理を理解できます。すべてのシグナルはローソク足が確定した後に記録され、再描画されることなくチャート上に保存されるため、自信を持って状況を分析し、意思決定を行うことができます。トレード目標(利益確定)も表示されます。 この指標の有効性について完全に確信を持っていただくために、自動統計機能をご利用いただけます。 方向転換のたびに、インジケーターはストップロスレベルとそのインテリジェントな段階的移動(Move SL)も表示します。これは非常に重要です。     削減する   リスク   ポジション別。 損切り/利益確定/リスクリワード 右側に内蔵されたパネルには、現在の世界的なトレンドの方向における市場参入ポイントが表示され、過去のデータからもこれらのシグナルが確認できます。 任意の時間枠/ツール
「 Dynamic Scalper System MT5 」インジケーターは、トレンド波の中でスキャルピング取引を行う手法のために設計されています。 主要通貨ペアと金でテスト済みで、他の取引商品との互換性があります。 トレンドに沿った短期的なポジションオープンのシグナルを提供し、追加の価格変動サポートも提供します。 インジケーターの原理 大きな矢印はトレンドの方向を決定します。 トレンド波の中では、小さな矢印の形でスキャルピングシグナルを生成するアルゴリズムが機能します。 赤い矢印は強気方向、青い矢印は弱気方向です。 トレンドの方向には敏感な価格変動ラインが描かれ、小さな矢印のシグナルと連動します。 シグナルは次のように機能します。適切なタイミングでラインが現れるとエントリーシグナルが形成され、ラインが開いている間はポジションが保持され、完了すると取引が終了します。 推奨される動作時間枠はM1~H4です。 矢印は現在のローソク足に形成され、次のローソク足が開いている場合は、前のローソク足の矢印は再描画されません。 入力パラメータ Trend Wave Period - トレ
Meridian Pro
Ottaviano De Cicco
5 (1)
Meridian Pro:MT5用プロフェッショナル・マルチタイムフレーム・トレンドマトリックス 概要 Meridian Pro は Merkava Labs が開発したマルチタイムフレーム・トレンドマトリックスで、方向性の状態、強度、モメンタムの状況、マトリックスの合意をひとつのコンパクトなパネルに集約します。ひとつのアダプティブエンジンがM1からW1まで一貫して適用されます。シンボルごとの調整は不要。インジケーターの積み重ねも不要。すべてのアセットとすべてのタイムフレームをカバーするひとつの構造化された読み取りです。 発売キャンペーン — Meridian Proを USD 99 (導入価格)で入手。通常価格:USD 149 。 1. Meridian Proが他と異なる理由 ひとつのエンジン、バラバラなインジケーターのダッシュボードではない 多くのMTFダッシュボードは、タイムフレームごとに生のインジケーター値を繰り返すだけです。Meridian Proはマトリックス全体でひとつのアダプティブ・トレンドエンジンを使用するため、パネルの各行が同じ構造化フレームワークから導出されます
作者のその他のプロダクト
Weis Wave Scouter Basic
Jean Carlos Martins Roso
5 (1)
Weis Wave Scouter Basic は、MetaTrader 5 用に設計された当社の有名なインジケーターの基本バージョンであり、Wyckoff 手法と VSA(ボリュームスプレッド分析)の概念を手軽かつ効率的に探求したいトレーダー向けに設計されています。ボリュームウェーブの読み取りに基づいており、市場の動きを明確に特定でき、リチャード・ワイコフが教えた「労力と結果」「需給」の原則に焦点を当てています。 Weis Wave Scouter Basic を使用すると、標準カラー(Classic)テーマの直感的なヒストグラムで上昇波と下降波を視覚化でき、トレンドや反転を簡単に解釈できます。Brick Size や Volume Scale Factor などの基本的な調整が可能で、ティックボリュームまたは実際のボリュームを選択できるため、FX、株式、暗号資産などさまざまな市場で柔軟に使用できます。初心者やシンプルなツールを求めるトレーダーに最適な Weis Wave Scouter Basic は、Wyckoff と VSA の技術を取引に活かすための理想的な出発点です。 We
FREE
WeisWaveScouter
Jean Carlos Martins Roso
WeisWaveScouter is a powerful and accurate indicator designed to help traders detect key market movements based on price and volume waves. Built for the MetaTrader 4 platform, WeisWaveScouter provides detailed analysis of bullish and bearish waves, as well as highlighting volume spikes, giving you a clear view of market conditions. Key Features: Bullish and Bearish Waves: Easily identify bullish and bearish movements with waves clearly differentiated by customizable colors. Volume Spikes: Det
EmaCloud
Jean Carlos Martins Roso
本物の戦略でトレードする準備はできていますか? EmaCloud は、明確さ・スピード・より賢い意思決定を求めるトレーダーのために設計されたインジケーターです。 EMA・SMA・SMMA・LWMA の移動平均クラウドを使用し、市場のトレンドを高精度で可視化。多くのトレーダーより早く方向転換の兆候を捉えることができます。「Classic」から「Forest」まで、戦術的にデザインされた8種類のビジュアルテーマで、自分のスタイルに合わせてカスタマイズ可能です。 売買シグナルは矢印表示に加え、ポップアップ・プッシュ通知・メールで受信可能。高度なボリューム&トレンドフィルターがノイズを減らし、より高確率なチャンスを際立たせます。 実際の数値を表示するダイナミックラベルと、トレンド方向(Bullish/Bearish)、pips差、パーセンテージを示すインテリジェントダッシュボードを搭載。すべて自由に設定できます。 今すぐ EmaCloud をダウンロードして、チャート分析を戦略的な意思決定へと進化させましょう。
Volume Thermal Vision Basicは、著名なVolume Thermal Visionインジケーターの簡易版であり、ボリュームの強度を実用的かつ効率的に分析したいトレーダーのために設計されています。6種類の鮮やかな色で構成され、StealthMode、NightVision、FrostVisionなどの表示モードを備えています。これにより、ボリュームデータを戦略的かつ視覚的に明確に把握することが可能です。初心者にとっても使いやすく、また上級トレーダーの補助分析ツールとしても最適です。MQL5 Marketで完全版にアップグレードすれば、さらなる機能と分析オプションが利用可能になり、トレード戦略の強化と意思決定の最適化に貢献します。
FREE
Volume Thermal Vision - Advanced Volume Analysis for MetaTrader 4 Unlock the power of volume analysis with Volume Thermal Vision, a sophisticated indicator designed to enhance your trading decisions. Developed by Jean Roso, this tool provides a dynamic visualization of volume intensity through a customizable heatmap, empowering traders to identify market trends and potential reversals with precision. Key Features: Multi-Protocol Visualization: Choose from five distinct protocols—Tactical, Steal
Weis Wave Scouterは、MetaTrader 5向けに開発された革新的なインジケーターであり、WyckoffメソッドとVSA(Volume Spread Analysis)の確立された原則を組み合わせています。精度と深みを求めるトレーダー向けに設計され、累積ボリューム波の分析を通じて市場を戦略的に読み取り、トレンドの反転ポイントや継続ポイントを特定する支援を行います。 Weis Wave Scouterは、クラシック、ナイトビジョン、オーシャンブリーズといったカスタマイズ可能なカラーテーマで、上昇波と下降波を色分けしたヒストグラムで明瞭に表示します。主な機能には、ボリュームピークの検出、低アクティビティゾーン(DeadZone)の識別、およびボリュームベースの波の反転に関するカスタマイズ可能なアラートが含まれます。また、エフォート対リザルト分析、因果関係、需給バランスといったWyckoffおよびVSA理論の基本概念をサポートしています。Brick Size、Volume Scale Factor、Pivot Lookbackといったパラメータで柔軟に調整でき、あらゆるスタ
Result Wave Recon Indicator Description Overview The Result Wave Recon indicator for MetaTrader 5 (MT5) is a sophisticated technical analysis tool designed to visualize accumulated price movements in the form of waves, combined with volume peak analysis. It offers customizable visual themes to suit various trading styles and preferences, making it a versatile addition to any trader's toolkit. The indicator plots bullish and bearish waves as histograms in a separate window, with volume peaks hig
MACD Crossfire
Jean Carlos Martins Roso
MACD Crossfire MACD-based indicator designed to help traders filter crossover signals using risk context, momentum, and volume. Instead of showing raw signals only, MACD Crossfire evaluates the quality of each setup and highlights when market conditions are not favorable for trading. What the indicator does Detects MACD crossovers Scores signal quality (0 to 5 stars) Measures market risk (0–100%) Shows whether momentum is gaining or losing strength Detects divergences between price and indi
VSA Smart Engine
Jean Carlos Martins Roso
VSASmartEngine - VSA Volume Intelligence System VSASmartEngine is a technical indicator for MetaTrader 5 based on VSA (Volume Spread Analysis) methodology. The system is designed to provide an objective reading of market activity, helping traders identify aggression, absorption, and exhaustion states by analyzing the relationship between volume and price action. The indicator features a dual-processing architecture, allowing the user to switch between the full VSA logic engine or a simplified h
フィルタ:
レビューなし
レビューに返信