Heiken Ashi Smoothed Bias
- インディケータ
- バージョン: 1.0

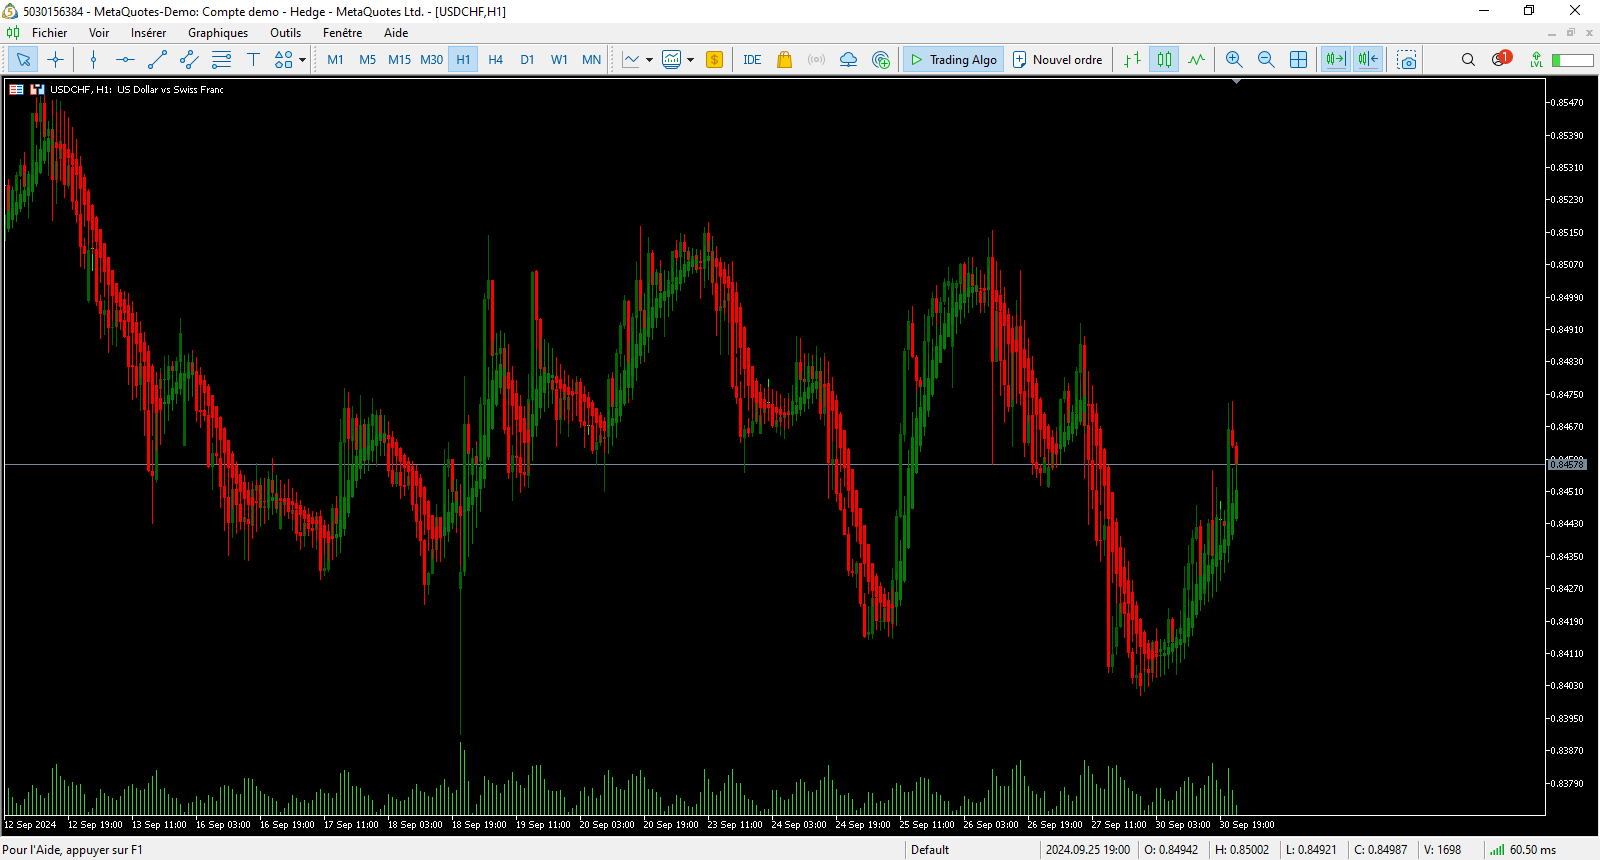
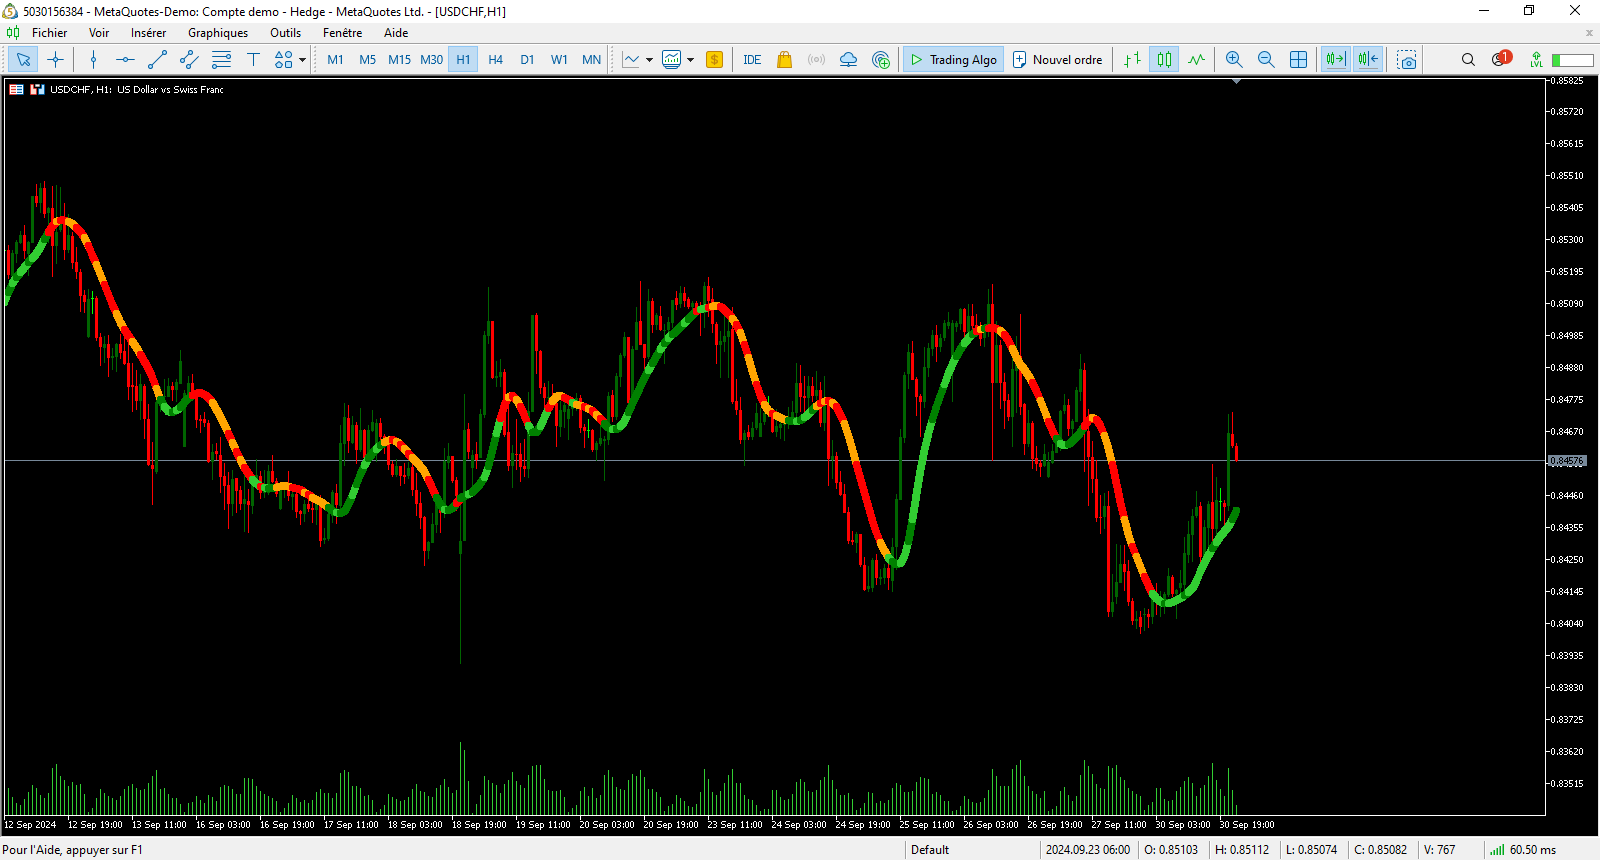
The script tries to determine the overall direction of the market, using smoothed Heiken Ashi candles. The coloring system (using bright and dark colors) is an attempt to detect strong market and weak market conditions. There's also an oscillator within the script
These are the features:
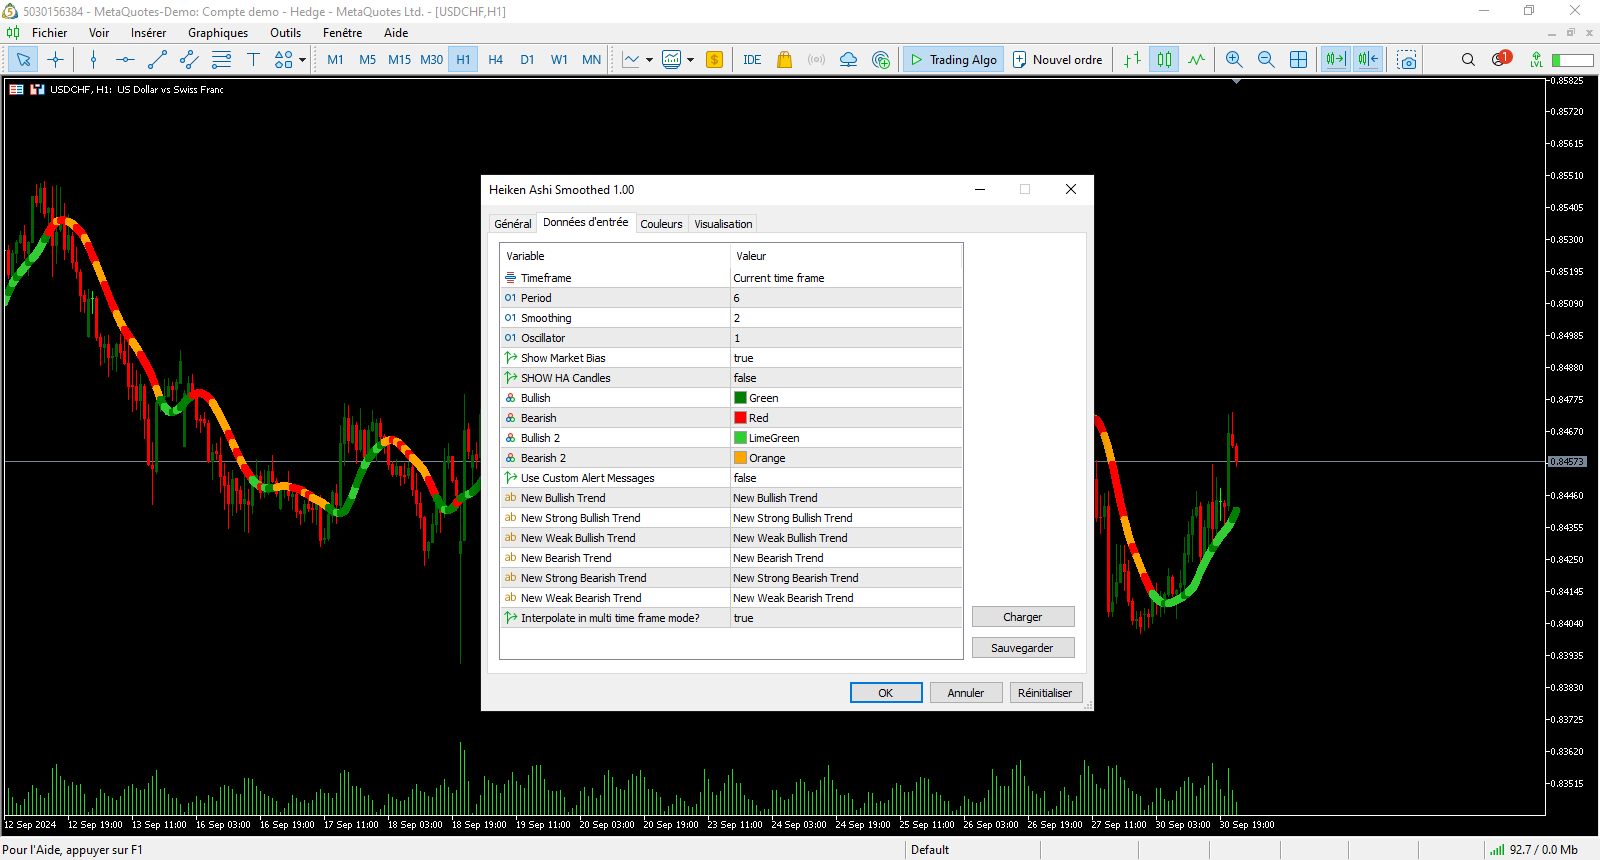
- Alert condition Features: You can now set alerts in the alert dialog for events like trend switch, trend strengthening and weakening; all for both Bullish and Bearish trend.
I also added the code for custom alerts, for those who would want that, but you would have to create a copy of the indicator and uncomment that code block. Don't worry, it's super easy, and the instructions have been included on the bottom of the code. - Multitimeframe Functionality: If you wish to use the Market Bias from a higher timeframe, you can do that now. Please note that this only allows higher timeframes (or your chart's current timeframe). If a lower timeframe is set, the script would default to the chart's current timeframe.
- More Customizability: You can now customise the script's plots without having to go to the 'Styles' settings.
MT4 Version https://www.mql5.com/en/market/product/124155
Good indicator. Thanks for sharing