Macd Rd MT5
- インディケータ
-
Mubashir Mohamed Quraish Albarakat
 welcome to my page.
My name is Mubashir and I am a programmer
My specialty is programming in financial markets.
I have several years of experience in programming and trading
Here I am ready to share my experiences and products with everyone - バージョン: 1.0
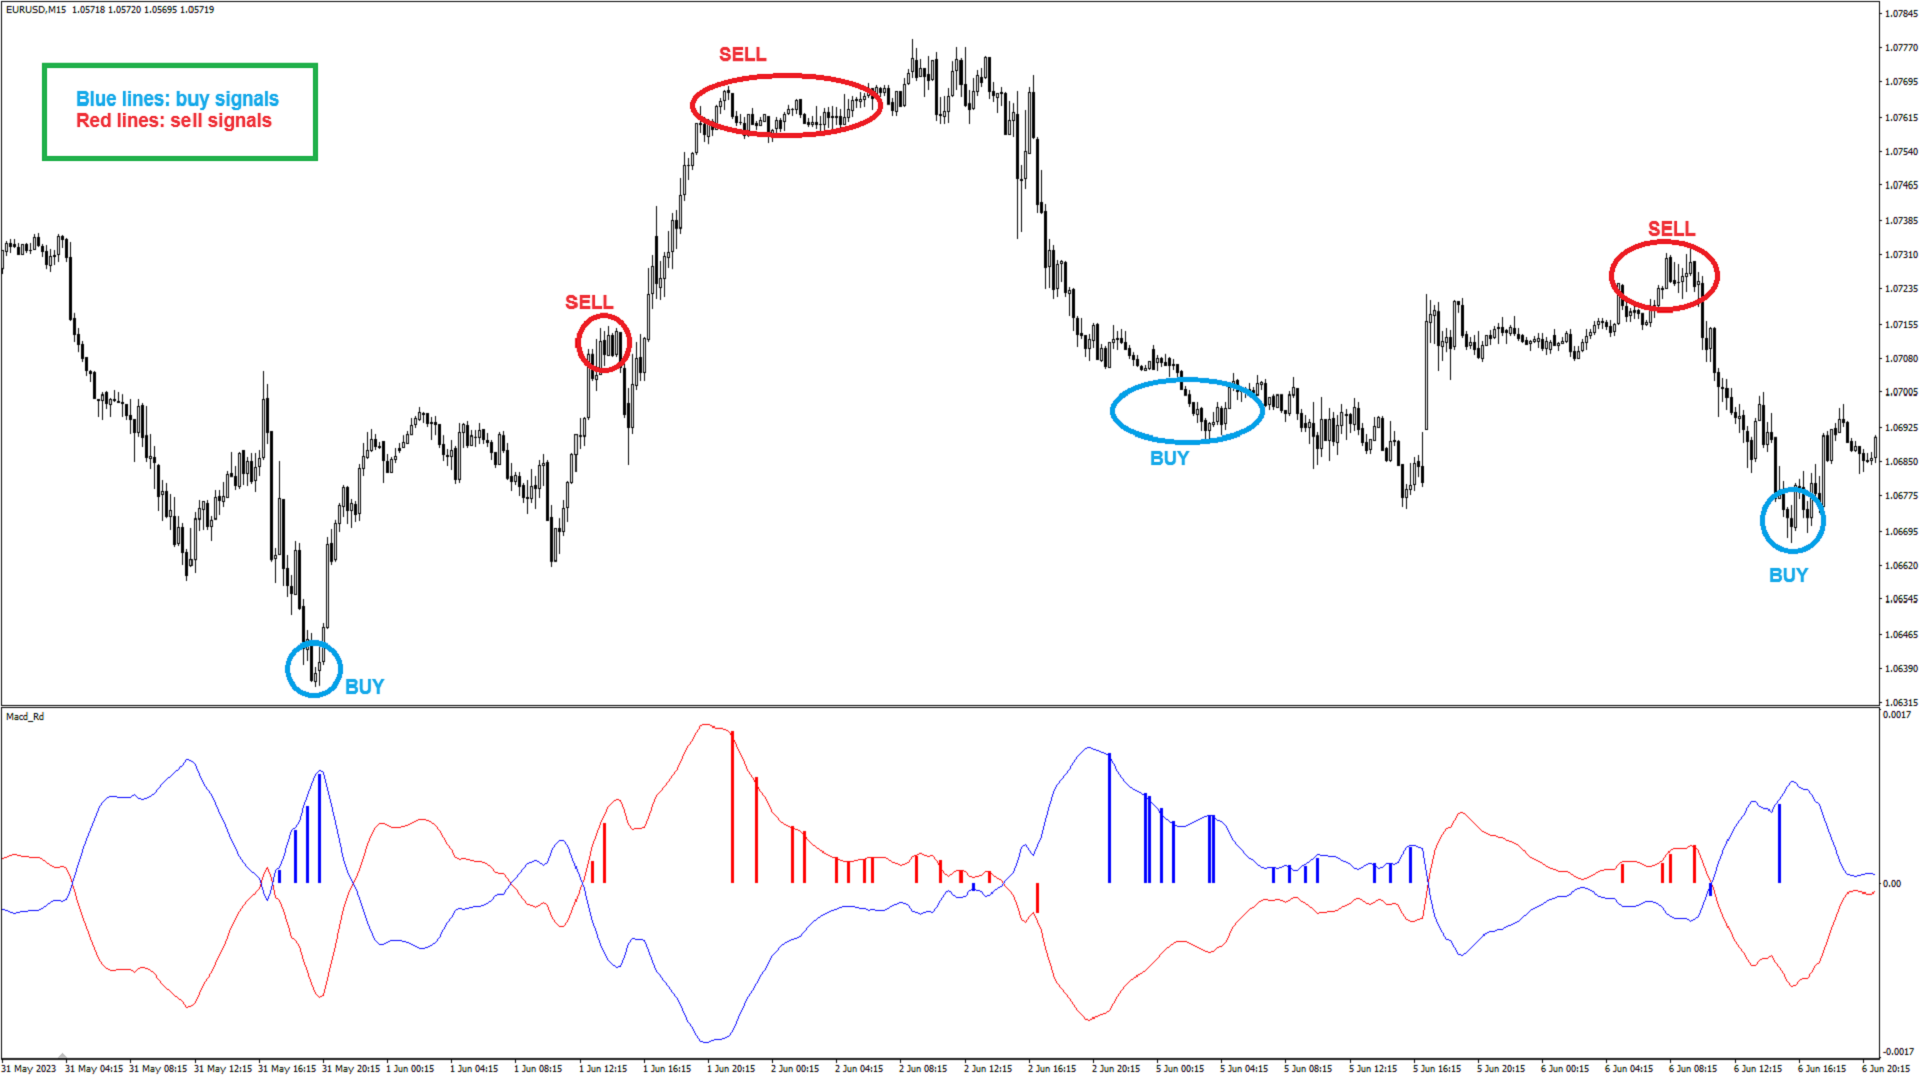
This indicator is based on the MACD indicator
Also, some candlestick patterns are used in it to identify better signals
Can be used in all symbols
Can be used in all time frames
Easy to use method
Adequate settings
Settings:
- period: The number of candles used to calculate signals.
- pFast: Like the MACD indicator settings
- pSlow: Like the MACD indicator settings
- alarmShow: If you want to receive an alert in Metatrader after receiving the signal, enable this setting
- alarmShowNoti: If you want to receive an alert on your mobile after receiving a signal, enable this setting