 MetaTrader 5
 エキスパート
 インディケータ
 ライブラリ
 ユーティリティ
 ウィジェット
 ルール
YouTubeにあるマーケットチュートリアルビデオをご覧ください
ロボットや指標を購入する
仮想ホスティングで
EAを実行
EAを実行
ロボットや指標を購入前にテストする
マーケットで収入を得る
販売のためにプロダクトをプレゼンテーションする方法
MetaTrader 5のための新しいテクニカル指標 - 214
 テクニカル指標からのシグナルは、株式および外国為替市場での取引の開始と終了に重要な役割を果たします。指標の本質は、将来の価格変動を予測することを目的とした金融銘柄価格の数学的変換です。
テクニカル指標をテストして、市場の動きとそれからの利益をより正確に予測します。
Индикатор RSI MT5 - это индикатор Metatrader 5, и суть этого технического индикатора заключается в преобразовании накопленных исторических данных на основе индикатора RSI. Сигналы показаны разными цветами свечей. Смотрите настройки, тестируёте. Это очень полезный индикатор и он точно должен быть у вас . The RSI in candlelight MT5 indicator is a Metatrader 5 indicator, and the essence of this technical indicator is to transform the accumulated historical data based on the RSI indicator. Signals a

Описание индикатора будет крайне коротким. Индикатор Коридор тренда показывает трейдерам зону в которой находится валюта и даёт понимание по какому тренду движется рынок. Визуально очень хорошо воспринимается. Уровни взяты и просчитаны не просто. Полезный индикатор для арсенала индикаторов трейдера. The description of the indicator will be extremely short. The Trend Corridor indicator shows traders the zone in which the currency is located and gives an understanding of which trend the market is
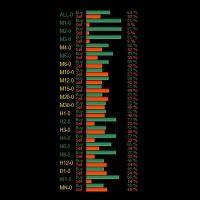
This MT5 indicator, Bull Bear Visual MTF (21 Time Frames), summarize the strength color graphic and percentages of power for both Bull and Bear in current market emotion stage which will show you in multi time frames and sum of the total Bull and Bear power strength which is an important information for traders especially you can see all Bull and Bear power in visualized graphic easily, Hope it will be helpful tool for you for making a good decision in trading.

ADX is one of the most versatile indicators, understanding it can help you understand the true nature of movements. It is often used within automatic experts to filter input signals. Unfortunately in its original form it is not immediately understandable. This version aims to simplify its reading by transferring the burden of interpreting its values to the code. The result is a clear graph where it is easy to identify the accumulation and distribution phases, trend phases and excesses. The color
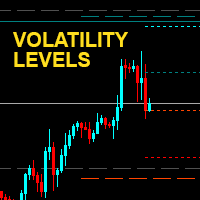
Transfer volatility levels to the chart to understand the nature of the ongoing movements. The levels are calculated based on the volatility recorded in the last few sessions. Easily identify possible targets or swing points for intraday , daily and weekly trading. In addition, the round price levels considered most important are also visible, here the highest trading volumes are usually concentrated. NO REPAINT

MCDX is an indicator based on specific formula to detect Buy and Sell momentum Red Bar means Price go up and Buy momentum. Green Bar means Price go down and Sell momentum" Height of RED bar > 50% means Bull is in control. i.e. RED more than GREEN to go buy. Lower of Green bar < 50% means Bear is in control. i.e. GREEN more than RED to go sell. DARKER RED COLOR - STRONG Up Trend or Strong Bullish Power
LIGHTER RED COLOR - WEAK Up Trend or Weak Bullish Power
LIGHTER GREEN COLOR - STRONG Down Tr
Aggression Wave RSJ は、成行買いと成行売りの差を足ごとに積み上げて波として描き、その日の注文フローを主導しているのがどちら側かを示します。 機能 各足のアグレッション・デルタ(成行買い − 成行売り)を計算し、波として累積します。 波を方向ごとに色分けするため、買い手と売り手の主導権の交代がすぐに分かります。 波の上にシグナルラインを描き、フローの方向を示します。 動作条件 実際の約定がある取引所銘柄:B3 の先物と株式(WIN、WDO、PETR4 …)、CME 先物(ES、NQ、CL、GC とそのマイクロ契約)。 ブローカーのデータが各約定のアグレッサー(買いまたは売り)を提供している必要があります。FX、暗号資産、CFD のデータにはこの情報がないため、指標は表示されません。 パラメーター 出来高の種類:実出来高または約定回数(ティック出来高)。 計算開始:直近2日から直近6か月まで。 AGGRESSION WAVE PRO Aggression Wave PRO は同じ計算を使い、足ごとの買い・売り・デルタを表示する8つの表示モード、設定可能なシグナルライン、
FREE
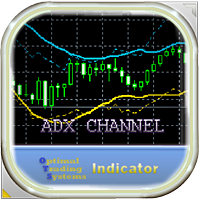
This indicator forms a channel based on the readings of the ADX (Average Directional Movement Index) indicator, displays and informs the trader of a price reversal at the boundaries of this channel, and can also report when the price touches the channel boundaries. It also draws additional dotted lines, which depend on the readings of the + DI and -DI of the ADX indicator. It also has an option for filtering signals depending on the readings of the stochastic. The channel drawn by this indicato
FREE
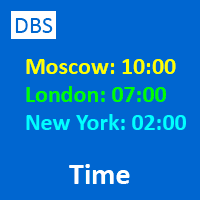
A small utility displays the time in five time zones. You can customize the display of one to five time zones. For each time it is configured: show or not; name; time offset from GMT; color; In general settings, you can change: date / time format ("hh: mi", "hh: mi: ss", "yyyy.mm.dd hh: mi", "yyyy.mm.dd hh: mi: ss") font name; font size; offset from the left edge of the chart; offset from the top edge of the chart;
FREE
The Relative Strenght Index presented to the world in 1978 by J. Welles Wilder Jr. in his book " New Concepts in Technical Trading Systems " is widely used around the world in several ways, not only with the traditional approach of Overbought and Oversold states, which in several cases and depending on the assets and timeframes it just simply doesn't work anymore . BUT, this indicator has its value when used, for instance, looking for divergences between its measuring system and the Prices appea

The indicator makes calculations based on data obtained from one of seven (7) moving averages and colors the chart.
Simple moving averages are those that have only one important calculation parameter - the period.
The shift in the indicator is not used.
There is a shift trick setting, it is used to smooth the result of calculations. You can see the changes if you reduce this parameter to 1 (minimum value).
shift trick must always be less than the period value.
Available averages:
MA Simpl
FREE
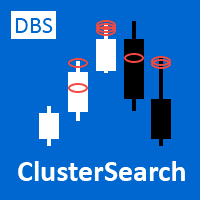
Professional traders know that volume is the fuel for price movement. Large players try to hide their true intentions, but they can be recognized by volume bursts. The standard vertical volume does not show us specific price levels, but the cluster volume and especially its surges provide a very clear picture and specific price levels (areas).
The DBS Cluster Search indicator searches for clusters of the specified size in tick data and highlights them with colored figures on the chart. These l
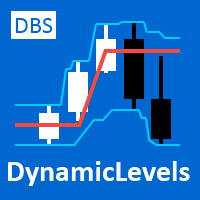
The indicator plots dynamic POC, VAH and VAL levels for a specified period from tick data. POC - Point Of Control, the price at which the maximum volume has accumulated over a certain period of time (POC in the volume profile). VA - Volume Area, the zone of the fair value of the asset. VAH - Volume Area High. VAL - Volume Area Low. The DBS_DynamicLevels indicator plots dynamic levels where the calculation point is the maximum volume level (POC) and zone VAH / VAL. The indicator shows the history
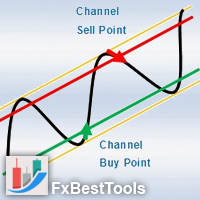
Channels Indicator is an All-In-One Indicator with a powerful calculation engine. The Indicator contains 4 different and usual methods for finding channels on the market. Indicator is powered by a visual interface and with various selections of alerts and notifications.
Testing Indicator : Strategy Tester does not respond to your clicks on panels (This is metatrader tester limitation). Thus input your desired settings on the indicator pre-settings and test.
Using Indicator :
Display 4 Typ
The Better Volume indictator improves the comprehension on volume by coloring the classical histogram bars . The colors point out differents nature of volume .
The Better Volume OnOff allows to open/close the subwindow through a botton or using the keyboard only. There is the possibility to customize 3 symbols and assign them different parameters for each time frame .
The indicator improves the comprehension on volume by coloring the classical histogram bars : CLIMAX UP -

If you have the opportunity to read the book " Trend Trading - A Seven-Step Approach to success " by Daryl Guppy, you will have a great deal of information about how to "read" the market. In his book Daryl show, among other things, how can we use a visual tool to measure the volatility and trend between Long and Short-term periods: The GMMA - Guppy Multiple Moving Averages .
Instead of using his original idea of having 12 Exponential Moving Averages in your chart - which could be very CPU-deman
FREE

We at Minions Labs always like to defy the stablished systems and beliefs trying new things and new ways of seeing and interpreting the Market Data. And all starts with the following question...
WHAT IF...
You give more relevance and focus on the Wicks/Shadows on the candlesticks? And Why? In volatile markets wicks play an important role on determining who is winning the the fight between Bulls and Bears , and more than that, Higher and lower wicks can present you with a good status of the curr
FREE
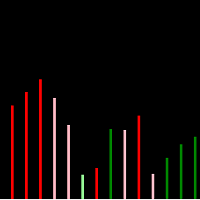
Coiote Book Balance é um indicador que monitora o livro de ofertas e indica de maneira simplificada o níveis de renovação de ordens agrupados no timeframe gáfico, mostrando quanto o maior lado renovou e a diferença dessas renovações. Além disso, é possível visualizar em quais preços estão as maiores ordens da cada lado, o preço teórico dessa liquidez e a quantidade de lotes em tempo real. Para correto funcionamento do indicador é preciso que o livro de ofertas seja aberto antes da inclusão do in
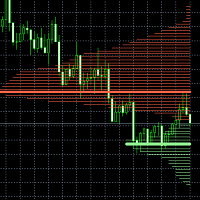
This easy to setup indicator shows you the market volumes in a different way, with support and resistance as showed. You can setup: - Backdays volume to show - Heiken Ashi candle view It works for every kind of graph and every kind of period. The program shows the volumes based on the number of candles displayed in the chart: the more candles the more volumes. Enjoy this very useful indicator.
Please feel free to message me to report any kind of improvements! :D

片側最大7本のフィボナッチ・ピボットレベル。リテスト回数を表示するグレード別の需給ゾーンをお探しなら: Supply Demand RSJ PRO Pivot Point Fibo RSJ は、日足のピボットポイントと、フィボナッチ比率で計算したサポート・レジスタンスレベルを描画します。 前日の高値・安値・終値から、最大7本のサポートレベルと7本のレジスタンスレベルを表示します。トレーダーはこれらのレベルを、日中のエントリー、決済、ストップ配置を計画するための参考エリアとして利用します。 特徴 最大7本のサポートと7本のレジスタンス 4種類の計算方法: 3種類のフィボナッチ方式とクラシックピボット 各レベルの色を個別に設定可能 入力パラメータ Pivot Type Pivot Fibo RSJ1 = フィボナッチ比率セット1 Pivot Fibo RSJ2 = フィボナッチ比率セット2 Pivot Fibo RSJ3 = フィボナッチ比率セット3 Pivot Fibo Classic = クラシックピボットの計算 Minimum Pivot Levels: 片側3、4、5、6、7本のい
FREE

今日は。. 今日、私たちは新しい指標ポイントを提示しますTochanneltomson https://youtu.be/dmgtVwX3nvg
https://youtu.be/Wr7N2WEY8lA -この指標は、チャネルから売買の方向、指標の緑と赤の窓の価格偏差のレベルまで計算されます。 偏差レベルが高いほど、反転の確率は大きくなります。 インジケータの読み取り値は新しいバーごとに再計算され、補助バーとしてのみ使用することをお勧めします
通信のための連絡先777basil@mail.ru 、私たちは専門家、あなたの仕事のための指標を準備します。
//入力パラメータ: indPeriod = 20; // Период усреднения для вычисления индикатор indShift = 0; // Отклонение от основной линии indDeviation = 2;

今日は。. UturnAnalysis - インジケータの品質を確認するには
私たちは、MICEXの先物および株式市場のためのこの指標に基づいて逆転に関するシグナルの試用版の無料配布を開始しました
技術サポート、私に書き込みます777basil@mail.ru 、またはコメントであなたのメールアドレスと私たちはあなたにアラートが送信されるアカウントの詳細を送信します無料で。
https://youtu.be/q228LvLec-Y
私たちは一度にいくつかのツールに置きます https://youtu.be/Wr7N2WEY8lA あなたが有用な何かを行うことができます信号の間に、モニターであなたの時間を節約します,
反転ゾーンインジケータは、一定の時間におけるシンボル状態の複雑な分析器として設計されています。
今日、我々はあなたが事前に反転レベルを知っていれば、フラットとオーバークロック預金戦略に適しているベタバージョンを提示します,
その後、行動を起こして利益を修正したり、損益分岐点にストップロスを移動したり、必要に応じて追加のボリュームを追加して取引を拡大したり
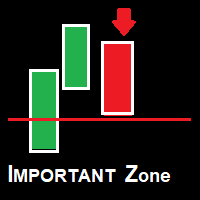
Zona Importante. O indicador Zona Importante é um indicador desenvolvido com todo meu conhecimento no mercado. o que voce podera esperar dele? o Indicador gerara alerta em toda e qualquer Reversao, seja uma reversao de fato ou um simples pullback ou seja a cada mudanca de direcao ocorrera um alerta. - Beneficios: - Nao deixara voce perder oportunidade.
O sell signal significa que uma nova onda de queda ocorrera. O buy signal significa que uma nova onda de alta ocorrer
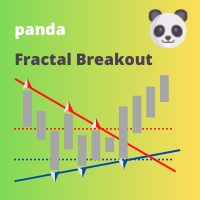
This indicator shows Fractal Breakout Trendlines and Support and Resistance
The Fractal Ascending Trendline and Fractal Descending Trendline are drawn from the last valid fractals. Breakouts can be taken above or below these trendlines. Horizontal lines are drawn from the Last upper and Last lower fractal to show support and resistance levels. Horizontal Upper and Lower Intersection lines are drawn where a fractal trendline has been last intersected, to show where to place a buy or sell order
FREE

Non standard attitude to the standard moving average indicator. The essence of the indicator is to determine the strength and speed of the price direction by determining the tilt angle of the moving average. A point is taken on the fifteenth MA candle and a point on the last closed MA candle, a straight line is drawn between them, it is movable and on a hemisphere shows an angle of inclination from 90 degrees to -90. above 30 degrees is the buying area, below -30 degrees is the selling area. abo
Bar Countdown is a simple indicator for MetaTrader 5 that shows the time remaining of the each candle. It can be placed in any corner of the chart or near of the price close and it'll help you to know
if the current candle is ending. Choose the counter format between HR:MIN:SEC and MIN:SEC It is so easy to use, configure the color, size and counter position on the chart and that's it!!! The Countdown starts now!
Updates: 2021/02/28; v1.0: Initial release 2021/03/16; v1.1: Minor code changes
FREE
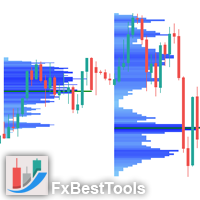
Definition : VPO is a Volume Price Opportunity. Instead of using bars or candles with an Open, High, Low, and Close price, each "bar" in a Market Profile is represented by horizontal bars against the price It is called Market Profile terminology.
In other words volume-price-opportunity (VPO) profiles are histograms of how many volumes were traded at each price within the span of the profile.
By using a VPO chart, you are able to analyze the amount of trading activity, based on volume, for each
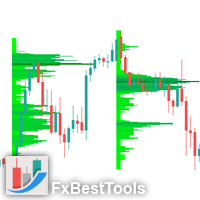
Definition : TPO is a Time Price Opportunity. Instead of using bars or candles with an Open, High, Low, and Close price, each "bar" in a Market Profile is represented by horizontal bars against the price It is called Market Profile terminology.
In other words time-price-opportunity (TPO) profiles are histograms of how much time was spent at each price within the span of the profile.
By using a TPO chart, you are able to analyze the amount of trading activity, based on time, for each price level

The trading system is designed to work with gold on time periods: 30M, 1H. The indicator allows you to adjust to the market situation.
Parameters for 1H : PERIOD=9F , FILTER=300 .
Parameters for 30M : PERIOD=22B , FILTER=450 .
A small adjustment to a specific broker is allowed .
If you change the amount of history displayed, you may also need to adjust the parameters.
The indicator is not redrawn.
"Gold n XAU" uses different rules for entering a trade and different rules
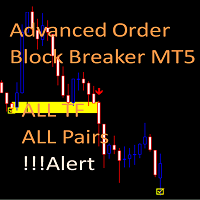
MT5 Version Dashboard: Free scanner to monitor All pairs and timeframes. Please contact me after purchase, i will send it to you! MT4 version indicator: https://www.mql5.com/en/market/product/59127 Tip: This is an indicator for real-time signal display. When the indicator is loaded and running on the chart, the past signal cannot be displayed Market structure changes as price reverses And filter with all import features built inside one tool. Breaker's smart algorithm detects the reverses,
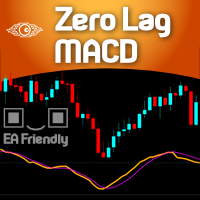
For those who are fans of the traditional MACD ( Moving Average Convergece/Divergence ) indicator, here it is a way faster indicator that could be very useful for intraday trading. Of course it could be used in higher timeframes, with the proper settings. Here at Minions Labs we always encourage traders to calibrate every single indicator you have to extract and distill every drop of good information it has for you. And this is the case with this speedy friend... This Zero Lag MACD could be used
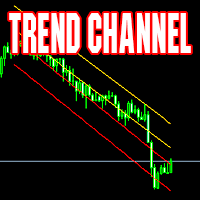
Channel indicator. Calculated dynamically. Suitable for both working in the direction of the trend and inside the channel. Excellent results when working on timeframes from 4H towards the center of the channel.
Example of use: when the price touches one of the extreme lines - opening a deal in the center of the channel with a take profit on the nearest middle line of the indicator. MT4 version The indicator can be used in expert advisors (4 buffers), receiving data in a standard way. Support:
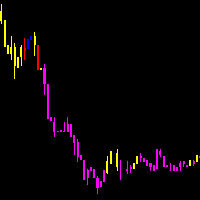
As médias coiote automatizam a leitura de analise de médias rápidas e lentas no saldo do volume e preço. Quando as médias estão em modo compra, a coloração do candle fica azul.
Quando as médias estão em modo venda, a coloração do candle fica magenta. Quando a coloração fica verde ou vermelho, temos a tomada das médias no volume mas não no preço, quando isso ocorre é um sinal de atenção.
A concepção do indicador é ser utilizado para operações em saída de consolidações na direção da tendencia do
FREE

GIVE A LOOK TO MY OTHER PRODUCTS ! 100 % PER MONTH PROFIT----CONTACT ME FOR MORE INFO !
The Parabolic SAR (PSAR) helps trader identifying direction of the stock movement and also provides them with the entry and exit. This indicator on the chart appears as a series of dots either above or below the price bars. When the Dots are below the price bar is then the price movement is considered to be bullish and when the Dots are above the price bar then the price movement is considered to be bearish
The Moving Average Convergence Divergence Indicator (MACD) is both a trend–seeking and momentum indicator which uses several exponential moving averages set to closing prices to generate trading signals. This Version brought to you the Stochastic confluence filtering the signals, this set ups amazing entries on índices and stock futures trading.
We added many types of alerts plus the Delay Cross Filter to aid in your search for better opportunities in the market.
Product Features Sound alert
SHADOW vous donne des signaux d'achat et de vente solides avec un risque minimal. Vous pouvez voir dans quelle direction le prix évolue et la force du mouvement. Shadow filtre le bruit du marché et améliore radicalement les performances des traders.
Points forts: Détection visuelle efficace des tendances. Bruit du marché des filtres Ne repeint ni ne recalcule jamais. Signaux strictement sur "fermeture du bar". Fonctionne dans tous les symboles. Pop-up intégré, e-mail, notification push et
FREE
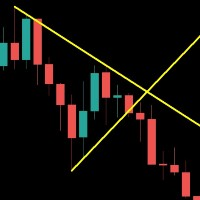
Save your time . Select area and the trend line will draw automatically . Draw a support and resistance line for the selected range with two mouse clicks . If you need to, you can also draw a line for support and resistance based on separate areas.
The resistance trend line is drawn based on the first and last highs inside the selected area; The support trend line is drawn based on first and last lows inside the selected area;

Entry Points Proは、注文を出す前に、どこでエントリーし、どこにストップを置き、どのロットで取引するかを示します。 価格 現在 199 USD、この価格での販売は 8 本です。その後は 249 USD、最終価格は 349 USD です。
私は相場のトレードで収入を得ており、それを公開しています。だから、このインジケーターを誰にでも売る必要はありません。自分の頭で考えるトレーダーのためのツールであり、魔法のボタンではありません。 ブレイクがなければ取引もありません。グレーの矢印はキャンセルされたシグナルです。価格がシグナル足をブレイクしなかったため、エントリーも損失もありません。 矢印はローソク足の確定時に表示され、リペイントしません。設定は2つ:あなたの資金と1回のトレードあたりのリスクです。 お支払い前にご確認ください:無料デモはMT5のストラテジーテスターで動作し、2分で済みます。ご購入後は、私が個人的に設定をお手伝いします。 2019年、私はこのインジケーターの実力を世界中に示しました。そのシグナルに従って手動で、リアル口座で、公開の場でトレードしたのです。口座は
Candle Timer Countdown は、現在の足が確定するまでの残り時間を表示します。ブローカーのサーバー時刻で毎秒更新し、新しいティックが来なくても止まりません。 同じカウントダウンを注文パネルにも表示したいですか? OCO Panel PRO はパネルの下部に表示し、ワンクリック注文と保存済みの OCO 決済と一緒に使えます。 表示内容 残り時間を mm:ss、h:mm:ss、D1・W1・MN では日数で表示。 銘柄が取引時間外のときは「Market closed」と表示。 当日の変化率 %、銘柄、時間足(それぞれオン・オフ可能)と、タイマーの前に付ける任意のテキスト。 位置 四隅、上部中央・下部中央、または現在価格の横。 マウスでドラッグ可能(クリックしてそのままドラッグ。事前の選択は不要)。時間足を変えても位置は維持されます。 水平・垂直の距離をピクセルで設定。 色とフォント 暗い背景にも明るい背景にも見やすい自動カラー、固定カラー、または足の方向による緑/赤。 足の残り数秒の警告色(既定はオレンジ、10 秒)。 フォント名、サイズ、太字。 アラート 足の確定前、指定
FREE
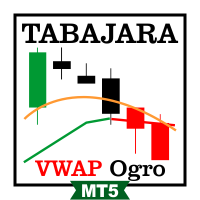
VWAP とトレンドを示す色付きローソク足を備えた無料の Tabajara セットアップ。どの銘柄でも使えます。 Setup Tabajaraは、「ウォール街の鬼」として知られるブラジルのトレーダーによって作成されました。
この設定のアイデアは、トレーダーに価格の現在の傾向とグラフで探す必要のある操作のタイプを示すことです。
手術 これは、ろうそくの閉まりとVWAPを午前10時40分まで配置し、その後20期間の算術平均で、ろうそくを4つの可能な色でペイントすることによって行われます。 緑->上昇傾向の価格上昇(購入のエントリポイントを検索) 黒->強気トレンドでの価格修正(購入のためのエントリーポイントの検索) 赤->価格が下落傾向にある(販売用のエントリポイントを検索) 白->下降トレンドでの価格修正(販売のエントリポイントを検索) さらに、次のインジケーターもスクリプトに追加しました。 8期間の指数平均:短期的な価格変動を特定するため 50期間の算術平均:中期的な価格変動を特定する 80期間の指数平均:中期的な価格変動を特定する 200期間の算術平均:長期的な価格変動を特定する
FREE
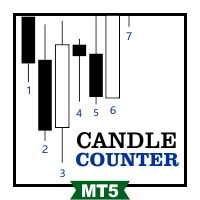
Candle Counter RSJ は、その日の最初のローソク足から数えた各ローソク足の番号を表示します。 その日の最初のローソク足が1番となり、新しいローソク足ごとにカウントが1ずつ増えます。 入力パラメータ 偶数・奇数・すべての番号の表示切り替え ローソク足と番号の間隔 文字のフォントサイズ 文字のフォント色 使い方 ローソク足のカウントは、市場が開いてからのバー数に基づく手法で役立ちます。たとえば、その日の3本目のローソク足以降にのみ取引するルールや、最初の1時間に何が起きたかを振り返るときに便利です。 小さな時間足では、すべてのローソク足に番号を表示すると数字が重なることがありますが、偶数のみ、または奇数のみを表示すればチャートをすっきり保てます。 カウントは、ご利用のブローカーのサーバー時間を基準に、新しい取引日の最初のローソク足で再び1から始まります。 あらゆる銘柄と、あらゆる日中の時間足で使用できます。 ご質問がありましたら、ダイレクトメッセージでお送りください: https://www.mql5.com/en/users/robsjunqueira/ 詳しいマニュアル
FREE

Delta Aggression Volume は、成行買いと成行売りのどちらが多く取引されたかを足ごとに表示します。B3 や CME 先物など、実際の約定データがある銘柄で動作します。 機能 各足のアグレッション・デルタ(成行買いの出来高 − 成行売りの出来高)を計算します。 各足の差をサブウィンドウに描き、優勢だった側の色で表示します。 動作条件 実際の約定がある取引所銘柄:B3 の先物と株式(WIN、WDO、PETR4 …)、CME 先物(ES、NQ、CL、GC とそのマイクロ契約)。 ブローカーのデータが各約定のアグレッサー(買いまたは売り)を提供している必要があります。FX、暗号資産、CFD のデータにはこの情報がないため、指標は表示されません。 パラメーター 出来高の種類:実出来高または約定回数(ティック出来高)。 計算開始:直近1日から利用可能な全期間まで。 DELTA AGGRESSION VOLUME PRO Delta Aggression Volume PRO は同じ計算を使い、リバースバー、2つの計算モードを持つレンジチャネル、総出来高の移動平均、6つの設定可能
FREE
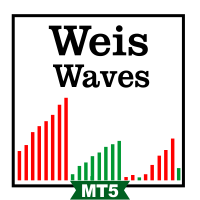
Weis Waves RSJ は、各価格ウェーブの出来高を合計し、上昇と下降が交互に現れるウェーブごとの累積出来高をヒストグラムで表示します。 これにより、各ウェーブの努力(出来高)と結果(値幅の進行)を比較し、動きが出来高に支えられているのか、勢いを失いつつあるのかを確認できます。 読み方 ヒストグラムの各バーは、1つの価格ウェーブの間に取引された出来高の合計です。 トレンドが健全なときは、通常、トレンド方向のウェーブのほうが調整のウェーブよりも出来高が大きくなります。 価格が高値または安値を更新しても、そのウェーブの出来高が前のウェーブより小さい場合、努力が同じ結果を生んでいないことを意味し、動きが勢いを失いつつある兆候となることがあります。 このインジケーターはサブウィンドウに表示され、ティック出来高または実出来高が提供されているすべての銘柄と時間足で使用できます。 ご質問がありましたら、ダイレクトメッセージでお送りください: https://www.mql5.com/en/users/robsjunqueira/ 詳しいマニュアル: https://www.mql5.com/j
FREE

VWAP Fibo Bands RSJ は、選択した期間の VWAP を描画し、その周囲にフィボナッチ比率に基づくバンドを作成します。 このインジケーターは VWAP の周囲に10本のバンドを描画します。バンドは価格が出来高加重平均価格からどれだけ離れたかを示し、エントリー、決済、ストップを計画するための参考レベルとして利用できます。 バンドは30分足以下の時間足で特に読み取りやすくなります。 入力パラメータ Calculation Volume Type Calculation Price Type VWAP Period Time 各バンドは VWAP から一定のフィボナッチ距離に描画されるため、同じレベルを日ごとに比較できます。 ご質問がありましたら、ダイレクトメッセージでお送りください: https://www.mql5.com/en/users/robsjunqueira/ 詳しいマニュアル: https://www.mql5.com/ja/blogs/post/780567 同じ作者の製品(MetaTrader 5): Trend Confluence PRO Volume
FREE

無料のBlueDigitsFxツール + エコシステムアクセス この無料ツールは、BlueDigitsFxトレーディングインフラエコシステムの一部です。 BlueDigitsFxボットを通じて、アップデート、ワークリソース、製品リリース情報、および公式エコシステムへのアクセスを取得できます。 Telegramエコシステム
ウェブサイト
MT4版
BlueDigitsFx Open Trades MT5 — アクティブなトレード管理のためのリアルタイムPipsモニター BlueDigitsFx Open Tradesは、すべての未決済ポジションの合計損益(Pips)をリアルタイムでチャート上に表示する無料のMT5ユーティリティです。 見やすいカラー表示により、複数の通貨ペアやポジションにおける利益・損失状況を素早く把握できます。 複数のウィンドウを切り替えることなく、ポジション状況をより明確に確認し、取引セッションを効率的に管理したいトレーダー向けに設計されています。 未決済ポジション全体のパフォーマンスをチャート上に常時表示することで、MetaTraderのターミナル画面を頻繁
FREE
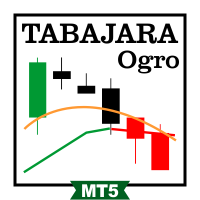
トレンドを色付きローソク足で示す無料の Tabajara セットアップ。どの銘柄でも使えます。 Tabajara セットアップは、「The OGRO of Wall Street」として知られるブラジルのトレーダーが考案したものです。現在のトレンドと、チャート上で狙うべき取引の種類を示します。 仕組み このインジケーターは終値と20期間の単純移動平均線を比較し、ローソク足を4色で表示します: 緑: 上昇トレンドで価格が上昇中(買いエントリーを狙う) 黒: 上昇トレンドで価格が調整中(買いエントリーを狙う) 赤: 下降トレンドで価格が下落中(売りエントリーを狙う) 白: 下降トレンドで価格が調整中(売りエントリーを狙う) 追加の移動平均線 8期間指数移動平均線: 短期の動き 50期間単純移動平均線: 中期の動き 80期間指数移動平均線: 中期の動き 200期間単純移動平均線: 長期の動き ご質問がありましたら、ダイレクトメッセージでお送りください: https://www.mql5.com/en/users/robsjunqueira/ 詳しいマニュアル: https://www.mql
FREE
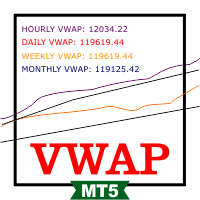
VWAP RSJ は、1時間・日次・週次・月次の VWAP ラインを同じチャートに表示します。 大口の機関投資家やファンドは、市場への影響をできるだけ抑えてポジションを建てたり手仕舞ったりするために VWAP を利用します。一般に VWAP より下で買い、上で売ろうとするため、価格は平均値の方向へ引き戻されやすくなります。 このインジケーターは4つの期間の VWAP をまとめて表示し、それぞれに対して価格がどの位置にあるかを確認できます。 読み方 各 VWAP ラインは、それぞれの期間の始まりにリセットされます。1時間 VWAP は毎時、日次 VWAP は毎日、週次 VWAP は毎週、月次 VWAP は毎月、新たに計算が始まります。 価格が VWAP より上にあるときは、買い手がその期間の平均価格より高い価格を支払っていることを示し、下にあるときは、その期間は売り手が主導していることを示します。 2本以上の VWAP ラインが近くに集まっている価格帯は、異なる期間のトレーダーが同じ価格を見ているため、サポートやレジスタンスとして機能することがよくあります。 ティック出来高または実出来高
FREE
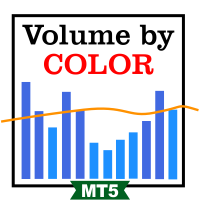
Volume By Color RSJ は、出来高が自身の移動平均を上回ったときに出来高バーを濃い色で表示するため、通常と異なる動きのあったローソク足が目立ちます。 オプションの4色モードでは、各ローソク足の出来高の強さを段階的に表示します。 初期設定では、各バーを出来高の20期間単純移動平均と比較します。平均の種類と期間は入力パラメータで変更できます。 使い方 色分けされたバーにより、通常を上回る出来高を伴って発生したブレイクアウト、反発、クライマックスのローソク足を簡単に見つけられます。 高い出来高で水準をブレイクしたローソク足は、その動きに多くの参加者がいることを示し、出来高の少ないブレイクアウトは関心が薄いことを示します。 4色モードでは、各色が平均と比較した出来高の強さの範囲を表し、弱いものから非常に強いものまで段階的に示します。 このインジケーターはサブウィンドウに表示され、あらゆる銘柄と時間足で使用できます。 このインジケーターが役に立ったと感じたら、レビューを書いていただけると幸いです。他のトレーダーが見つけやすくなります。 詳しいマニュアル: https://www.
FREE

コーシー分布は、ファットテール分布の典型的な例です。太い尾は、確率変数が中央の傾向から逸脱する確率が非常に高いことを示しています。したがって、正規分布の場合、確率変数の数学的な期待値からの3標準偏差以上の偏差は非常にまれであり(3シグマルール)、コーシー分布の場合、中心からの偏差は任意に大きくなる可能性があります。このプロパティは、市場の価格変動をシミュレートするために使用できます。したがって、コーシー分布は、予期しないおよび/または予測できない要因によって引き起こされる大きくて急激な価格変動を除外することができます。 インジケーターを使用すると、使用する価格を選択できます。また、そのインジケーター操作は、次のパラメーターを使用して構成されます。 iPeriod-計算するバーの数 PercentLvl 1-3-レベルの偏差(パーセント)、許容値は0より大きく100未満(デフォルトでは-50、20、10パーセント) Shift-レベルの継続を右に トレーディングでのこの指標の使用は、価格が最高または最低レベルを超えた後、平均値に戻る可能性が高いという仮定に基づいています。つまり、価格が
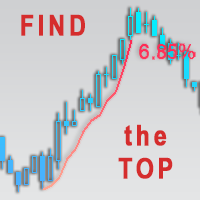
TrendMeasurer indicator manual / TMi manual The indicator is designed to help the user to find the end point of a strong trending price movement. Important - END. Not start. How the indicator works The first price impulse and its subsequent pullback form a certain "critical mass" which acts as "fuel" for further price movement. The production of this fuel indicates the potential end of the trend. Both volume and indicator calculated in a certain way from price data can be the fuel. The amount of
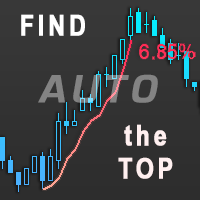
TrendMeasurer indicator / TMi The indicator is designed to help the user to find the end point of a strong trending price movement. Important - END. Not start. How the indicator works The first price impulse and its subsequent pullback form a certain "critical mass" which acts as "fuel" for further price movement. The production of this fuel indicates the potential end of the trend. Both volume and indicator calculated in a certain way from price data can be the fuel. The amount of "fuel" can be
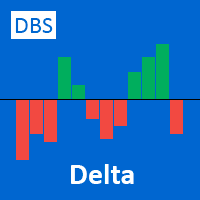
The delta indicator is used to display the difference between the volume that passed on the exchange at the Ask price and above (market buys) and the volume that passed at the Bid price and below (market sales). This indicator shows the delta of each candle on the timeframe of your choice. The data is displayed as a colored histogram in a separate indicator window. The indicator is calculated from the tick history, therefore, to speed up the calculations and reduce the load on the system, the n

The indicator draws a normal chart by coloring it in colors based on prices calculated by the Heiken Ashi indicator algorithm.
That is, the shape of the candles does not change.
In fact, this is the same Heiken Ashi that does not distort the price chart.
Then there will be a drawing of a cat, because there is nothing more to write about the indicator. .
FREE
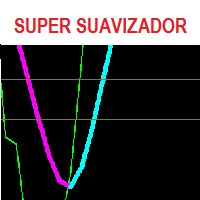
Indicador en MQL5 que obtiene el promedio de 10 EMAS que son alineadas y procesadas según Fibonacci luego el promedio es suavizado" Se ingresa un número de 2 a N que multiplica los EMA-Fibonacci y por consiguiente aumenta los fibonacci, resultando un promedio. Se ingresa un número que suaviza los EMA-Fibonacci. Considerando los números 1/1 seria la suavización minima. Considerando los números 3/5 seria la suavización media. Considerando los números 10/30 seria la suavización alta.....etc

ProFactor is an indicator generating signals based price on the famous profit factor formula. The calculation is simply defined as gross GREEN BARS divided by gross RED BARS.
That's it in a nutshell, but sometimes the simplest things hold the most value.
So let's imagine your trading system's gross profit for the past year was $40,000 and your gross losses were $20,000. Your Profit Factor would be 2. The ProFactor calculation works on the price of the asset instead of the strategy outco
FREE

An effective indicator that highlights candles with increasing volumes, overshadowing those with shrinking volumes. Also suitable for Forex because it uses tick_volume.
You can set the colors to your liking. It will be easier to spot trends and possible reversals. The increasing volumes indicate the presence of large investors and therefore determine the reliability of the candle under observation
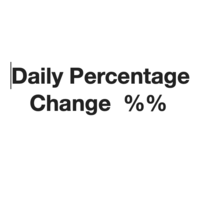
Daily Percentage Change (MetaTrader indicator) — calculates the change of currency rate related to the previous daily close and displays it in percentage points in the main chart window of the platform. Additionally, it can display the weekly and monthly percentage changes. Different colors can be set for positive or negative price increases. Also, a small customizable arrow helps to visualize the price change direction. If your broker uses an unconventional time zone, the indicator can use
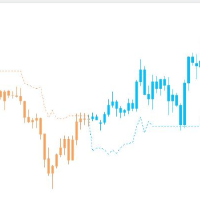
Stable trend index without clutter The index optimizes the moving average and removes the unstable clutter It can also be used in any other commodity It is best used in mainstream currencies such as EURUSD, USDJPY, GBPUSD and AUDUSD
The time period is 1 hour
I only know a little English, please forgive me if you don't understand I will always improve this indicator
Description
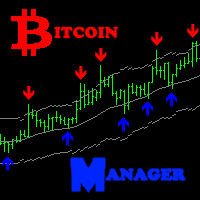
Bitcoin Manager is the best indicator for trading Bitcoin cryptocurrency. It is calculated based on the price deviation from the moving average line channel. Ascending and descending arrows indicate potential points and levels for opening buy and sell positions.
How to use?
We strongly recommend using this indicator on the H1 timeframe. An up arrow indicates a buy level. Down Arrow - Sell Level.
Parameters
Maximum History Bars - maximum count of history bars to calculate. _GRAP
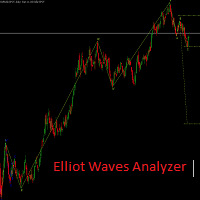
Elliot Waves Analyzer calculates Elliot Waves to Help Identify Trend direction and Entry Levels. Mainly for Swing Trading Strategies. Usually one would open a Position in trend direction for Wave 3 or a Correction for Wave C . This Indicator draws Target Levels for the current and next wave. Most important Rules for Elliot Wave Analysis are verified by the Indicator. This free version is limited for Analyzing one Timperiod Waves. Waves are Shown only in PERIOD_H4 and above. Not Useful for Intr
FREE

The indicator highlights in color the places on the chart where the price moves in one direction continuously from the selected number of candles.
You can specify the number of points from the beginning of the movement to select only movements from this amount.
It can be useful for looking for reversals or sharp impulses.
I also recommend purchasing this utility to determine local weekly / monthly trends and support and resistance lines. https://www.mql5.com/en/market/product/61401
FREE
For those who are fans of Bill William's strategy, here it is the Trade Zone indicator filled with alerts and a better coloring system and EA ready (BUY & SELL buffers). And for those who don't know Bill Williams work, search Amazon for the title " Trading Chaos: Maximize Profits with Proven Technical Techniques ". This indicator internally uses the widely known Awesome Oscillator along with the Accelerator indicator, and when both are aligned it lights up the candles signaling a probable strong

If You Are Discretionary Trader This Tool Is A Must Chart Switcher ------> Linking Multi-Time Frame Charts / Syncing Indicators And Drawings. Main USP Of This Indicator: Is Opening Multi-Time Frame Multiple Charts {Up To 10 Charts} Of A Symbol With Just 1 Click. You Do not Have To Save Any Template As It has Been Save Auto When You Click Same Symbol Or Move To Another Symbol. It Is Divided Into 2 Parts: 1} COMMON MODE and 2} SYMBOL MODE 1} COMMON MODE: Under This Mode, You Can Sync Commo

Profit Loss Meter For the serious trader this fun easy to use indicator allows you to measure Profit and Loss of current, closed or future trades on your forex account chart. It measures Currency Pairs And Indices plus estimates margin levels at the trade close point. The Profit/Loss indicator is based on MT5 native Crosshair instrument. TO ACTIVATED USE "HOT KEYS" ctrl+f just as you would for activating the Crosshair. left click and hold then drag in the direction in which you would like to m
https://t.me/Xonxonxonxonxonxon
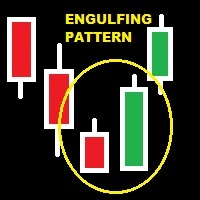
GIVE A LOOK TO MY OTHER PRODUCTS ! 100 % PER MONTH PROFIT----CONTACT ME FOR MORE INFO ! There are patterns that are more affidable then others.One of the most important is the engulfing pattern .It is very helpful to understand if there is a change of trend. This indicator find for you affidable engulfing patterns and send you an alert when a pattern is completely formed . To make this alert indicator more reliable,there is a parameter that you can change relat
FREE
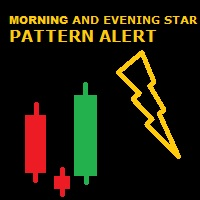
GIVE A LOOK TO MY OTHER PRODUCTS ! 100 % PER MONTH PROFIT----CONTACT ME FOR MORE INFO ! Morning and evening star are 2 famous and reliable candlestick patterns, very helpful to understand an imminent change of trend. This indicator finds for you this patterns on your chart and send you an alert just when a pattern is 100 % formed. To make this indicator more reliable,you can choose the body lenght in pips of the last bar closed ( so the reversing one ),and you can, by this ,making more or less
FREE

Добрый день. Сегодня добавили вспомогательный индикатор тренда DveMashkiTompson, идея взята из аналога МТ4 и перенесена на МТ5, используется совместно с индикаторами Тренда ТМА и МА, рисует красные и зеленые области в зависимости от направления рынка. Тренд вверх -зеленые области, тренд вниз -красные.Области основываются на пересечении индикатора МА, таким образом данный индикатор дает информацию графического содержания для более быстрой оценки ситуации и принятия решения.
FREE
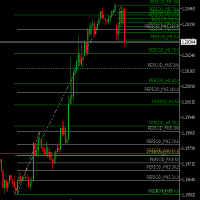
Sets and Updates Fibo-Retracemnet-Levels for Multi Timeframes. Helps to Find TradeZones combined over Multi-Timeframes. M1 M5 M15 H1 H4 D1 are analyzed and shown. Color Changes as soon 161 and 261 Retracements are reached to visualize possible Targets/ TakeProfit Zones . No Settings for Indicator available . Fibonacci retracements are set using a fixed Logic.
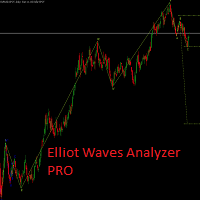
Elliot Waves Analyzer Pro calculates Elliot Waves to Help Identify Trend direction and Entry Levels. Mainly for Swing Trading Strategies. Usually one would open a Position in trend direction for Wave 3 or a Correction for Wave C . This Indicator draws Target Levels for the current and next wave. Most important Rules for Elliot Wave Analysis are verified by the Indicator. The Pro version analyzes Multiple Timeframes and shows the Subwaves and Target-Levels. For an Overview " Elliot Waves Anal

This indicator provides an original mix of WPR, VSA, and volume delta. It shows ratio of buy/sell volumes scaled on 100% range based on total volume change for a selected period. The convetional VSA (Volume Spread Analysis) studies interconnections of price action and volume change in absolute values, whereas WPR (Williams Percent Range) offers a convenient approach of price moves normalization into the fixed percentage metric: 0 - 100%. Hence overbough and oversold states are easily spotted. N
MetaTraderマーケットはMetaTraderプラットフォームのためのアプリを購入するための便利で安全な場所を提供します。エキスパートアドバイザーとインディケータをストラテジーテスターの中でテストするためにターミナルから無料のデモバージョンをダウンロードしてください。
パフォーマンスをモニターするためにいろいろなモードでアプリをテストし、MQL5.community支払いシステムを使ってお望みのプロダクトの支払いをしてください。

取引の機会を逃しています。
- 無料取引アプリ
- 8千を超えるシグナルをコピー
- 金融ニュースで金融マーケットを探索