 MetaTrader 5
 Experts
 Indicatori
 librerie
 Utilità
 Widget
 Regole
Guarda i video tutorial del Market su YouTube
Come acquistare un Robot di Trading o un indicatore
Esegui il tuo EA
hosting virtuale
hosting virtuale
Prova un indicatore/robot di trading prima di acquistarlo
Vuoi guadagnare nel Market?
Come presentare un prodotto per venderlo con successo
Nuovi indicatori tecnici per MetaTrader 5 - 214
 I segnali degli indicatori tecnici giocano un ruolo cruciale nell'apertura e nella chiusura delle transazioni sui mercati azionari e Forex. L'essenza degli indicatori è una trasformazione matematica del prezzo di un simbolo finanziario, finalizzata alla previsione dei cambiamenti futuri dei prezzi. Prova gli indicatori tecnici, per prevedere al meglio il comportamento del mercato e ricavarne dei guadagni.

Индикатор Trading Strategy призван помочь трейдерам в поиске оптимальных входов в сделку и выходов из неё. В его основе лежат показания технических индикаторов (MA, RSI, ATR и др.), а также авторский алгоритм, связывающий их сигналы в единое целое. Индикатор даёт сигналы на покупку и продажу в виде стрелочек: стрелочка вверх — сигнал на покупку, вниз — на продажу. В правом верхнем углу показаны сигналы индикатора на 6 таймфреймах (M1, M5, M15, M30, H1, H4) данной валютной пары. Индикатор свои з

White Crow Indicator
by VArmadA A simple yet powerful candle analysis based indicator using the White Soldiers & Crow patterns.
Works with timeframes 1H and higher and tested on all major pairs. Pay attention to the signal: An arrow indicating a long or short entry.
How It Works:
Arrows indicate a ongoing trend. After multiple bullish or bearish candles in a row the chances for another candle towards that trend is higher.
Instructions: - Crow Count: Set the number of candles that need to su
FREE
Индикатор RSI MT5 - это индикатор Metatrader 5, и суть этого технического индикатора заключается в преобразовании накопленных исторических данных на основе индикатора RSI. Сигналы показаны разными цветами свечей. Смотрите настройки, тестируёте. Это очень полезный индикатор и он точно должен быть у вас . The RSI in candlelight MT5 indicator is a Metatrader 5 indicator, and the essence of this technical indicator is to transform the accumulated historical data based on the RSI indicator. Signals a

Описание индикатора будет крайне коротким. Индикатор Коридор тренда показывает трейдерам зону в которой находится валюта и даёт понимание по какому тренду движется рынок. Визуально очень хорошо воспринимается. Уровни взяты и просчитаны не просто. Полезный индикатор для арсенала индикаторов трейдера. The description of the indicator will be extremely short. The Trend Corridor indicator shows traders the zone in which the currency is located and gives an understanding of which trend the market is
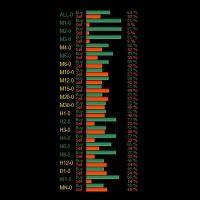
This MT5 indicator, Bull Bear Visual MTF (21 Time Frames), summarize the strength color graphic and percentages of power for both Bull and Bear in current market emotion stage which will show you in multi time frames and sum of the total Bull and Bear power strength which is an important information for traders especially you can see all Bull and Bear power in visualized graphic easily, Hope it will be helpful tool for you for making a good decision in trading.
ADX is one of the most versatile indicators, understanding it can help you understand the true nature of movements. It is often used within automatic experts to filter input signals. Unfortunately in its original form it is not immediately understandable. This version aims to simplify its reading by transferring the burden of interpreting its values to the code. The result is a clear graph where it is easy to identify the accumulation and distribution phases, trend phases and excesses. The color
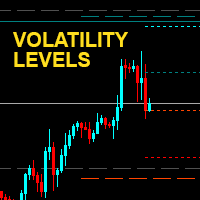
Transfer volatility levels to the chart to understand the nature of the ongoing movements. The levels are calculated based on the volatility recorded in the last few sessions. Easily identify possible targets or swing points for intraday , daily and weekly trading. In addition, the round price levels considered most important are also visible, here the highest trading volumes are usually concentrated. NO REPAINT

MCDX is an indicator based on specific formula to detect Buy and Sell momentum Red Bar means Price go up and Buy momentum. Green Bar means Price go down and Sell momentum" Height of RED bar > 50% means Bull is in control. i.e. RED more than GREEN to go buy. Lower of Green bar < 50% means Bear is in control. i.e. GREEN more than RED to go sell. DARKER RED COLOR - STRONG Up Trend or Strong Bullish Power
LIGHTER RED COLOR - WEAK Up Trend or Weak Bullish Power
LIGHTER GREEN COLOR - STRONG Down Tr
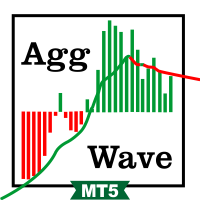
Aggression Wave RSJ somma candela dopo candela la differenza tra aggressione in acquisto e in vendita e la disegna come onde, così vedete quale lato controlla il flusso degli ordini nel corso della giornata. COSA FA Calcola il delta di aggressione di ogni candela (acquisti aggressivi meno vendite aggressive) e lo accumula in onde. Colora ogni onda in base alla direzione, così il cambio di controllo tra compratori e venditori si vede subito. Traccia una linea di segnale sulle onde per mostrare la
FREE
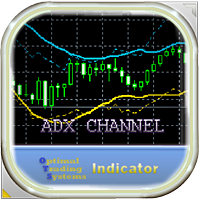
This indicator forms a channel based on the readings of the ADX (Average Directional Movement Index) indicator, displays and informs the trader of a price reversal at the boundaries of this channel, and can also report when the price touches the channel boundaries. It also draws additional dotted lines, which depend on the readings of the + DI and -DI of the ADX indicator. It also has an option for filtering signals depending on the readings of the stochastic. The channel drawn by this indicato
FREE
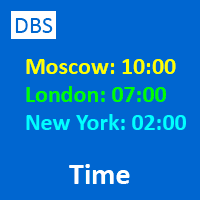
A small utility displays the time in five time zones. You can customize the display of one to five time zones. For each time it is configured: show or not; name; time offset from GMT; color; In general settings, you can change: date / time format ("hh: mi", "hh: mi: ss", "yyyy.mm.dd hh: mi", "yyyy.mm.dd hh: mi: ss") font name; font size; offset from the left edge of the chart; offset from the top edge of the chart;
FREE
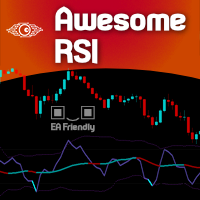
The Relative Strenght Index presented to the world in 1978 by J. Welles Wilder Jr. in his book " New Concepts in Technical Trading Systems " is widely used around the world in several ways, not only with the traditional approach of Overbought and Oversold states, which in several cases and depending on the assets and timeframes it just simply doesn't work anymore . BUT, this indicator has its value when used, for instance, looking for divergences between its measuring system and the Prices appea

The indicator makes calculations based on data obtained from one of seven (7) moving averages and colors the chart.
Simple moving averages are those that have only one important calculation parameter - the period.
The shift in the indicator is not used.
There is a shift trick setting, it is used to smooth the result of calculations. You can see the changes if you reduce this parameter to 1 (minimum value).
shift trick must always be less than the period value.
Available averages:
MA Simpl
FREE
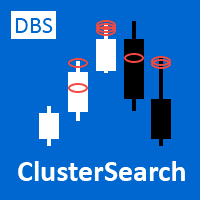
Professional traders know that volume is the fuel for price movement. Large players try to hide their true intentions, but they can be recognized by volume bursts. The standard vertical volume does not show us specific price levels, but the cluster volume and especially its surges provide a very clear picture and specific price levels (areas).
The DBS Cluster Search indicator searches for clusters of the specified size in tick data and highlights them with colored figures on the chart. These l
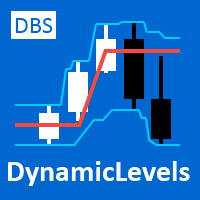
The indicator plots dynamic POC, VAH and VAL levels for a specified period from tick data. POC - Point Of Control, the price at which the maximum volume has accumulated over a certain period of time (POC in the volume profile). VA - Volume Area, the zone of the fair value of the asset. VAH - Volume Area High. VAL - Volume Area Low. The DBS_DynamicLevels indicator plots dynamic levels where the calculation point is the maximum volume level (POC) and zone VAH / VAL. The indicator shows the history
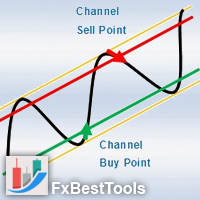
Channels Indicator is an All-In-One Indicator with a powerful calculation engine. The Indicator contains 4 different and usual methods for finding channels on the market. Indicator is powered by a visual interface and with various selections of alerts and notifications.
Testing Indicator : Strategy Tester does not respond to your clicks on panels (This is metatrader tester limitation). Thus input your desired settings on the indicator pre-settings and test.
Using Indicator :
Display 4 Typ
The Better Volume indictator improves the comprehension on volume by coloring the classical histogram bars . The colors point out differents nature of volume .
The Better Volume OnOff allows to open/close the subwindow through a botton or using the keyboard only. There is the possibility to customize 3 symbols and assign them different parameters for each time frame .
The indicator improves the comprehension on volume by coloring the classical histogram bars : CLIMAX UP -
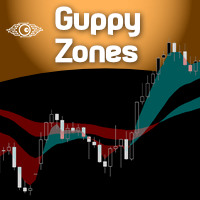
If you have the opportunity to read the book " Trend Trading - A Seven-Step Approach to success " by Daryl Guppy, you will have a great deal of information about how to "read" the market. In his book Daryl show, among other things, how can we use a visual tool to measure the volatility and trend between Long and Short-term periods: The GMMA - Guppy Multiple Moving Averages .
Instead of using his original idea of having 12 Exponential Moving Averages in your chart - which could be very CPU-deman
FREE

We at Minions Labs always like to defy the stablished systems and beliefs trying new things and new ways of seeing and interpreting the Market Data. And all starts with the following question...
WHAT IF...
You give more relevance and focus on the Wicks/Shadows on the candlesticks? And Why? In volatile markets wicks play an important role on determining who is winning the the fight between Bulls and Bears , and more than that, Higher and lower wicks can present you with a good status of the curr
FREE
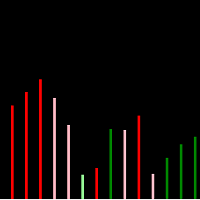
Coiote Book Balance é um indicador que monitora o livro de ofertas e indica de maneira simplificada o níveis de renovação de ordens agrupados no timeframe gáfico, mostrando quanto o maior lado renovou e a diferença dessas renovações. Além disso, é possível visualizar em quais preços estão as maiores ordens da cada lado, o preço teórico dessa liquidez e a quantidade de lotes em tempo real. Para correto funcionamento do indicador é preciso que o livro de ofertas seja aberto antes da inclusão do in
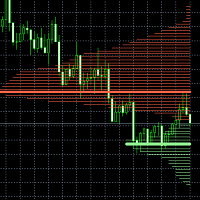
This easy to setup indicator shows you the market volumes in a different way, with support and resistance as showed. You can setup: - Backdays volume to show - Heiken Ashi candle view It works for every kind of graph and every kind of period. The program shows the volumes based on the number of candles displayed in the chart: the more candles the more volumes. Enjoy this very useful indicator.
Please feel free to message me to report any kind of improvements! :D

Fino a 7 livelli di pivot Fibonacci per lato. Per zone di domanda e offerta classificate con conteggio dei retest: Supply Demand RSJ PRO Pivot Point Fibo RSJ disegna il punto pivot giornaliero e i relativi livelli di supporto e resistenza calcolati con i rapporti di Fibonacci. Traccia fino a 7 livelli di supporto e 7 livelli di resistenza a partire da massimo, minimo e chiusura del giorno precedente. I trader usano questi livelli come aree di riferimento per pianificare entrate, uscite e il posi
FREE

Good afternoon. Today we present a new indicator PointIntoChannelTOMSON https://youtu.be/dmgtVwX3nvg
https://youtu.be/Wr7N2WEY8lA -this indicator is calculated from the channel to the level of price deviation in the direction of buying and selling, the green and red window of indicators, respectively. The higher the deviation level, the greater the probability of a reversal. The indicator readings are recalculated with each new bar and it is recommended to use it only as an auxiliary one
Con

Good afternoon. UturnAnalysis - to check the quality of the indicator
WE HAVE LAUNCHED A TRIAL VERSION free distribution of signals about reversals based on this indicator for the futures and stock markets of the MICEX
write to tech support, me 777basil@mail.ru , or in the comments your email address and we will send you the account details where the alerts are sent, for free. https://youtu.be/q228LvLec-Y
we put it on several tools at once https://youtu.be/Wr7N2WEY8lA will save you time at t
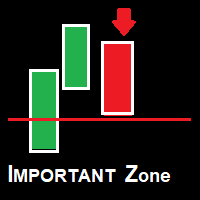
Zona Importante. O indicador Zona Importante é um indicador desenvolvido com todo meu conhecimento no mercado. o que voce podera esperar dele? o Indicador gerara alerta em toda e qualquer Reversao, seja uma reversao de fato ou um simples pullback ou seja a cada mudanca de direcao ocorrera um alerta. - Beneficios: - Nao deixara voce perder oportunidade.
O sell signal significa que uma nova onda de queda ocorrera. O buy signal significa que uma nova onda de alta ocorrer
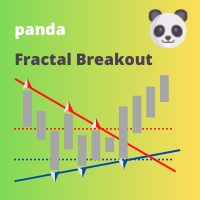
This indicator shows Fractal Breakout Trendlines and Support and Resistance
The Fractal Ascending Trendline and Fractal Descending Trendline are drawn from the last valid fractals. Breakouts can be taken above or below these trendlines. Horizontal lines are drawn from the Last upper and Last lower fractal to show support and resistance levels. Horizontal Upper and Lower Intersection lines are drawn where a fractal trendline has been last intersected, to show where to place a buy or sell order
FREE

Non standard attitude to the standard moving average indicator. The essence of the indicator is to determine the strength and speed of the price direction by determining the tilt angle of the moving average. A point is taken on the fifteenth MA candle and a point on the last closed MA candle, a straight line is drawn between them, it is movable and on a hemisphere shows an angle of inclination from 90 degrees to -90. above 30 degrees is the buying area, below -30 degrees is the selling area. abo
Bar Countdown is a simple indicator for MetaTrader 5 that shows the time remaining of the each candle. It can be placed in any corner of the chart or near of the price close and it'll help you to know
if the current candle is ending. Choose the counter format between HR:MIN:SEC and MIN:SEC It is so easy to use, configure the color, size and counter position on the chart and that's it!!! The Countdown starts now!
Updates: 2021/02/28; v1.0: Initial release 2021/03/16; v1.1: Minor code changes
FREE
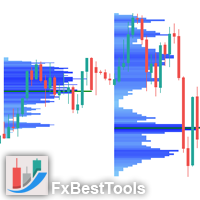
Definition : VPO is a Volume Price Opportunity. Instead of using bars or candles with an Open, High, Low, and Close price, each "bar" in a Market Profile is represented by horizontal bars against the price It is called Market Profile terminology.
In other words volume-price-opportunity (VPO) profiles are histograms of how many volumes were traded at each price within the span of the profile.
By using a VPO chart, you are able to analyze the amount of trading activity, based on volume, for each
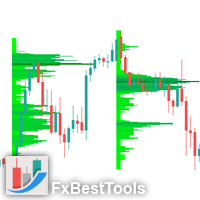
Definition : TPO is a Time Price Opportunity. Instead of using bars or candles with an Open, High, Low, and Close price, each "bar" in a Market Profile is represented by horizontal bars against the price It is called Market Profile terminology.
In other words time-price-opportunity (TPO) profiles are histograms of how much time was spent at each price within the span of the profile.
By using a TPO chart, you are able to analyze the amount of trading activity, based on time, for each price level

The trading system is designed to work with gold on time periods: 30M, 1H. The indicator allows you to adjust to the market situation.
Parameters for 1H : PERIOD=9F , FILTER=300 .
Parameters for 30M : PERIOD=22B , FILTER=450 .
A small adjustment to a specific broker is allowed .
If you change the amount of history displayed, you may also need to adjust the parameters.
The indicator is not redrawn.
"Gold n XAU" uses different rules for entering a trade and different rules
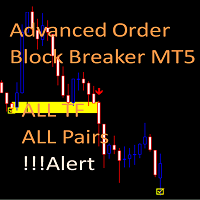
MT5 Version Dashboard: Free scanner to monitor All pairs and timeframes. Please contact me after purchase, i will send it to you! MT4 version indicator: https://www.mql5.com/en/market/product/59127 Tip: This is an indicator for real-time signal display. When the indicator is loaded and running on the chart, the past signal cannot be displayed Market structure changes as price reverses And filter with all import features built inside one tool. Breaker's smart algorithm detects the reverses,
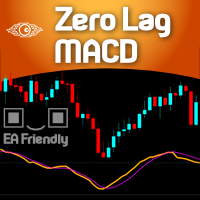
For those who are fans of the traditional MACD ( Moving Average Convergece/Divergence ) indicator, here it is a way faster indicator that could be very useful for intraday trading. Of course it could be used in higher timeframes, with the proper settings. Here at Minions Labs we always encourage traders to calibrate every single indicator you have to extract and distill every drop of good information it has for you. And this is the case with this speedy friend... This Zero Lag MACD could be used
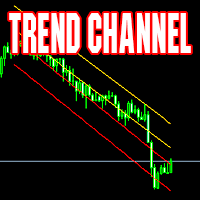
Channel indicator. Calculated dynamically. Suitable for both working in the direction of the trend and inside the channel. Excellent results when working on timeframes from 4H towards the center of the channel.
Example of use: when the price touches one of the extreme lines - opening a deal in the center of the channel with a take profit on the nearest middle line of the indicator. MT4 version The indicator can be used in expert advisors (4 buffers), receiving data in a standard way. Support:
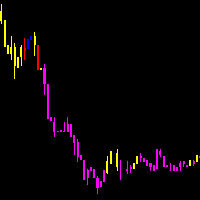
As médias coiote automatizam a leitura de analise de médias rápidas e lentas no saldo do volume e preço. Quando as médias estão em modo compra, a coloração do candle fica azul.
Quando as médias estão em modo venda, a coloração do candle fica magenta. Quando a coloração fica verde ou vermelho, temos a tomada das médias no volume mas não no preço, quando isso ocorre é um sinal de atenção.
A concepção do indicador é ser utilizado para operações em saída de consolidações na direção da tendencia do
FREE
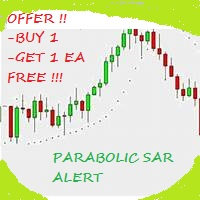
GIVE A LOOK TO MY OTHER PRODUCTS ! 100 % PER MONTH PROFIT----CONTACT ME FOR MORE INFO !
The Parabolic SAR (PSAR) helps trader identifying direction of the stock movement and also provides them with the entry and exit. This indicator on the chart appears as a series of dots either above or below the price bars. When the Dots are below the price bar is then the price movement is considered to be bullish and when the Dots are above the price bar then the price movement is considered to be bearish
The Moving Average Convergence Divergence Indicator (MACD) is both a trend–seeking and momentum indicator which uses several exponential moving averages set to closing prices to generate trading signals. This Version brought to you the Stochastic confluence filtering the signals, this set ups amazing entries on índices and stock futures trading.
We added many types of alerts plus the Delay Cross Filter to aid in your search for better opportunities in the market.
Product Features Sound alert
SHADOW vous donne des signaux d'achat et de vente solides avec un risque minimal. Vous pouvez voir dans quelle direction le prix évolue et la force du mouvement. Shadow filtre le bruit du marché et améliore radicalement les performances des traders.
Points forts: Détection visuelle efficace des tendances. Bruit du marché des filtres Ne repeint ni ne recalcule jamais. Signaux strictement sur "fermeture du bar". Fonctionne dans tous les symboles. Pop-up intégré, e-mail, notification push et
FREE
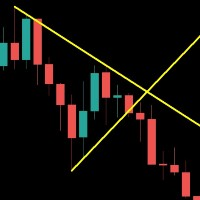
Save your time . Select area and the trend line will draw automatically . Draw a support and resistance line for the selected range with two mouse clicks . If you need to, you can also draw a line for support and resistance based on separate areas.
The resistance trend line is drawn based on the first and last highs inside the selected area; The support trend line is drawn based on first and last lows inside the selected area;

Entry Points Pro vi mostra dove entrare, dove mettere lo stop e con quale lotto operare — prima di piazzare l'ordine. PREZZO Ora 199 USD: 8 copie a questo prezzo, poi 249 USD. Il prezzo finale è di 349 USD.
Guadagno facendo trading sui mercati e lo dimostro, quindi non ho bisogno di vendere questo indicatore a tutti. È uno strumento per trader che ragionano con la propria testa, non un pulsante magico. Nessuna rottura, nessun trade. Una freccia grigia è un segnale annullato: il prezzo non ha ro
Candle Timer Countdown mostra quanto tempo manca alla chiusura della candela corrente. Si aggiorna ogni secondo, anche senza nuovi tick, con l'orologio del server del broker. Vuoi lo stesso conto alla rovescia sul tuo pannello ordini? OCO Panel PRO lo mostra in basso, accanto agli ordini con un clic e alle uscite OCO salvate. COSA MOSTRA Tempo rimanente in mm:ss, h:mm:ss, o in giorni su D1, W1 e MN. "Market closed" quando il simbolo è fuori dalla sua sessione di contrattazione. Variazione % gior
FREE
Setup Tabajara gratuito con VWAP e candele colorate che mostrano il trend, per qualsiasi simbolo. Setup Tabajara è stato creato da un trader brasiliano conosciuto come "The OGRO of Wall Street".
L'idea di questo setup è quella di indicare al trader l'andamento attuale dei prezzi e il tipo di operazione da ricercare nel grafico.
operazione Lo fa attraverso il posizionamento della chiusura delle candele e il VWAP fino alle 10:40 e dopo con la media aritmetica di 20 periodi dipingendo le candele
FREE
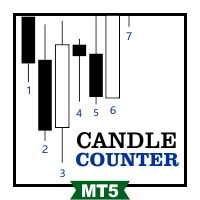
Candle Counter RSJ mostra il numero di ogni candela, contato a partire dalla prima candela della giornata. La prima candela della giornata è la numero 1 e ogni nuova candela aggiunge 1 al conteggio. Parametri di input Mostra numeri pari, dispari o tutti Distanza tra la candela e il numero Dimensione del carattere del testo Colore del carattere del testo Come usarlo Contare le candele è utile quando un setup dipende dal numero di barre dall'apertura del mercato, per esempio una regola che opera s
FREE

Delta Aggression Volume mostra, candela per candela, se hanno scambiato di più i compratori aggressivi o i venditori aggressivi, sugli strumenti con scambi reali come quelli della B3 e i futures CME. COSA FA Calcola il delta di aggressione di ogni candela: volume degli acquisti aggressivi meno volume delle vendite aggressive. Disegna il saldo di ogni candela in una finestra separata, colorato in base al lato che ha prevalso. REQUISITI Strumenti di borsa con scambi reali: futures e azioni della B
FREE
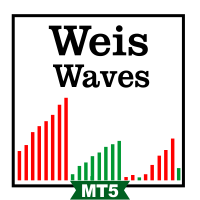
Weis Waves RSJ somma il volume di ogni onda di prezzo e lo rappresenta come un istogramma del volume cumulativo per le onde rialziste e ribassiste alternate. In questo modo puoi confrontare lo sforzo (volume) di ogni onda con il suo risultato (avanzamento del prezzo) e vedere quando un movimento è sostenuto dal volume o sta perdendo forza. Come leggerlo Ogni barra dell'istogramma è il volume totale scambiato durante un'onda di prezzo. Quando un trend è sano, le onde nella direzione del trend di
FREE

VWAP Fibo Bands RSJ disegna il VWAP del periodo selezionato e costruisce delle bande attorno ad esso usando le proporzioni di Fibonacci. L'indicatore traccia 10 livelli di bande attorno al VWAP. Le bande mostrano quanto il prezzo si è allontanato dal prezzo medio ponderato per il volume e possono essere usate come livelli di riferimento per pianificare entrate, uscite e stop. Le bande sono più facili da leggere su timeframe di 30 minuti e inferiori. Parametri di input Calculation Volume Type Cal
FREE

Strumento Gratuito BlueDigitsFx + Accesso all'Ecosistema Questo strumento gratuito fa parte dell'ecosistema di infrastruttura di trading BlueDigitsFx. Ricevi aggiornamenti, risorse operative, nuovi prodotti e accesso ufficiale all'ecosistema tramite il bot BlueDigitsFx. Ecosistema Telegram
Sito Web
Versione MT4
BlueDigitsFx Open Trades MT5 — Monitor dei Pips in Tempo Reale per la Gestione Attiva delle Operazioni BlueDigitsFx Open Trades è un'utilità gratuita per MT5 che mostra direttamente s
FREE
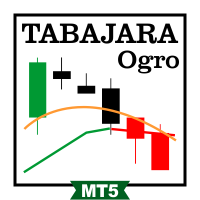
Setup Tabajara gratuito con candele colorate che mostrano il trend, per qualsiasi simbolo. Il setup Tabajara è stato creato da un trader brasiliano conosciuto come "L'OGRO di Wall Street". Mostra il trend attuale e il tipo di operazione da cercare sul grafico. Come funziona L'indicatore confronta il prezzo di chiusura con la media mobile semplice a 20 periodi e colora le candele in 4 colori: Verde: prezzo in salita in un trend rialzista (cercare entrate in acquisto) Nero: prezzo in correzione in
FREE
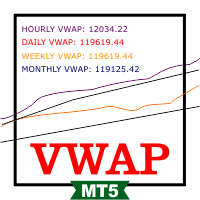
VWAP RSJ traccia le linee del VWAP orario, giornaliero, settimanale e mensile sullo stesso grafico. I grandi acquirenti istituzionali e i fondi usano il VWAP per entrare e uscire dalle posizioni con il minor impatto possibile sul mercato. Di solito cercano di comprare sotto il VWAP e vendere sopra, e questo tende a riportare il prezzo verso la media. Questo indicatore combina i quattro periodi di VWAP così puoi vedere dove si trova il prezzo rispetto a ciascuno di essi. Come leggerlo Ogni linea
FREE
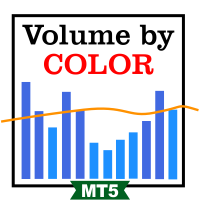
Volume By Color RSJ colora la barra del volume con una tonalità più scura quando il volume scambiato è superiore alla propria media mobile, così le candele con un'attività insolita risaltano. Una modalità opzionale a quattro colori mostra per livelli la forza del volume di ogni candela. Per impostazione predefinita, l'indicatore confronta ogni barra con la media semplice a 20 periodi del volume. Il tipo e il periodo della media possono essere modificati nei parametri di input. Come usarlo Le bar
FREE

The Cauchy distribution is a classic example of a fat-tailed distribution. Thick tails indicate that the probability of a random variable deviating from the central trend is very high. So, for a normal distribution, the deviation of a random variable from its mathematical expectation by 3 or more standard deviations is extremely rare (the 3 sigma rule), and for the Cauchy distribution, deviations from the center can be arbitrarily large. This property can be used to simulate price changes in th
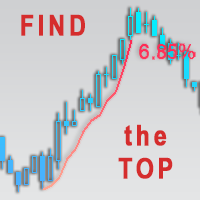
TrendMeasurer indicator manual / TMi manual The indicator is designed to help the user to find the end point of a strong trending price movement. Important - END. Not start. How the indicator works The first price impulse and its subsequent pullback form a certain "critical mass" which acts as "fuel" for further price movement. The production of this fuel indicates the potential end of the trend. Both volume and indicator calculated in a certain way from price data can be the fuel. The amount of
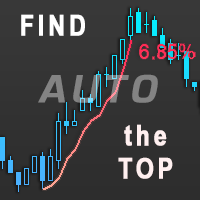
TrendMeasurer indicator / TMi The indicator is designed to help the user to find the end point of a strong trending price movement. Important - END. Not start. How the indicator works The first price impulse and its subsequent pullback form a certain "critical mass" which acts as "fuel" for further price movement. The production of this fuel indicates the potential end of the trend. Both volume and indicator calculated in a certain way from price data can be the fuel. The amount of "fuel" can be
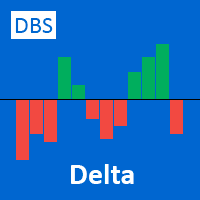
The delta indicator is used to display the difference between the volume that passed on the exchange at the Ask price and above (market buys) and the volume that passed at the Bid price and below (market sales). This indicator shows the delta of each candle on the timeframe of your choice. The data is displayed as a colored histogram in a separate indicator window. The indicator is calculated from the tick history, therefore, to speed up the calculations and reduce the load on the system, the n

The indicator draws a normal chart by coloring it in colors based on prices calculated by the Heiken Ashi indicator algorithm.
That is, the shape of the candles does not change.
In fact, this is the same Heiken Ashi that does not distort the price chart.
Then there will be a drawing of a cat, because there is nothing more to write about the indicator. .
FREE
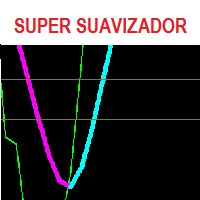
Indicador en MQL5 que obtiene el promedio de 10 EMAS que son alineadas y procesadas según Fibonacci luego el promedio es suavizado" Se ingresa un número de 2 a N que multiplica los EMA-Fibonacci y por consiguiente aumenta los fibonacci, resultando un promedio. Se ingresa un número que suaviza los EMA-Fibonacci. Considerando los números 1/1 seria la suavización minima. Considerando los números 3/5 seria la suavización media. Considerando los números 10/30 seria la suavización alta.....etc

ProFactor is an indicator generating signals based price on the famous profit factor formula. The calculation is simply defined as gross GREEN BARS divided by gross RED BARS.
That's it in a nutshell, but sometimes the simplest things hold the most value.
So let's imagine your trading system's gross profit for the past year was $40,000 and your gross losses were $20,000. Your Profit Factor would be 2. The ProFactor calculation works on the price of the asset instead of the strategy outco
FREE

An effective indicator that highlights candles with increasing volumes, overshadowing those with shrinking volumes. Also suitable for Forex because it uses tick_volume.
You can set the colors to your liking. It will be easier to spot trends and possible reversals. The increasing volumes indicate the presence of large investors and therefore determine the reliability of the candle under observation
Daily Percentage Change (MetaTrader indicator) — calculates the change of currency rate related to the previous daily close and displays it in percentage points in the main chart window of the platform. Additionally, it can display the weekly and monthly percentage changes. Different colors can be set for positive or negative price increases. Also, a small customizable arrow helps to visualize the price change direction. If your broker uses an unconventional time zone, the indicator can use
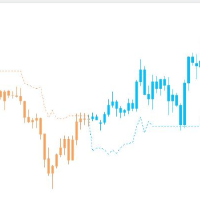
Stable trend index without clutter The index optimizes the moving average and removes the unstable clutter It can also be used in any other commodity It is best used in mainstream currencies such as EURUSD, USDJPY, GBPUSD and AUDUSD
The time period is 1 hour
I only know a little English, please forgive me if you don't understand I will always improve this indicator
Description
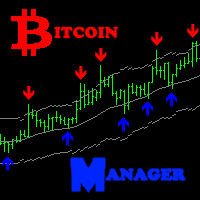
Bitcoin Manager is the best indicator for trading Bitcoin cryptocurrency. It is calculated based on the price deviation from the moving average line channel. Ascending and descending arrows indicate potential points and levels for opening buy and sell positions.
How to use?
We strongly recommend using this indicator on the H1 timeframe. An up arrow indicates a buy level. Down Arrow - Sell Level.
Parameters
Maximum History Bars - maximum count of history bars to calculate. _GRAP
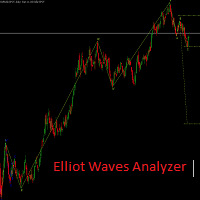
Elliot Waves Analyzer calculates Elliot Waves to Help Identify Trend direction and Entry Levels. Mainly for Swing Trading Strategies. Usually one would open a Position in trend direction for Wave 3 or a Correction for Wave C . This Indicator draws Target Levels for the current and next wave. Most important Rules for Elliot Wave Analysis are verified by the Indicator. This free version is limited for Analyzing one Timperiod Waves. Waves are Shown only in PERIOD_H4 and above. Not Useful for Intr
FREE

The indicator highlights in color the places on the chart where the price moves in one direction continuously from the selected number of candles.
You can specify the number of points from the beginning of the movement to select only movements from this amount.
It can be useful for looking for reversals or sharp impulses.
I also recommend purchasing this utility to determine local weekly / monthly trends and support and resistance lines. https://www.mql5.com/en/market/product/61401
FREE
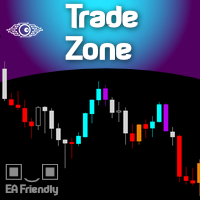
For those who are fans of Bill William's strategy, here it is the Trade Zone indicator filled with alerts and a better coloring system and EA ready (BUY & SELL buffers). And for those who don't know Bill Williams work, search Amazon for the title " Trading Chaos: Maximize Profits with Proven Technical Techniques ". This indicator internally uses the widely known Awesome Oscillator along with the Accelerator indicator, and when both are aligned it lights up the candles signaling a probable strong

If You Are Discretionary Trader This Tool Is A Must Chart Switcher ------> Linking Multi-Time Frame Charts / Syncing Indicators And Drawings. Main USP Of This Indicator: Is Opening Multi-Time Frame Multiple Charts {Up To 10 Charts} Of A Symbol With Just 1 Click. You Do not Have To Save Any Template As It has Been Save Auto When You Click Same Symbol Or Move To Another Symbol. It Is Divided Into 2 Parts: 1} COMMON MODE and 2} SYMBOL MODE 1} COMMON MODE: Under This Mode, You Can Sync Commo

Profit Loss Meter For the serious trader this fun easy to use indicator allows you to measure Profit and Loss of current, closed or future trades on your forex account chart. It measures Currency Pairs And Indices plus estimates margin levels at the trade close point. The Profit/Loss indicator is based on MT5 native Crosshair instrument. TO ACTIVATED USE "HOT KEYS" ctrl+f just as you would for activating the Crosshair. left click and hold then drag in the direction in which you would like to m
https://t.me/Xonxonxonxonxonxon
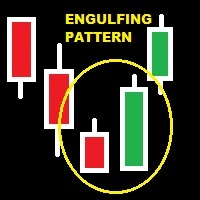
GIVE A LOOK TO MY OTHER PRODUCTS ! 100 % PER MONTH PROFIT----CONTACT ME FOR MORE INFO ! There are patterns that are more affidable then others.One of the most important is the engulfing pattern .It is very helpful to understand if there is a change of trend. This indicator find for you affidable engulfing patterns and send you an alert when a pattern is completely formed . To make this alert indicator more reliable,there is a parameter that you can change relat
FREE
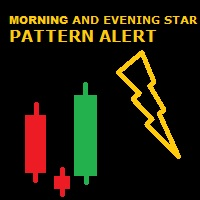
GIVE A LOOK TO MY OTHER PRODUCTS ! 100 % PER MONTH PROFIT----CONTACT ME FOR MORE INFO ! Morning and evening star are 2 famous and reliable candlestick patterns, very helpful to understand an imminent change of trend. This indicator finds for you this patterns on your chart and send you an alert just when a pattern is 100 % formed. To make this indicator more reliable,you can choose the body lenght in pips of the last bar closed ( so the reversing one ),and you can, by this ,making more or less
FREE

Добрый день. Сегодня добавили вспомогательный индикатор тренда DveMashkiTompson, идея взята из аналога МТ4 и перенесена на МТ5, используется совместно с индикаторами Тренда ТМА и МА, рисует красные и зеленые области в зависимости от направления рынка. Тренд вверх -зеленые области, тренд вниз -красные.Области основываются на пересечении индикатора МА, таким образом данный индикатор дает информацию графического содержания для более быстрой оценки ситуации и принятия решения.
FREE
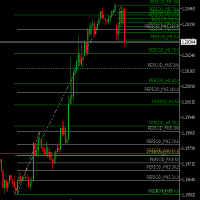
Sets and Updates Fibo-Retracemnet-Levels for Multi Timeframes. Helps to Find TradeZones combined over Multi-Timeframes. M1 M5 M15 H1 H4 D1 are analyzed and shown. Color Changes as soon 161 and 261 Retracements are reached to visualize possible Targets/ TakeProfit Zones . No Settings for Indicator available . Fibonacci retracements are set using a fixed Logic.
Sai perché MetaTrader Market è il posto migliore per vendere strategie di trading e indicatori tecnici? Non c'è bisogno di pubblicità o di protezione del software, nessun problema di pagamento. Tutto ciò è fornito da MetaTrader Market.

Ti stai perdendo delle opportunità di trading:
- App di trading gratuite
- Oltre 8.000 segnali per il copy trading
- Notizie economiche per esplorare i mercati finanziari
Registrazione
Accedi
Accetti la politica del sito e le condizioni d’uso
Se non hai un account, registrati