 MetaTrader 5
 エキスパート
 インディケータ
 ライブラリ
ライブラリ
 ユーティリティ
 ウィジェット
 ルール
ルール
YouTubeにあるマーケットチュートリアルビデオをご覧ください
ロボットや指標を購入する
仮想ホスティングで
EAを実行
EAを実行
ロボットや指標を購入前にテストする
マーケットで収入を得る
販売のためにプロダクトをプレゼンテーションする方法
MetaTrader 5のための新しいテクニカル指標 - 154
 テクニカル指標からのシグナルは、株式および外国為替市場での取引の開始と終了に重要な役割を果たします。指標の本質は、将来の価格変動を予測することを目的とした金融銘柄価格の数学的変換です。
テクニカル指標をテストして、市場の動きとそれからの利益をより正確に予測します。
テクニカル指標からのシグナルは、株式および外国為替市場での取引の開始と終了に重要な役割を果たします。指標の本質は、将来の価格変動を予測することを目的とした金融銘柄価格の数学的変換です。
テクニカル指標をテストして、市場の動きとそれからの利益をより正確に予測します。 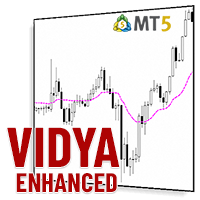
VIDYA-ENHANCEDインディケータ(Variable Index Dynamic Average)は、トレンドや横ばいの動きを識別するために使用されるテクニカル分析ツールです。
VIDYA-ENHANCED は、チャンデ・モメンタム・オシレーターをボラティリティ指標と して使用し、市場のボラティリティに基づいて動的に感度を調整します。この機能により、VIDYA-ENHANCEDは値動きの激しい局面ではより機敏に、ボラティリティの低い局面ではより安定した動きを維持することができます。
特徴
- メタトレーダー標準より5つ多い12のオプションから価格を選択! - VIDYAとEMAの期間を選択。 - VIDYAラインの色、タイプ、幅を変更。

News Indicator. Shows the interest rate of 12 countries (Australia, Brazil, Canada, Mexico, euro zone, UK, India, New Zealand, Switzerland, United States, South Korea, Japan). It will help to analyze the impact of the interest rate on the exchange rate. It makes sense to set an indicator on large timeframes. To improve the information content, it makes sense to change the settings style of the indicator of the desired country, so that the line stands out from the total mass of indicators, as ind
FREE
The DYJ SignalSourceOfWPR is based on WPR indicator. It can be used for any currency pair and timeframe. The WPR recommends Indicator values ranging between 80 and 100% indicate that the market is oversold. Indicator values ranging between 0 and 20% indicate that the market is overbought. The entry signal of this indicator is a turning point in the trend.
The indicator uses analog trading technology,
Provide you with indicators to evaluate the overall profit of the opening signal and closi
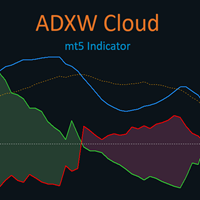
This is Wilder's ADX with cloud presentation of DI+ & DI- lines. Features
4 standard lines of the ADX indicator: DI+, DI-, ADX, ADXR cloud presentation of DI+/DI- lines with transparent colors applicable to all time-frames and all markets
What Is ADX
J. Welles Wilder Jr., the developer of well-known indicators such as RSI, ATR, and Parabolic SAR, believed that the Directional Movement System, which is partially implemented in ADX indicator, was his most satisfying achievement. In his 1978 book,
FREE
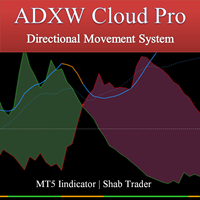
Full implementation of Directional Movement System for trading, originally developed by Welles Wilder, with modifications to improve profitability, to reduce the number of unfavorable signals, and with Stop Loss lines.
No re-paint
Features
Buy/sell signals displayed on the chart Stop levels visually indicated on the chart Profit-taking points presented in the indicator window Exit points for unfavorable positions presented in the indicator window Signal confirmation through high/low swing cros

FX Correlation Matrix is a powerful multi-timeframe dashboard that helps traders analyze real-time currency correlations of up to 28 symbols at a glance. With customizable settings, sleek design, and manual symbol selection option, it enhances trade accuracy, reduces risk, and identifies profitable correlation-based opportunities. Setup & Guide: Download MT4 Version here. Follow our MQL5 channel for daily market insights, chart, indicator updates and offers! Join here.
Read the product des
The MACD 2 Line Indicator is a powerful, upgraded version of the classic Moving Average Convergence Divergence (MACD) indicator.
This tool is the embodiment of versatility and functionality, capable of delivering comprehensive market insights to both beginner and advanced traders. The MACD 2 Line Indicator for MQL4 offers a dynamic perspective of market momentum and direction, through clear, visually compelling charts and real-time analysis.
Metatrader4 Version | How-to Install Product | How-t
FREE
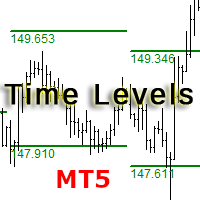
The indicator is designed for displaying the following price levels on the chart: Previous day's high and low. Previous week's high and low. Previous month's high and low. Each of the level types is customizable. In the indicator settings, you set line style, line color, enable or disable separate levels.
Configurations ----Day------------------------------------------------- DayLevels - enable/disable previous day's levels. WidthDayLines - line width of daily levels. ColorDayLines - line
FREE
Description of work The MA7 Galega indicator is based on the standard Moving Average indicator. Shows a puncture of the moving average. Detailed information about the MA7 Galega indicator.
Indicator settings General settings: Period ; Method ; Apply to ; Consider the direction of the candle .
Message settings: Send message to the terminal (Alert) – permission to send messages to the terminal using the Alert function; Send message to the mobile terminal (Push) – permission to send messages to t
Kindly rate and comment about the product for upgradation & Support
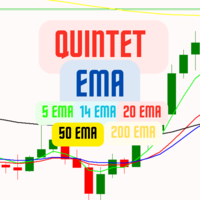
The 5 EMA is plotted in green color ( Lime ). The 14 EMA is plotted in red color ( Red ). The 20 EMA is plotted in blue color ( Blue ). The 200 EMA is plotted in black color ( Black ). The 200 EMA is plotted in yellow color ( Yellow ).
The Quarter EMA that provided calculates and plots four Exponential Moving Averages (EMAs) on the chart using different periods: 5, 14, 20, and 200. Each EMA is
Subscribe to the 'MA7 Trading' channel to receive notifications about new programs, updates and other information. Ask questions in the profile on the MQL5 .
Description of work
The 'MA7 Ixora' indicator is based on the standard Moving Average (MA) indicator. Shows the intersection of the fast and slow moving averages. Detailed information about the 'MA7 Ixora' indicator.
Indicator settings
General settings: Consider the direction of the candle .
Fast moving average settings: Period – MA per

The forex spread is the difference between a forex broker's sell rate and buy rate when exchanging or trading currencies . Spreads can be narrower or wider, depending on the currency involved, the time of day a trade is initiated, and economic conditions.
Forex Spread WatchDog :
This Forex indicator ensures that you are getting the best spreads while trading, and guards against broker spread widening.
FREE

Make no mistake, this is not just another indicator; it's much more than that! Welcome to a groundbreaking approach! Sunrise Divergence is not just another tool; it represents a deep understanding in how market dynamics are analyzed and traded. This indicator is crafted for traders who seek to navigate the markets with precision, leveraging the powerful concept of asset correlation, both positive and negative, to unveil trading opportunities that many overlook. In the markets, understanding the
AlphaWaveインジケーターでトレーディングの潜在力を解放しましょう! トレーディングに静けさをもたらす: AlphaWaveインジケーターは、チャートを滑らかにし、トレンドの方向を正確に読み取ることで、トレーディングに静けさをもたらすように設計されました。明確なトレードの決定を行うことはこれまでになく簡単です。 10つのモードを備えた革命的なスムージングテクノロジー: AlphaWaveインジケーターを使用して、スムーズでクリアなチャートの表示を体験してください。この革命的なスムージングテクノロジーは1つではなく、なんと10つのモードを提供し、トレーディングの体験を新たな次元に引き上げます!あなたのトレーディングスタイルに最適なモードを選択してください。 あらゆるアセットに対応可能: AlphaWaveインジケーターはどんなアセットにも最適に適応し、多岐にわたる市場でサポートします。どんな取引インストゥルメントでもその潜在力を引き出しましょう。 上昇および下降トレンド用のカスタムアラート: 特別なボーナスをお楽しみください!AlphaWaveインジケーターは上昇および下降トレン
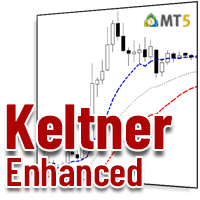
ケルトナー・エンハンスドは、ケルトナー・チャネルの精度と見やす さを向上させるもので、METAデフォルトを超える多くの調整オプショ ンと5つの価格計算を備えています。
ケルトナーEインディケータは、ボリンジャーバンドや移動平均エンベロープ に類似したバンド型インディケータです。ケルトナーEは、ボリンジャーバンドや移動平均線に似た帯状のインジケータで す。
ケルトナー・チャネルを使用する際に注意すべき主な現象は、上限エンベロープの上方または下限エンベロープの下方へのブレイクアウトです。上側のエンベロープを上抜けた場合は、買われ過ぎを意味します。下限エンベロープを下抜けた場合は、売られ過ぎを意味する。
ただし、ケルトナー・チャネルを使用する際には、買われすぎや売られすぎの状態はしばしば強さの兆候であることに留意してください。
トレンドが明確に定義されている場合、買われ過ぎや売られ過ぎは強さを示すことがあります。この場合、現在のトレンドは強まり、最終的に継続する。横ばい相場では、少し違った動きをする。相場が横ばいトレンドにある場合、買われすぎや売られすぎの読みは、多くの場合、価格が
FREE

The Plasma Trend indicator is a simple technical indication that is used to determine the current trend direction in the market. The Plasma Trend indicator is a powerful tool for determining the direction of the trend in the Forex market. It is based on both standard technical indicators and proprietary mathematical calculations, which provides a more accurate and reliable trend determination. Its implementation in the form of lines of two colors simplifies the visual determination of a change
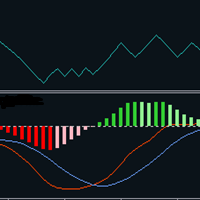
OBV MACD
Calculating MACD based on OBV data Features
3 outputs: MACD & Signal & Histogram 4 Colored Histogram Smoothing factor show/hide option for MACD & Signal lines Description
Among the few indicators developed for working with volume data, OBV (On Balance Volume) is the simplest yet most informative one. Its logic is straightforward: when the closing price is above the previous close, today's volume is added to the previous OBV; conversely, when the closing price is below the previous close
FREE

The Antique Trend Indicator is a revolutionary trend trading and filtering solution with all the important features of a trend tool built into one tool! The Antique Trend indicator is good for any trader, suitable for any trader both for Forex and binary options. There is no need to configure anything, everything has been perfected by time and experience, it works great during flats and trends.
The Antique Trend indicator is a tool for technical analysis of financial markets, reflecting curren
Description of work The MA7 Flax indicator is based on the standard Average True Range indicator and candle data. Shows candles that are larger in size relative to the ATR indicator value. Detailed information about the MA7 Flax indicator.
Indicator settings General settings: Period ; Multiplier ; Remove subsequent arrows – removes subsequent arrows in one direction.
Message settings: Send message to the terminal (Alert) – permission to send messages to the terminal using the Alert function; S
Description of work The MA7 Viola indicator is based on the standard Moving Average indicator. Shows a sharp increase or decrease in the moving average. Detailed information about the MA7 Viola indicator.
Indicator settings General settings: Period ; Method ; Apply to ; Difference – difference between the last two MA values; Remove subsequent arrows – removes subsequent arrows in one direction.
Message settings: Send message to the terminal (Alert) – permission to send messages to the terminal

The implementation of the Trend Turn trend indicator is simple - in the form of lines of two colors. The indicator algorithm is based on standard indicators as well as its own mathematical calculations.
The indicator will help users determine the direction of the trend. It will also become an indispensable advisor for entering the market or closing a position. This indicator is recommended for everyone, both beginners and professionals.
How to interpret information from the indicator. We sell

The Lyxes indicator is designed to detect price trends and allows you to quickly determine not only the direction of the trend, but also understand the levels of interaction between buyers and sellers. The indicator works on all timeframes and currency pairs. The indicator gives fairly accurate signals and is commonly used in both trend and flat markets. It is advisable to use the indicator in conjunction with other tools for more reliable signals and more informed decisions. The indicator does

The Reversal Trend indicator was created on the basis of the original indicators for searching for extremes, the indicator is well suited for determining a reversal or a large sharp jerk in one direction, thanks to it you will know when this happens, it will notify you by the appearance of a blue dot to buy red to sell.
It is based on the process of identifying the rate of change in price growth and allows you to find entry and exit points from the market.
a fundamental technical indicator th
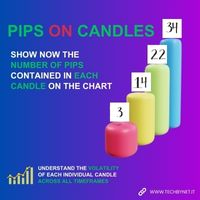
Pips on Candles shows the number of pips involved in each candle on the chart. It is possible to set 3 different ranges for counting on each single candle via the RangeType parameter: With "HighLow" you count the pips present between the minimum and the maximum. The number is shown under each candlestick on the chart. With "OpenClose" you count the pips present between the opening and closing price of the candle. The number is shown under each candlestick on the chart. With "HighDistAndLowDist"

This is diamond! Contact me to send you instruction and add you in group. + FREE Trading Utility MT5
Diamond Pattern is based on Read The Market(RTM) concepts. The purpose of this model is to face the big players of the market (financial institutions and banks), As you know in financial markets, big traders try to fool small traders, but RTM prevent traders from getting trapped. This style is formed in terms of price candles and presented according to market supply and demand areas and no
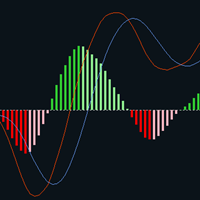
Classic MACD
It has MACD line, Signal line, and Histogram . The Histogram has 4 colors , showing its movement direction as simple as possible. The smoothing factor in the input helps to eliminate noisy signals. Besides different price types (hlc, hlcc, ohlc, ...), there is an option to use volume data as the source for MACD calculations (which is better to be used by real volume not unreliable tick volume). While the original MACD indicator uses Exponential Moving Average, this indicator provide
FREE
Currency Strength Dynamic 通貨強さのダイナミックは通貨の強さを示す指標です。 通貨の強さは、通貨が含まれるほとんどまたはすべての通貨ペアのトレンドの方向を指します。
この指標は、MACD 指標と同様に、28 の最も人気のある通貨ペア (メジャー通貨ペアとマイナー通貨ペア) の移動平均間の差の測定値に基づいています。 利点 独自の振動計算法 特定の通貨の明細を無効または有効にするボタンの利用可能性 情報テーブル 2 種類のアラート: インジケーターのラインが交差したときと、ラインが指定されたレベルを交差したとき。 描画されるバーの数はオプションです。 各ポイントを詳しく見てみましょう。
独自の振動計算方法により、インジケーターが長時間最大値に留まらず、発散と収束のよく知られた効果と同様に、事前に最大値から抜け出すことができます。 この方法には、指定された計算期間と読み取り値をより滑らかにする平滑化レベルも含まれます。 計算には無駄な計算式や冗長な計算式が含まれないため、端末への負荷が軽減されます。
特定の通貨の行を無効または有効にするボタンがあることは、

Accurate Gold インジケーターは、経験レベルに関係なく直感的で使いやすいユーザーフレンドリーなツールです。このインジケーターは、ゴールド市場のM5タイムフレームで正確なシグナルを探しているトレーダーを対象に設計されています。このインジケーターは、価格の動きと出来高ダイナミクスを分析するために高度な数学的アルゴリズムを使用し、正確な買いと売りのシグナルを生成します。このインジケーターの特長的な要素、リペイントしない性質を含め、トレーダーには市場の逆転の可能性に対する貴重な洞察を提供し、情報を元にした意思決定を可能にします。チャート上での視覚的な表示、聞こえるアラート、およびプッシュ通知により、ユーザーエクスペリエンスが向上し、正確性と信頼性を求めるゴールドトレーダーのツールキットに貴重な追加となります。 $ XX – 期間限定で、最初の 5 人の支援者には価格が $ XX になります。 ( % 売り切れ)
$88 – その後、発売価格の $88 に戻り、ゴールド シンボルのみに制限されます。
$88 + X ($100) – 5 回購入

Algo Map Lite のご紹介 – 取引体験に革命をもたらすように設計された最先端のソフトウェアです。この高度なツールは取引セッションとシームレスに統合され、あらゆる場面で包括的なブレイクアウトレベル分析を提供します。
Algo Map Lite は、直感的なインターフェイスとリアルタイムのレベル印刷機能に加えて、そのパフォーマンスの主張を強化するために細心の注意を払った勝率メトリクスを組み込むことで傑出しています。透明性と信頼性に対する当社の取り組みは、過去 1,000 件の取引の広範なデータセットから導き出された驚異的な勝率によって実証されています。
- 1/1 のリスク対報酬比で 85% 以上の優れた勝率を達成します。
- リスク対報酬比 1/2 で 65% 以上の驚異的な勝率を示します。
- 1/3 のリスク対報酬比で 50% の堅実な勝率を実現します。
- リスク対報酬比 1/4 で 40% の堅実な勝率を維持します。
初心者トレーダーにとって、これらの統計は、取引の決定における比類のないレベルの正確さと信頼性を表します。 Algo Map L
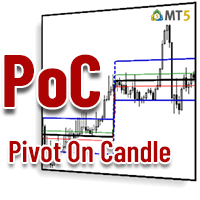
毎日特定のローソク足で動くPIVOTを何度探したことでしょう。
多くのトレーダーは、マーケットが開いてから30分後、正午12時など、毎日特定の時刻を基準にして、その日のトレンドの方向性を推し量ることを好みます。
このインディケータでは、特定の時間(時、分)を指定し、その時間から翌日までのピボットを同時にプロットすることができます。その特定のローソク足/時間に基づき、中央値、最大値、最小値、サポ ート、レジスタンスの5本のラインが表示されます。
選択した時間がPERIODの制限外(M5タイムフレームの10:12など)である場合、この値は最も近いローソク足の時間に切り上げられます。さらに、ユーザーはすべての線のスタイル、色、幅を設定することができます。
これで良いトレードができることを願っています。 また、時間範囲に基づくPIVOTが必要な場合は、 他の製品をご覧ください 。
FREE
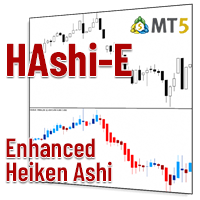
HAshi-EはHeiken-Ashiシグナルを分析するための強化された方法です。
説明
HAshi-Eは、Heiken-Ashiシグナルを分析するための強化された方法です。HAshi-Eは、Heiken-Ashiシグナルを分析するための強化された方法です。HAshi-Eは、Heiken-Ashiシグナルを分析するための強化された方法です。伝統的なローソク足チャートとは異なり、ヒーケンアシのローソク足は過去のバーの平均値を使って計算されるため、よりスムーズで解釈しやすい視覚的表現が可能です。
その主な利点は、ほとんどの人が本来の読み方をしない理由でもあります。HAshiローソク足には平均値に関する情報が含まれており、通常、資産ローソク足の前に配置されているため、色や形に惑わされ、不適切な時間帯や遅い時間帯にエントリーやエグジットを行う人をよく見かけます。
このような背景から、HAshi-Eは従来のHeiken-Ashiインジケータの改良版です!
HAshi-E(別ウィンドウ版)の特徴: 同じデータを様々な角度から見る: HAshi-Eは伝統的なローソク足だけでなく、ライン、
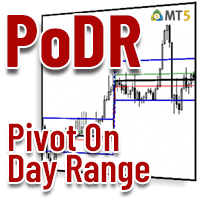
毎日特定の時間枠で機能するPIVOTを何度探しましたか?
多くのトレーダーは、NYSEが開く2時間前から1時間後まで、あるいはNYSEが開 いてから30分後までといったように、毎日特定の時間間隔に基づいて、その 日のトレンドの方向性を予測することを好みます。
このインディケータは、特定の時間間隔(時 間と分)を指定し、その時間間隔から同じ時間間隔で翌日までのピボッ トをプロットします。こ れ に 基 づ い て 、中 央 値 、高 値 、安 値 、サ ポ ー ト 、レ ジ ス タ ン ス の 5本の線が表示されます。
選択した時間がPERIODの制限外(M5タイムフレームの10:12など)である場合、この値は最も近いローソク足の時間に切り上げられます。さらに、スタイル、色、幅の面ですべてのラインを設定することができます。
これで良いトレードができることを願っています。
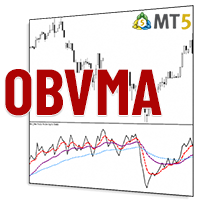
オンバランス・ボリューム(OBV)は、出来高と価格を関連付け、値動きを識別するテクニカル指標です。OBVの基本的な考え方は、出来高の変化は一般に価格の変化に先行するというものである。OBVは、価格が高値で引けた期間の出来高を累積し、安値で引けた期間の 出来高を減算する。こ の 結 果 、資 産 の ト レ ン ド の 方 向 を 示 す 数 値 が 得 ら れ る 。
OBVの解釈は簡単です。OBVの上昇は、買い手が市場に参入または留まろうとしていることを示唆し、上昇トレンドのシグナルとなります。一方、OBVが低下している場合は、売り手が優勢であることを示し、下降トレンドの可能性を示唆します。
現在、シグナルに最大3つの移動平均を使用することができ、取引判断プロセスを簡素化することができます。OBVがMAラインと交差していることと、その間の距離を観察するだけです。これがOBV-MAの目的です!
OBV線がMA線と交差し、MA線とOBV線が大きく離れている場合、上昇トレンドまたは下降トレンドの強い兆候を示します。もう一つの良いトレンドシグナルは、すべての線(OBV線とMA線)が同

テクニカル分析の領域では、ParbMAはParabolic SARのトレンドを調査するための非常に直感的なツールとして浮かび上がります。この革新的なアプローチは、カスタマイズ可能なラインを活用し、その色、形状、幅のオプションにおいてその汎用性が際立っています。この柔軟性により、視覚的な分析が向上し、戦略の立案や意思決定に大きく役立ちます。
ParbMA(Parabolic Moving Average)は、J. Welles WilderのParabolic SAR(Stop and Reverse)と移動平均の概念を組み合わせたカスタムの技術指標です。このハイブリッド指標は、これらの手法の利点を捉え、金融市場における価格トレンドと潜在的な反転ポイントを追跡する独自の方法をトレーダーに提供することを目的としています。
ParbMAの主な特徴
カスタマイズ可能な視覚的表現: ParbMAの中心には、ラインを通じてトレンドを表現する能力があります。ユーザーはこのラインを好みに合わせて、様々な色、形状、幅から選択することができます。このカスタマイズのレベルにより、トレンドの表現がユー

The ICT Unicorn Model indicator highlights the presence of "unicorn" patterns on the user's chart which is derived from the lectures of "The Inner Circle Trader" (ICT) .
Detected patterns are followed by targets with a distance controlled by the user.
USAGE (image 2) At its core, the ICT Unicorn Model relies on two popular concepts, Fair Value Gaps and Breaker Blocks. This combination highlights a future area of support/resistance.
A Bullish Unicorn Pattern consists out of:

O Touch VWAP é um indicador que permite calcular uma Média Ponderada por Volume (VWAP) apenas apertando a tecla 'w' no seu teclado e após clicando no candle do qual deseja realizar o calculo, clicando abaixo do candle é calculada a VWAP baseado na minima dos preços com o volume, clicando sobre o corpo do candle é calculado uma VWAP sobre o preço medio com o volume e clicando acima do candle é calculado uma VWAP baseado na máxima dos preços com o volume, voce tambem tem a opção de remover a VWAP

BreakHarmony Multi-Timeframe Breakout Indicator for MT5
The BreakHarmony Multi-Timeframe Breakout Indicator for MT5 is a highly advanced tool providing information on breakout points across different timeframes, aiding traders in decision-making and understanding market movements. [ Features and Manual | MT4 version | All Products ] The indicator tracks breakout points on price charts across 6 timeframes. Breakout prices are indicated with the closing price of the correspondi
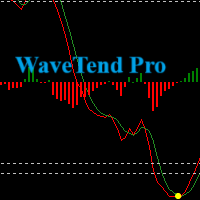
You need to revise your product description to comply with advertising policies that prohibit guaranteeing or hinting at profits. The current description uses phrases that could be interpreted as promises of financial gain, which violates these rules. Wave Trend Oscillator Indicator for MetaTrader 5 Discover the Wave Trend Oscillator Indicator , a sophisticated technical analysis tool for MetaTrader 5. This indicator is designed to help traders better understand market dynamics by visualizing w
Description of work
The MA7 Agave indicator is based on the standard Average Directional Movement Index indicator. Shows the intersection of the +DI and -DI lines. Detailed information about the MA7 Agave indicator.
Indicator settings General settings: Period .
MA7 Flax settings: Period ; Multiplier ; Remove subsequent arrows – removes subsequent arrows in one direction.
Message settings: Send message to the terminal (Alert) – permission to send messages to the terminal using the Alert functi
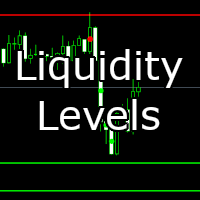
This indicator helps you identify support and resistance levels. Also it adds break points when level is broken. Price sometimes goes back to break point. It has 4 technical parameters and 4 buffers for expert advisors. Buffer indexes: 0 - Resistance, 1 - Support, 2 - Resistance break point, 3 - Support break point". Number of Levels: Determines how many levels are on graph ( if 3 - 3 levels of support and 3 levels of resistance) Tolerance in percentage %: This parameter is used to filter out
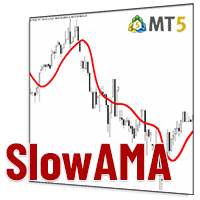
Compared to simple or exponential moving averages, slow adaptive trend lines might offer a more nuanced view of the trend by adjusting their sensitivity based on market conditions. However, their slow nature might also mean they are late in signaling reversals when market conditions change rapidly - and that is the difference between them and our SlowAMA .
SlowAMA was designed to be a better long-term trend indicator than EMA and other Moving Averages. It uses our JurMA calculations, reducing
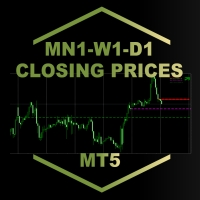
MN1-W1-D1 Close Price Indicator to Index Trading for MT5
The indicator draws lines to the close prices of the last closed bars of monthly, weekly and daily timeframes. Observably, these prices are significant support and resistance prices at major indices, like Nasdaq, DAX. The info panel always shows the prices relative to each other in the correct order. If the current price is the highest - i.e. higher than the last monthly, weekly and daily closing price - it is in the first row. The lowest

Engulfing Goddess Indicator for MetaTrader 5 Discover the Engulfing Goddess Indicator , a technical analysis tool for MetaTrader 5 (MT5) that helps traders identify engulfing candlestick patterns. This indicator is designed to provide visual signals that correspond to common patterns used in market analysis. The Engulfing Goddess Indicator is built to detect various types of engulfing patterns. It includes a range of optional filters to refine pattern detection, giving you the flexibility to cu
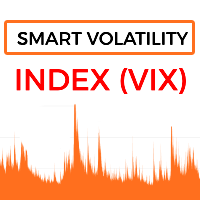
This is one of the most popular and highly rated volatility index (VIX) indicators on the market. It provides the same readings as the VIX does for stock indexes. However, this indicator works across all asset classes. VIX Fix Finds Market Bottoms. This indicator is not for inexperienced traders. Use it for day and swing trading. MT4 Version - https://www.mql5.com/en/market/product/112238 Join To Learn Market Depth - https://www.mql5.com/en/channels/suvashishfx
Bernard Baruch summe
FREE

One of the best trend indicators available to the public. Trend is your friend. Works on any pair, index, commodities, and cryptocurrency Correct trend lines Multiple confirmation lines Bollinger Bands trend confirmation Trend reversal prediction Trailing stop loss lines Scalping mini trends Signals Alerts and Notifications Highly flexible Easy settings Let me know in the reviews section what you think about it and if there are any features missing.
Tips: Your confirmation line will predict tre
FREE

Our goal is to empower every trader with their own unique trading system.
Indicator - Red-Green Series
Ultimate simplicity: Red for uptrend, green for downtrend! It can be used independently or in combination with other indicators. This is a red-green indicator based on the crossover of two moving averages. We have more indicators in store and will be adding them gradually. Friends who make a purchase are kindly requested to contact us after their purchase.
In the world of financial trading,
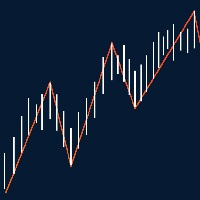
This indicator show Gann Swing Chart (One Bar) with multi layer wave. 1. Wave layer F1: Gann waves are drawn based on candles. SGann wave(Swing of Gann) is drawn based on Gann wave of wave layer F1. 2. Wave layer F2: Is a Gann wave drawn based on the SGann wave of wave layer F1. SGann waves are drawn based on Gann waves of wave layer F2. 3. Wave layer F3: Is a Gann wave drawn based on the SGann wave of wave layer F2. SGann waves are drawn based on Gann waves of wave layer F3. ---------Vi
FREE
Introducing The Day Trader System: Your Shortcut to Day Trading Success! Are you a day trader seeking simplicity without compromising profitability? Look no further! We present The Day Trader System – your go-to solution for identifying lucrative opportunities in the fast-paced world of Forex. Simple Yet Powerful: The Day Trader System is a straightforward yet highly effective indicator designed exclusively for day traders. Say goodbye to complexity and hello to a system that simplifies
FREE
O Chart Control é um indicador que permite de forma rapida e pratica alterar o timeframe e ativo do grafico, possibilitando que voce possa fazer todas as suas analises em apenas um grafico sem precisar abrir vários, além disso voce pode escolher o entre os temas claro e escuro para o qual melhor se adapta a sua preferencia.
MT4: https://www.mql5.com/pt/market/product/112155
FREE

Introducing the Accelerator Divergence Indicator, a powerful tool designed to enhance your Forex trading experience. This innovative indicator is specifically crafted to identify market divergence, providing traders with valuable insights for more informed decision-making. The Accelerator Divergence Indicator utilizes advanced algorithms to detect divergence in the market, visually guiding traders with precision-drawn lines that highlight key points of interest. Divergence occurs when the price
FREE
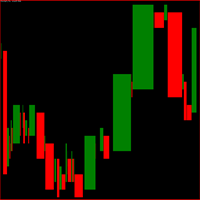
Indicador gerado a partir do tempo e da força da compra e da venda.
Quanto maior o número do parâmetro spread menos entradas será padrões pode-se ver, use para menos trades, ideal para não tomar muitos stops.
Quanto menor o número do parâmetro spread mais entradas com padrões, use para fazer scalp, operações curtas, maior probabilidade de stops. Observe o gráfico pelos menos uma semana antes de iniciar as operações. Quando começar faça somente uma operação por dia durante uma semana. vá aument
FREE
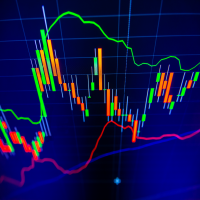
The underlying strategy of this indicator is based on identifying momentum in the market and attempting to capture the direction of the trend through transitions between bullish and bearish moments. Utilizing bands around the RWMA allows for identifying potential overbought and oversold situations in the market.
1. Calculation of the Range Momentum Index (RMI): The RMI is based on a combination of the Relative Strength Index (RSI) and the Money Flow Index (MFI), both of which are momentum indi

Introducing the True Currency Strength Indicator - Your Ultimate Guide to Market Mastery! Are you tired of guesswork when it comes to trading? Ready to elevate your trading strategy to a whole new level? Look no further! We present to you the True Currency Strength Indicator - the game-changer in the world of Forex trading. Unleash the Power of Multi-Currency Analysis: Gain a competitive edge with our revolutionary indicator that goes beyond traditional single-currency analysis. The Tru

The TradeQL Indicator is a customizable tool that highlights specific trading patterns on candlestick charts. Users can define patterns through TradeQL queries, which the indicator then applies to the chart, visually representing matches and captured groups. Ideal for identifying complex trade setups in real-time.
TradeQL queries are specified using the TradeQL Language. See https://github.com/abdielou/tradeql for more details. This language is expressed as a regular expression. The language al
FREE
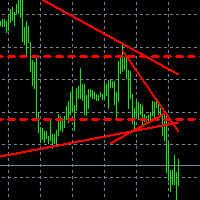
Что показывает на графике индикатор TrendBreak? 1 — рисует линию тренда до максимальных максимумов в 100 баров. 2 — рисует линию тренда до максимальных максимумов в 30 баров. 3 — рисует линию тренда до максимальных минимумов в 100 баров. 4 — рисует линию тренда до максимальных минимумов в 30 баров. И эти линии указывают на сжатие тренда. Также индикатор выбирает 100-й бар и рисует ровную линию к максимуму и минимуму.
FREE

Uncover high-probability opportunities in trending markets with the Brilliant Entries Indicator. Its clear visual signals can be followed and incorporated with market structure to provide you with accurate entries. Give it a try and gain an edge in your trading strategy.
It can be used on it's own but i highly recommend to used it as part of a wider strategy to provide you with confluence.
It works on all timeframes but will work very good doing market structure 2 x timeframes higher and then

必要な本数だけ自動でラインを描画し、サポートおよびレジスタンスとして使用できる Price Guide Full インジケーターです。 始値または他の初期価格に基づいてラインの本数を調整 し、ユーザー設定でライン間隔をピップまたはティックで選択できます。 Price Guide を使って市場のエントリーとエグジットのチャンスを最大化します。SST の Eduardo Gurufi の方法論に基づき、ボラティリティやキープライスレベル(例えば整数価格)をもとに取引ポイントを特定します。 もう手動でラインを描く必要はありません 。自動で描画されます。
任意の本数のラインを設定可能 。
サポートおよびレジスタンスを自動で描画 。
価格ゾーンを素早く特定 、例えば整数価格など。 MetaTrader 5 に対応しており、すべての口座タイプでテスト済み。 ストラテジーテスター でも完全に機能し、 Forex 、 株式 、 指数 、および B3 – ブラジル証券取引所 の市場で使用できます。 ️ 使用のヒント: 無料デモ版 をダウンロードし、取引

This indicator finds Double Top and Double bottom Example : What is Double Top When price establishes a new high and then falls, then reverse to the same candle area of High then its considered a valid double top and vice versa for double bottom. 1. It plots and high and low on visible chart if ChartChange is set to true else it searches on new bar opening
2. If there is double top and double bottom found in visible chart window then it plots a line 3. It has options to customize text color, tex
FREE
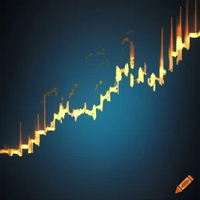
黄金パターンは、フィボナッチ数列の黄金比に基づいた 3 本のローソク足の構成です。
黄金比は1.618です。 その変動には、0.618、2.618、および 3.618 が含まれます。 このインジケーターでは、2.618 で最高の結果が得られます。
ゴールデン パターンは通常のローソク足とそれに続く大きなローソク足で構成され、終値は最初のローソク足の少なくとも 2.618 倍になります。
強気のゴールデンパターンは強気のローソク足で作られているのに対し、弱気のゴールデンパターンは弱気のローソク足で作られています。
シグナルに加えて、推奨されるエントリーラインが青い線として描かれ、最後の 2 本のローソク足に広がります。
そのパラメータは次のとおりです。
フィボナッチ比率 (0.618、1.618、2.618、3.618 など) 上記のシグナルの Wingdings コード、つまり弱気シグナル (スクリーンショットの Wingdings テーブルを参照) 上の信号の色 (弱気) 以下のシグナルの Wingdings コード、つまり強気シグナル (スクリーンショット
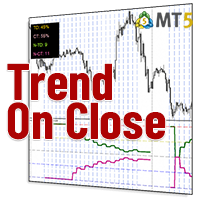
TrendOnCloseは、特定のローソク足サイクル内のトレンドとカウンター トレンドの統計分析に焦点を当てた、バイナリー市場投資家向けの高度 なインディケータです。
各サイクル は、ローソク足の終値によって定義され、次のサイクルが始まるまでの間、トレン ド方向(UP/DOWN - BULL/BEAR)を確立します。統計分析は2つの構成で行われます:
⦁ SUBSEQUENT CANDLEとしての統計目標: アルゴリズムは、サイクル内の後続のローソク足に焦点を当てます。
⦁ INTERCYCLESとしての統計ゴール: アルゴリズムは、各サイクル間のすべてのローソク足を考慮する。 選択された統計目標に基づき、各ローソク足のトレンドがCYCLEローソク足のトレンドと比較され、同一方向の場合はTREND-Percent(TD)とTrend-Occurrences(N-TD)が増加し、トレンドが乖離している場合はCOUNTER-TREND(CTとN-CT)が増加します。さらに、このインジケータは、日足、週足、月足の統計的な合計を提供し、これらの期間中、各サイクル の「トレンド」または「

ジュリック・アドバンストMA(JurMA)は、マーク・ジュリックが考案した オリジナルのJMAをベースに開発されたノンリペイントのテクニカル 指標です。
従来の移動平均線に見られるラグを減らし、平滑性を向上させ、ノイズを減らすように設計されています。JurMAは市場のボラティリティに適応し、ユーザーが感度を微調整できるため、金融市場のトレンドや反転を見極めるのに役立ちます。この適応性と効率性により、トレーダーやアナリストの間で人気があります。
他のテクニカル・インディケータの広い文脈では、「感度」とは、価格データの変 化に対してインディケータがどれだけ速く反応するかを意味します。ローソク足の本数ではなく、インジケータが一定期間の値動きをどのように解釈するか(反応性の大小)を意味します。JurMAは、このインジケータの動作、特に「移行プロセスの質」を調整するために、PHASE機能パラメータを提供しています。PHASEは線の "滑らかさ "とは関係なく、平均計算におけるJarikの公式と直接相互作用する方法であることを理解することが重要です(ノイズをフィルタリングするのに適しています
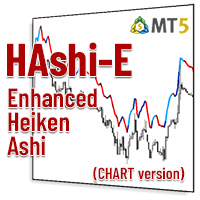
HAshi-EはHeiken-Ashiシグナルを分析する強化された方法です。
説明
HAshi-Eは、Heiken-Ashiシグナルを分析するための強化された方法です。HAshi-Eは、Heiken-Ashiシグナルを分析するための強化された方法です。HAshi-Eは、Heiken-Ashiシグナルを分析するための強化された方法です。伝統的なローソク足チャートとは異なり、ヒーケンアシのローソク足は過去のバーの平均値を使って計算されるため、よりスムーズで解釈しやすい視覚的表現が可能です。
その主な利点は、ほとんどの人が本来の読み方をしない理由でもあります。Heiken-Ashiローソク足には平均値に関する情報が含まれており、通常、資産ローソク足の前に配置されているため、色や形に惑わされ、不適切な時間帯や遅い時間帯にエントリーやエグジットを行う人をよく見かける。
HAshi-Eは、伝統的なHeiken-Ashiインジケータの改良版です! HAshi-E(チャート版)の特徴: 同じデータを異なる角度から見る HAshi-Eは、伝統的なHeiken-Ashiローソク足だけでなく、ライ
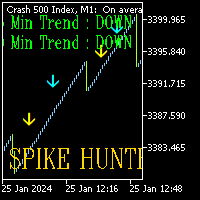
Spike Hunter has been developed for Crash and boom markets.
Spike Hunter does not repaint.
Also please download SPIKE HUNTER(B)-boom and SPIKE HUNTER(B)-crash from the comments section to assist with extra confirmation Buy Signal ; Make sure that the trend for boom is Uptrend on 15 and 30min. Use the SPIKE HUNTER(B)-boom on your chart. Once the Up arrow comes on and the SPIKE HUNTER(B)-boom line color is blue then its the best time to trade. Sell Signal ; Make sure that the trend for crash i
Designed by Welles Wilder for daily commodity charts, the ADXW is now used in various markets by technical traders to assess the strength of a trend or even a trend for short- or long-term trades.
The ADXW uses a positive (DI+) and negative (DI-) directional indicator in addition to its trend line (ADX).
According to Wilder, a trend has strength when the ADX signal is above 25; the trend is weak (or the price has no trend) when the ADX is below 20. The absence of a trend does not mean that th

This indicator is designed to help traders to help them Synchronize objects across all charts that have the same pair/currency.
Applicable objects: -Rectangle
-Trendlines
-Trendlines by Angle
-Horizontal Lines
-Vertical Lines
-Arrow Lines
-Channels
- Text boxes
Known Issues : - Visualization is not copied to the other charts. - If indicator is only placed in one chart, other charts with the same pair/currency will have difficulty deleting the objects if there is no "Sync Objects In Charts" in
FREE
O indicador é uma ferramenta desenvolvida para o MetaTrader, projetada para auxiliar na análise detalhada do comportamento do preço em relação a uma média móvel específica. Ao ser anexado ao timeframe diário, o ele realiza cálculos e monitora, em timeframes menores, quantas vezes o preço toca determinados níveis de afastamento durante o dias além de calcular a média dos toques.
MT4: https://www.mql5.com/pt/market/product/111706
FREE
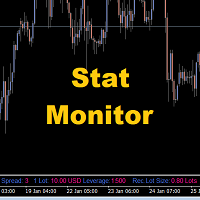
Stat Monitor is a good information indicator.
Benefits of the indicator: The indicator provides useful information - the current spread, the cost of one lot of the symbol, trading leverage and the recommended lot size for trading. You can use the indicator on the MetaTrader 5 trading platform of any broker. The indicator provides useful information.
Version of the Stat Monitor indicator for MetaTrader 4 I wish you all good luck in trading and stable profit!
FREE
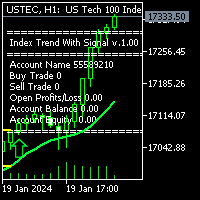
Description: Index Trend with Signal: is the Best working on DE40, USTEC, US30, US500 index on H-1 time chart with default settings. You don't need to change any settings. Easy to install and ready to start working. First of all this Index Trend with Signal Indicator is Non-Repainting, Non-Redrawing Indicator, which is best tool for Index Traders. For limited time only 50% OFF, Now 51$ only. 10 purchases left & the price increases to 30$ and final price will be 300$
Contact me right after th

Vision è un indicatore professionale che legge i dati storici del periodo impostato e in base a tali elabora una previsione scrivendo l'andamento sul grafico, l'impatto visivo eccellente rende chiaro l'andamento del prossimo trend e mette a fuoco il prezzo d'ingresso il posizionamento di ordini e la distanza per SL e TP, di default è impostato con un rapporto bilanciato 24 a 24 ciò significa che in base alle ultime 24 candele prevederà scrivendo sul grafico l'andamento delle 24 candele successi
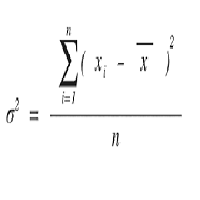
Calculate the Variance of prices on the chosen time frame and compare with the price range reached. Or in other words how mutch is price moving in the recent candles? Two impots: Candle = 4 (Default) number of previous candle to calculate Backward = 500 (Default) How many candle to go backward
Variance is calculated as follow: Variance(X) = Average(X 2 ) – [Average(X)] 2
Subsequently Variance is rapported to the price range fo the chosen period (i.e. 4 candles) Indicator = Variance(X) / (Ma
FREE
MetaTraderマーケットは自動売買ロボットとテクニカル指標を販売するための最もいい場所です。
魅力的なデザインと説明を備えたMetaTraderプラットフォーム用アプリを開発するだけでいいのです。マーケットでプロダクトをパブリッシュして何百万ものMetaTraderユーザーに提供する方法をご覧ください。

取引の機会を逃しています。
- 無料取引アプリ
- 8千を超えるシグナルをコピー
- 金融ニュースで金融マーケットを探索