 MetaTrader 5
 エキスパート
 インディケータ
 ライブラリ
ライブラリ
 ユーティリティ
 ウィジェット
 ルール
ルール
YouTubeにあるマーケットチュートリアルビデオをご覧ください
ロボットや指標を購入する
仮想ホスティングで
EAを実行
EAを実行
ロボットや指標を購入前にテストする
マーケットで収入を得る
販売のためにプロダクトをプレゼンテーションする方法
MetaTrader 5のための新しいテクニカル指標 - 153
 テクニカル指標からのシグナルは、株式および外国為替市場での取引の開始と終了に重要な役割を果たします。指標の本質は、将来の価格変動を予測することを目的とした金融銘柄価格の数学的変換です。
テクニカル指標をテストして、市場の動きとそれからの利益をより正確に予測します。
テクニカル指標からのシグナルは、株式および外国為替市場での取引の開始と終了に重要な役割を果たします。指標の本質は、将来の価格変動を予測することを目的とした金融銘柄価格の数学的変換です。
テクニカル指標をテストして、市場の動きとそれからの利益をより正確に予測します。 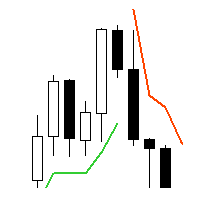
Supertrend - невероятно мощный и универсальный индикатор, предназначенный для помощи трейдерам в определении текущего тренда на конкретном торговом инструменте. С помощью двух встроенных индикаторов, Average True Range и Standard Deviation, трейдеры могут выбрать наиболее подходящий индикатор для своей стратегии торговли. Пользователи также могут настроить период этих индикаторов и выбрать цену (Close, High, Low, Open, Weighted), к которой он должен быть применен, с Typical price в качестве опци
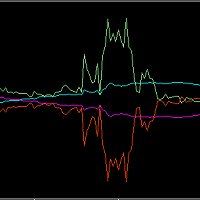
StartPoint是一个很好的短线交易指示器,这个指标可以单独使用,但是最好是配合 HighQualityMap 一起使用,适用于任何时间框架,喜欢超短线的朋友可以使用M5时间框架。它能很好的体现出短期趋势的启动点,你可以很快的从这个指示器上寻找到最佳的buy和sell位置,同时也能很好根据指示器去坚守自己的持仓定订单。指标不含有未来函数,不会重新绘制,不仅能够应用到自己的手动交易过程中,还能完全可以写入到自己的EA中。(如果你感觉到这个指标能够帮助你进行更准确的交易,请帮忙给个好评,希望我的作品能够帮助更多有需要的人) ===================参数列表===================== 所有参数均采用默认参数即可,无需更改,若为激进型交易者,可以根据自己的需要来调整参数。 =================参考使用方法=================== 此指标可以适用于任何交易品种。
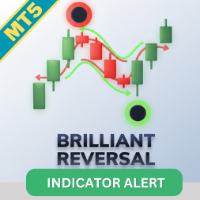
Brilliant Reversals MT5を紹介します。これは、市場における潜在的なトレンド反転ポイントを特定するために設計された高度なトレーディングインジケーターです。この強力なツールは、トレーダーが取引のエントリーまたはエグジットの重要な瞬間を正確に特定することで、意思決定プロセスを強化するのに最適です。 Brilliant Reversals MT5は、洗練されたアルゴリズムを活用して正確なシグナルを提供し、トレーダーが市場のボラティリティを活かすのを助けます。その非再描画性により、このインジケーターはバーのクローズ後もシグナルが信頼できることを保証し、初心者と経験豊富なトレーダーの両方にとって信頼できるリソースとなります。 MQL製品のインストールガイド | MT4/MT5で購入したMQL製品の更新 | 一般的なトラブルシューティングガイド | インジケーター設定 / ガイド 主な特徴 バッファ統合: インジケーターの値をアクセス可能なバッファとして公開し、Expert Advisorが自動取引のためにシグナルを利用できるようにします。 迅速かつバックテスト可能: Meta

Consecutive Candle MT5を紹介します。これは、強気または弱気のキャンドルの連続を特定することで、あなたのトレーディング戦略を強化するために設計された革新的なインジケーターです。このツールは、forex、株式、暗号通貨、商品市場のトレーダーに最適で、明確なシグナルとアラートを提供し、情報に基づいた意思決定をサポートします。 トレンドの確認や潜在的な反転に対してタイムリーなアラートを提供する能力により、Consecutive Candle MT5はその精度と使いやすさで高く評価されています。多くのトレーダーがこのインジケーターを利用して持続的なトレンドを活用することで、取引のタイミングが改善され、成功率が向上したと報告しています。 MQL製品のインストールガイド | MT4/MT5で購入したMQL製品の更新 | 一般的なトラブルシューティングガイド | インジケーター設定 / ガイド 主な機能 バッファ統合:インジケーターの値を、Expert Advisorによる自動シグナルベースの取引で直接読み取れるバッファとして公開します。 視覚的矢印シグナル:シグナルキャンドルに
FREE
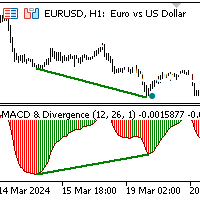
The indicator identifies divergence by analyzing the slopes of lines connecting price and MACD histogram peaks or troughs. Bullish Divergence (Convergence): Occurs when the lines connecting MACD troughs and corresponding price troughs have opposite slopes and are converging. Bearish Divergence: Occurs when the lines connecting MACD peaks and corresponding price peaks have opposite slopes and are diverging. When a divergence signal is detected, the indicator marks the chart with dots at the pric

Brief Description B4S Economic News Radar now offers enhanced features to keep traders informed and empowered. Experience comprehensive news coverage directly on your trading chart, including upcoming and past events, customizable reminders, and automatic time zone adjustments. Why News Events Matter: Market volatility triggered by economic indicators, central bank decisions, and geopolitical events can significantly impact trading outcomes. Stay ahead of these shifts with timely information and

The Chapon Channel indicator is a classic channel indicator that allows a trader to react when the price goes beyond the boundaries of the established channel. This channel is formed based on the analysis of several candles, starting with the last one, in order to determine the extremes in the period under consideration. These extrema are then used to construct channel lines.
Channel trading is one of the most popular strategies in the Forex market and due to its simplicity, even beginners can

Brief Description: A tool to display historical Open, High, Low, and Close (OHLC) price points for various time periods. Gain insights into market behavior with data from yesterday, the day before, the previous week, and the previous month. Recognize liquidity zones effectively. Features: 1. Comprehensive Timeframe Insights: Visualize crucial OHLC points for different timeframes. Historical data for yesterday, day before yesterday, previous week, and previous month. 2. Built on ICT's Teachings:

Brief Description The indicator is a powerful tool based on Inner Circle Trader's trading theory. It strategically plots lines at key prices relative to time, highlighting crucial market moments such as Tokyo Open, New York Midnight, London Open, New York Open, New York 8:30 AM, and New York Session End. The indicator is built on the foundation of Inner Circle Trader's trading theory, emphasizing the significance of key open times as liquidity and reference zones. These zones act as magnets for
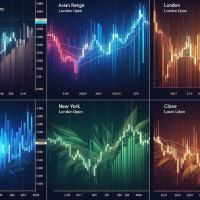
Brief Description The B4S_ICT_Killzones indicator is designed to enhance your trading strategy by highlighting key market times based on the Inner Circle Trader's (ICT) proven trading model. This indicator intelligently plots colored boxes around critical "killzone" periods, providing valuable insights into market behavior influenced by different geographical and time zone locations and time variations. Features / Indicator Settings 1. Killzone Identification Asian Range: Target the Asian tradin

Brief Description: The B4S_Institutional_Round_Number_Prices indicator identifies and marks key price levels, known as round number prices or institutional price levels, renowned for their psychological significance. These levels often influence institutional activity, attracting attention and triggering significant market moves. Features: Round Number Price Identification: The indicator excels at identifying round number prices, providing you with crucial insights into potential market moveme

Brief Description The B4S PriceLevel Watcher is a useful indicator designed to empower traders with precise price level notifications. It allows users to set customizable notifications based on specific price types, such as close, high, low, ask, bid, or either ask or bid of the current candle. Problem being solved In the ever-evolving world of trading, staying attuned to price movements is paramount. Traders need to remain vigilant, ready to act swiftly as market conditions change. However, t

Schaff Trend Cycle (STC) "CON ALERTAS"
El Indicador Schaff Trend Cycle (STC) es una herramienta técnica utilizada en el trading e inversión para identificar tendencias y generar señales de compra o venta. ¿Qué es el Schaff Trend Cycle? El STC fue desarrollado por Doug Schaff para mejorar las medias móviles incorporando análisis de ciclos. Su objetivo es identificar tendencias y cambios de tendencia midiendo la fuerza y velocidad de los cambios de precio. Es un oscilador que mide la velocidad
FREE

PreCogniTrade : Un Indicador Técnico Avanzado para Predecir el Mercado (Fase Beta) El PreCogniTrade es un indicador técnico revolucionario diseñado para los traders que buscan una ventaja competitiva en los mercados financieros. Este indicador no solo analiza las tendencias actuales, sino que también predice los movimientos futuros de los precios con una precisión asombrosa, lo que lo convierte en una herramienta de incalculable valor para cualquier estrategia de trading. Características Pri
FREE

El **Heiken Ashi Smoothed** es una versión suavizada del indicador técnico Heiken Ashi, que se utiliza en el análisis de gráficos de velas para identificar tendencias del mercado y pronosticar movimientos de precios. Este indicador se basa en el promedio de datos de precios para formar un gráfico de velas que ayuda a los traders a filtrar el ruido del mercado.
**¿Para qué sirve?** Este indicador se utiliza para identificar cuándo los traders deben permanecer en una operación y cuándo está por
FREE
Buy DEMA 3 Scalp Indicator, Signaling and Trend Finder for Forex DEMA 3 indicator is a professional indicator for finding trends as well as finding entry and exit points for a symbol. This indicator is designed based on the DEMA indicator, which can tell you the signals accurately and quickly. The DEMA 3 indicator can give you accurate and early entry points for swings. Features of the DEMA indicator 3
Receive signals as notifications on the Metatrader mobile application. Receive signals by ema
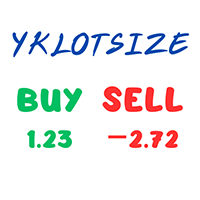
YK Lot Size — A clean, ultra-fast order summary & risk monitor for MetaTrader 5 (MT5). Key Features: Simple 3-Line Display : Shows remaining Equity , BUY Lot & P/L, and SELL Lot & P/L directly on your chart. Smart Colors : Green for profit, Red for loss, Gray when no open orders. Stop Out Warning Line : Automatically plots a red dotted line on the chart showing your exact liquidation/Stop Out price. Symbol or All Positions : Monitor only the current chart or your entire account. Zer
FREE

The YK-SMART-EMA is an indicator that displays multiple Exponential Moving Average (EMA) lines on a price chart to help analyze price trends. This indicator features five EMA lines: EMA14 (red line): Calculated based on the closing prices of the last 14 candles. EMA30 (blue line): Calculated based on the closing prices of the last 30 candles. EMA50 (green line): Calculated based on the closing prices of the last 50 candles. EMA100 (orange line): Calculated based on the closing prices of the last
FREE

Sentimento de Mercado é um indicador que usa os dados do nosso principal indicador: Market Strength Radar.: https://www.mql5.com/pt/market/product/114568?source=Site +Profile+Seller Ele imprime um gráfico de linhas que deve ser comparado com o gráfico de preço para entendermos o sentimento do mercado. As divergencias são pontos importantes de inflexão. As convergências mostram força da tendência atual.
FREE

El indicador técnico conocido como Líneas de Tendencia Perfecta . Este indicador es una herramienta valiosa en el análisis técnico y se utiliza para mejorar la toma de decisiones en el trading. Aquí tienes una descripción paso a paso de cómo funciona y cómo puede ser utilizado por los traders: Identificación de Tendencias : Las líneas de tendencia perfecta se dibujan conectando dos o más puntos de precio en un gráfico, revelando así la dirección general del mercado. Una línea ascendente indica
FREE

La **Media Móvil de Tercera Generación (TGMMA)** es una versión avanzada del indicador estándar de **Media Móvil (MA)**. Fue descrita por primera vez por Manfred G. Dürschner en su artículo "Gleitende Durchschnitte 3.0" (en alemán). Aquí están las características clave de la TGMMA:
1. **Reducción del Retraso**: - A diferencia de las MAs tradicionales, la TGMMA reduce significativamente el retraso. Se adapta más rápidamente a los cambios de precios, lo que la hace ideal para traders que busc
FREE

Indicador Maestro del Trader
Características Principales: Spread del Mercado en Tiempo Real : Visualiza el diferencial entre el precio de compra y venta directamente en tu gráfico. Cuenta Regresiva del Cierre de Vela : No más sorpresas al final de la vela. El indicador muestra un cronómetro que te informa cuánto tiempo queda antes de que se cierre la vela actual. ¡Actúa con precisión en los momentos cruciales! Ganancias o Pérdidas en Tiempo Real : ¿Estás en verde o en rojo? El Indicador Maest
FREE

This is a tool to estimate your probability of bankruptcy. features. estimate a probability of bankruptcy (Nauzer J. Balsara) from your trade history usually, it is small print and never interfere with trades alert in large prints and color when it exceed the alert level you can set parameters(i.e. winning ratio) fixed and simulate freely *1: this value is for reference only and is not guaranteed to occur.
FREE

Un indicador técnico de múltiples osciladores es una herramienta de análisis que combina varios osciladores para proporcionar una visión más completa de la dinámica del mercado. Los osciladores son fórmulas matemáticas que se calculan a partir de los datos de los precios y se representan gráficamente para ayudar a identificar la tendencia actual, el sentimiento del mercado y posibles puntos de giro.
**¿Para qué sirve?** Este indicador sirve para identificar condiciones de sobrecompra y sobreve
FREE

Buy CTS scalping indicator, provide buying and selling signals, automatic channeling and sending signals to mobile phones
Using technical analysis and price action methods and modern methods, CTS indicator can draw price channels and recognize price trends with high accuracy and issue entry and exit signals according to them. Traders can easily fluctuate using this indicator in different time frames and in different markets. With the CTS indicator, you can signal in different ways. This indicato

Atomic Analyst — MetaTrader 5 ご購入後、MQL5で私にメッセージをお送りいただくと、Smart Universal Expert Advisorを無料で受け取れるほか、オンライン講座、PDFマニュアル、非公開グループへのアクセスもご利用いただけます。 Atomic Analystは、プライスアクション、トレンドの方向、エントリー・決済シグナル、損切り水準、複数の利確水準をチャート上にまとめて表示します。 シグナルを確認し、取引の状況を理解する Atomic Analystは、分析結果をわかりやすい視覚情報として表示します。 • エントリーの候補を見つけるための買い・売りの矢印。
• 取引計画に役立つ損切り水準と複数の利確水準。
• 市場の方向性を評価するトレンド、強さ、モメンタムの指標。
• より広い市場背景を比較する複数時間足の分析。
• 変化する状況を追うための色分けされたローソク足とアラート。 シグナルと補助分析を併せて確認し、その取引機会がご自身のルールに合うかを判断してください。 短期の取引機会から、より大きな値動きまで Atomic A

地震計マーケット クエイク検出器。 Description in English :
https://www.mql5.com/en/market/product/114637
How to use the Seismograph :
https://www.mql5.com/en/market/product/114637#!tab=comments&page=1&comment=52816464
Creating an EA :
https://www.mql5.com/en/market/product/114637#!tab=comments&page=1&comment=52816487
どのような取引方法であっても、流動性の低い市場への参入は絶対に避けたいものです。 地震計は、市場が上昇する前に市場に参入する適切なタイミングに役立ちます。 しかし、忙しいはずの市場時間帯にエントリーするようにしたにもかかわらず、流動性の低い市場に閉じ込められてしまう人が多いのが実情です。 数時間待った後、市場は急に賑わってきましたが...その結果、多くの人々が市場の反対の方
MetaTrader 5 の秒チャート
インジケーターを使用すると、MetaTrader 5 ターミナルで秒単位のタイムフレームのチャートを作成できます。このようなチャートのタイムフレームは、分単位や時間単位ではなく、秒単位で設定されます。したがって、M1 未満のタイムフレームのチャートを作成できます。たとえば、S15 は 15 秒の期間のタイムフレームです。結果のチャートにインジケーター、エキスパート アドバイザー、スクリプトを適用できます。
通常のチャートと同じように操作できる、完全に機能するチャートが得られます。
秒単位のタイムフレームは、既存のティック データベースにより、リアルタイムだけでなく履歴に基づいて構築されます。したがって、履歴がすでに蓄積されている秒単位のタイムフレームをいつでも開くことができます。
同時に、データは遅延なく基本チャートと同期して更新されます。
タイムフレームは秒単位で選択できます: S1、S2、S3、S4、S5、S6、S10、S12、S15、S20、S30。 また、任意の値を設定することもできます。
注:
このインジケーターをインス
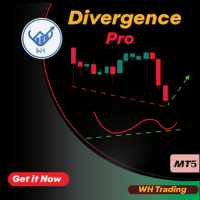
取引を次のレベルに引き上げる準備はできていますか? WH ダイバージェンス プロ MT5 のご紹介 、
さまざまな人気のテクニカル指標から選択できる高度なダイバージェンス指標です。
独自の取引戦略に合わせてダイバージェンスシグナルを調整できるようになりました。 購入後、手順を案内するために私にご連絡ください 主な特徴 :
インジケーターの選択 : 次のオプションから好みのインジケーターを選択します。 RSI (相対強度指数)。 素晴らしいオシレーター。 CCI (商品チャネル指数)。 さらに多くのインジケーターが追加される予定です。 正確なシグナル : 選択したインジケーターに基づいて発散または収束が発生したときにアラートを受け取ります。 カスタマイズ可能なパラメータ : 感度、タイムフレーム、その他の設定を調整して信号を微調整します。 非再描画 : 再描画を心配することなく、正確な信号を信頼します。 使い方 :
インジケーターの選択 : あなたの取引スタイルに共鳴するテクニカル インジケーターを選択します。 スポット法線ダイバージェンス : 選択したインジケーターと価格が反対

The indicator is designed to work on any trading platform. The program is based on proprietary algorithms and W.D.Ganna's mathematics, allowing you to calculate target levels of price movement based on three points with the highest degree of certainty. It is a great tool for stock trading. The indicator has three buttons: NEW - call up a triangle for calculation. DEL - delete the selected triangle. DELS - completely remove all constructions. The probability of achieving the goals is more than 80
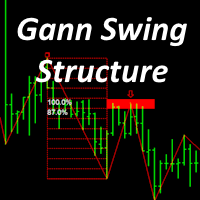
This indicator is based on the mathematics of the great trader W.D. Ganna. With its help, you can easily find strong levels by analyzing swings to find the optimal entry point. The indicator works on all instruments and all timeframes. The indicator is fully manual and has control buttons. All you need to do is press the NEW button, a segment will appear, which you can place on any movement, swing or even 1 candle that you want to analyze. By placing the segment, press the OK button. A grid (th
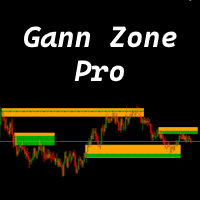
This indicator identifies and displays zones, as it were areas of strength, where the price will unfold. The indicator can work on any chart, any instrument, at any timeframe. The indicator has two modes. The indicator is equipped with a control panel with buttons for convenience and split into two modes. Manual mode: To work with manual mode, you need to press the NEW button, a segment will appear. This segment is stretched over the movement and the LVL button is pressed. The level is displayed
The " Vertical Levels " indicator for the Forex market is a tool for displaying vertical levels on a price chart. These levels can be useful for a trader, as they help identify significant points in price movement and potential reversal or trend continuation zones.
Peculiarities:
Vertical Levels: The "Vertical Levels" indicator allows you to display vertical lines on the chart, indicating certain levels. These levels can be adjusted using input parameters. Setting options: Length : Length of
Inicialmente este indicador foi elaborado e pensado para rastrear pontos ou velas onde há força de tendência. Como nas grandes descobertas, cheguei ao indicador que mostra principalmente velas de reversão, pontos de tensão, alta liquidez, resistência. O indicador traz simplificação ao gráfico, indicando todos os pontos onde possivelmente teríamos lta´s, ltb´s, médias móveis, bandas, ifr alto. O indicador não faz o gerenciamento de risco, apenas mostra as velas onde podem ocorrer reversão. Lembre
FREE
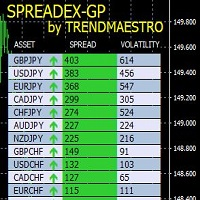
SPREADEX is an indicator for MT4 and MT5 that indicates the distance of an asset from the GP. The GP is the price of the underlying asset's true value, obtained by estimation. The GP is like a magnet; it attracts the asset's price with a high probability and within the same trading day. Therefore, SPREADEX indicates which assets are currently furthest from the GP in real time. This provides the trader with a point of view on which assets to focus on and look for any price reversal signals to obt
FREE

This indicator identifies the global trend and has a powerful algorithm for filtering out any type of noise that can interfere with trend direction identification. A special filter shows areas of sideways trend, consolidation or flat, which allows you to avoid any uncertainties in the market movement vision and gives a clear understanding of the global trend movement.
This indicator has no analogues and gives it unique advantages in the analysis of price movements and determination of the dire

This is the MT5 version of Extreme Reversal Sniper MT4 Indicator Extreme Value Sniper is a detrended price indicator Indicator finds the potential reversal levels by checking value ranges and price cycles.
***Indicator does NOT repaint so it provides accurate NO REPAINT REVERSAL SIGNALS***
MT4 Version of the Indicator: https://www.mql5.com/en/market/product/114426
It shows the overbought and oversold levels using the average range. Overbought Levels are between 4 and 10 Oversold levels are
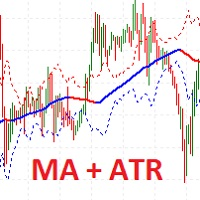
I present the well-known Moving Average indicator connected to the ATR indicator.
This indicator is presented as a channel, where the upper and lower lines are equidistant from the main line by the value of the ATR indicator.
The indicator is easy to use. The basic settings of the moving average have been saved, plus the settings for the ATR have been added.
Moving Average Parameters:
MA period Shift MA Method
Moving Average Parameters:
ATR TF - from which timeframe the values are taken A
FREE
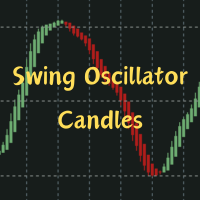
Description:
Heikin-Ashi-like swing oscillator candles. It can be used in the same way as RSI or Stochastic.
For example: Zero crossing. Above the zero line is bullish, below the zero line is bearish.
Overbought or oversold. 100 line is the extreme bought level, -100 line is the extreme sold level.
Divergences.
Time frame: Any time frame.
Instrument: Any instrument.
FREE

The indicator IQuantum shows trading signals for 10 symbols in the daily chart: AUDCAD, AUDUSD, EURUSD, GBPCAD, GBPCHF, GBPUSD, NZDUSD, USDCAD, USDCHF, and USDJPY.
Signals of the indicator are produced by 2 neural models which were trained independently from one another. The inputs for the neural models are normalised prices of the symbols, as well as prices of Gold, Silver and markers of the current day.
Each neural model was trained in 2 ways. The Ultimate mode is an overfitted neural model
FREE

Midpoint Bands is a channel-like indicator that draws two lines on the chart - an upper band and a lower band, pointing out possible reversal levels.
This is one of the indicators used in the Sapphire Strat Maker - EA Builder.
Sapphire Strat Maker - EA Builder: https://www.mql5.com/en/market/product/113907
The bands are simply calculated like this:
Upper Band = (HighestHigh[N-Periods] + LowestHigh[N-Periods])/2 Lower Band = (LowestLow[N-Periods] + HighestLow[N-Periods])/2 Middl
FREE
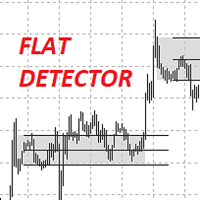
I present to you the IndFlatDetector indicator.
It belongs to the level indicators and shows the Trading Levels. This indicator combines the simplicity of intuitive settings and the accuracy of drawing levels.
Up count - the number of candlesticks up to determine the upper range
Down count - the number of candlesticks down to determine the lower range
Borders on the body or shadow - calculate the range by shadows or by body
Change the borders or not - change the boundaries of the original

"GoldenSwing" is a comprehensive MetaTrader 5 indicator meticulously crafted by Southern Star Trading, designed to enhance your trading strategies with precision swing high and swing low identification. Harnessing the power of swing analysis, this indicator provides traders with invaluable insights into market reversals and trend continuations, enabling them to make informed trading decisions.
With its advanced algorithm, GoldenSwing detects significant swing highs and swing lows in real-time,

The well-known ZigZag indicator that draws rays based on the "significant movement" specified by the pips parameter. If a ray appears, it will not disappear (the indicator is not redrawn), only its extremum will be updated until the opposite ray appears. You also can display text labels on each rays describing the width of the ray in bars and the length of the ray in points.
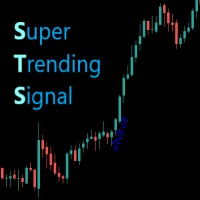
O indicador Supertrendingsignal imprime um sinal na tela indicando início de uma forte tendência. O sinal não mostra o ponto de entrada com melhor risco retorno, apenas faz a indicação de uma forte tendência. Foi idealizado a partir de um conjunto de médias móveis e volume. Parametros: Periodmalongo: Períodos da média longa Periodmamedio: Períodos da segunda media Periodmamedio2: Perídos da terceira media Periodmacurto: Períodos da média curta. PeriodATR: Períodos do indicador ATR para adequar
FREE
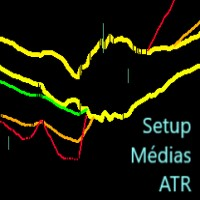
Este indicador imprime 2 médias com distância de 1 ATR (Average True Range) da média principal. As demais médias móveis só são mostradas se estiverem fora desse intervalo. Parâmetros: mediaprincipal = Média que será criado o intervalo, não será mostrada. mediasec1, mediasec2, mediasec3 = médias secundárias. periodatr: periodos do ATR Este indicador faz parte do Trade System MarketStrengthRadar
FREE

Simple candle countdown - never again miss how much time is left to open a new bar!
This indicator doesn't plot any line on the chart - it uses only objects and calculates the time left to open a new bar.
You can set custom colors for the panel background and border and for the text color. Simple as that, the indicator is ready to use.
If you find any bugs, feel free to contact me.
FREE

The ZigZag Wave Entry Alert** indicator, created by Azad Gorgis in 2024, is designed for MetaTrader 5 and aims to provide traders with entry signals based on ZigZag patterns. Here's a brief overview of its functionality and key features:
Functionality:
- Detection of ZigZag Patterns: The indicator identifies significant price movements and outlines potential ZigZag patterns on the chart. It detects new highs and lows based on user-defined parameters such as Depth, Deviation, and Backstep. - A
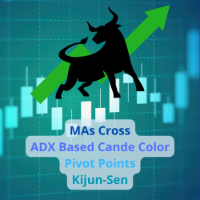
The set of most common indicators for day trading and long-term trading.
MAs Cross (Global Trend) ADX Based Candle Color (Local Trend) Pivot Points (Entry Levels) Kijun-Sen You can use this indicator in different ways, one of it is opening positions in trend direction on pivot points levels. Contact
If you have some questions or if you need help, contact me via Private Message.
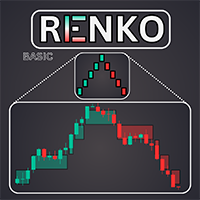
基本的なRenkoインディケータは、明確で簡潔な相場観を求めるトレーダーにとって強力なツールです。当社のインディケータは、トレンドの視覚化を簡素化するだけでなく、反転の正確なアラートを提供し、あなたの取引に戦略的な優位性を提供します / MT4無料版
特徴 フルカスタマイズ可能: 高度なカスタマイズオプションにより、インジケーターをお好みに合わせてカスタマイズできます。色からボックスサイズ設定まで、チャート上の情報表示方法を完全にコントロールできます。 反転アラート: 反転アラートで、市場の方向性が変化する可能性をいち早く知ることができます。これにより、利益を最大化し、損失を最小化するために、情報に基づいたタイムリーな意思決定を行うことができます。
入力項目 Size of the boxes: ボックスサイズ(ポイントベース) Bullish box colour: 強気ボックスの色 Bearish box colour: 弱気ボックスの色 Box opacity: 不透明度(0から100の間)。不透明度が低くなるにつれて透明度が高くなる Text
FREE
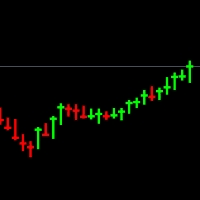
注 - 既存のグラフの種類を非表示にする必要があります。グラフの色を変更することでそれを行うことができます。方法がわからない場合は、このビデオを確認してください - https://youtu.be/-4H6Z5Z4fKo または、priceaction9@outlook.com までご連絡ください。
これはチャートの代わりに表示されるタイプのチャートで、高値、安値、終値のみが表示され、芯が太いです。各ローソク足の始値によってもたらされるノイズを減らすことで、各ローソク足をより深く理解するのに役立ちます。
たとえば、1 から 10 までのスケールで、ろうそくが 5 で開き、8 で閉じ、1 で安値になった場合、それは 3 つの点からなる本体を形成し、残りの点には芯があるため、作成が困難な場合があります。それの感覚。
このチャートでは、同じシナリオが発生した場合、終点は 8 に表示されます。これを見ると、1 から 8 まではプラスの方向に、10 から 8 まではマイナスの方向に上昇したことがすぐにわかります。強気のキャンドル。
ご質問がございましたら、priceaction9@

ご紹介いたします、 Golden Sniper Indicator は、トレーダーのトレード体験を向上させるために精巧に作成された強力な MQL5 ツールです。6年以上の経験を持つトレーダーチームによって開発され、このインジケーターは非常に高い精度でトレード機会を特定するための信頼性のある方法を提供します。 主な特徴 : アラートとシグナル矢印 :Golden Sniper Indicator はタイムリーなアラートと視覚的なシグナル矢印を提供し、トレンド反転を特定するのに役立ちます。 リスク管理 :Risk-Reward Ratio(RRR)に基づいて適切な利益確定とストップロスのレベルを示します。 適応性 :初心者からプロのトレーダーまで、このインジケーターはスイングトレードやスキャルピングなどさまざまなトレードスタイルに適応します。 カスタマイズ可能な設定 :インジケーターを自分の好みに合わせて調整できます。 おすすめ : タイムフレーム :Golden Sniper Indicator はすべてのタイムフレームで優れたパフォーマンスを発揮します。スキャルピングにはM5とM15

The indicator works to convert normal volume into levels and determine financial liquidity control points.
It is very similar in function to Fixed Volume Profile.
But it is considered more accurate and easier to use than the one found on Trading View because it calculates the full trading volumes in each candle and in all the brokers present in MetaTrade, unlike what is found in Trading View, as it only measures the broker’s displayed prices.
To follow us on social media platforms:
telegram
FREE
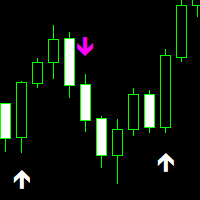
non-repaint free MT5 technical indicator works on all timeframes 1 minute to the monthly timeframe the trade vision buy and sell arrow is a multi currency and synthetic indicator Trade vision buy and sell arrow comes with Push Alerts purple arrow look for selling opportunities white arrow look for buying opportunities. wait for candle to close and arrow to appear before taking any trades.
FREE

Brief Description: An advanced navigation, news display, and control panel indicator designed to revolutionize your chart analysis experience. Seamlessly navigate through timeframes, dates, and times with an intuitive control panel, and stay informed with visually represented detailed news events. Now with enhanced features and improvements for an even better trading experience. Key Features: User-Friendly Control Panel: Easily navigate through timeframes, dates, and times. Enable or disable the
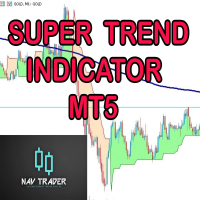
SUPERTREND; It is a trend following indicator based on the SuperTrend ATR created by Nav. It can be used to detect changes in trend direction and locate stops. When the price falls below the indicator curve, it turns red and indicates a downtrend. Conversely, when the price moves above the curve, the indicator turns green, indicating an uptrend.
BUY/SELL Signals; Method 1; A standard strategy using a single SuperTrend is While ST Period 1=10, ST Multiplier 1=3, - SELL signal when the bars f

Simplify your trading experience with Trend Signals Professional indicator. Easy trend recognition. Precise market enter and exit signals. Bollinger Bands trend confirmation support. ATR-based trend confirmation support. (By default this option is OFF to keep interface clean. You can turn it ON in indicator settings.) Easy to spot flat market conditions with ATR-based trend confirmation lines. Highly customizable settings. Fast and responsive. Note: Do not confuse ATR-based trend confirmation
FREE

The Angle Prices indicator is a tool that calculates the price angle based on price analysis, interpreting the time vector in the form of price points on the price chart. In other words, the X axis and Y axis are represented as price points, so you can actually calculate the angle with two axes of the same dimension. This allows traders to obtain information about the direction of price movement and possible entry or exit points for trades. Let's look at the main characteristics and interpretat
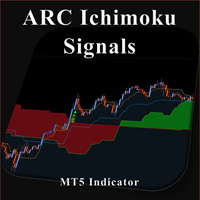
Combination of Ichimoku and Super Trend indicators, with Signals and live notifications on Mobile App and Meta Trader Terminal. Features: Display five reliable signals of ARC Ichimoku Filter signals by their strength level (strong, neutral, weak) Send live notifications on Mobile App and Meta Trader terminal S ignals remain consistent without repainting Applicable across all time-frames Suitable for all markets Notifications format: "ARC Ichimoku | XAUUSD | BUY at 1849.79 | Tenken-Kijun cross |
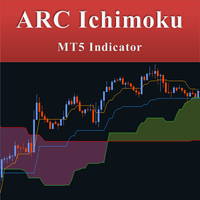
Combination of Ichimoku and Super Trend indicators. 1. ARC (Average Range times Constant) The concept of ARC or Volatility System was introduced by Welles Wilder Jr. in his 1978 book, New Concepts in Technical Trading Systems . It has since been adapted and modified into the popular Super Trend indicator.
The fundamental idea behind ARC is simple: to identify support and resistance levels, you multiply a constant with the Average True Range (ATR) . Then, you either subtract or add the resulting
FREE
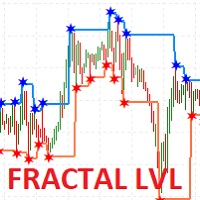
I present the well-known Fractal indicator.
Levels have been added to this indicator.
At the extreme points, you can see the continuation of the price line, which changes when the values of the Fractal indicator change.
The indicator is easy to use. The basic Fractal settings have been saved.
FractalLevels Parameters:
LeftBars - the number of bars on the left
RightBars - the number of bars on the right
FREE

Introducing the B4S BidLine CandleTimer An insightful indicator that combines real-time bid line visualization with a dynamic countdown timer. Gain a competitive edge in your trading as you stay informed about the time remaining until the next candle starts, all displayed seamlessly on your chart. Why B4S BidLine CandleTimer? Unleash the potential of your trading strategy with the B4S BidLine CandleTimer. Here's why this indicator stands out: Real-Time Bid Line: Witness market movements like nev

I present the well-known Moving Average indicator.
This indicator is presented as a channel, where the upper and lower lines are equidistant from the main line by a percentage set by the user.
The indicator is easy to use. The basic settings of the moving average have been saved and a percentage parameter (Channel%) has been added.
Basic parameters:
Channel% - shows how much we want to deviate from the main line.
The indicator is freely available.
FREE

The Trend Approximator indicator is a powerful trend indicator that helps traders identify turning points in the Forex market. Here are the main characteristics and parameters of this indicator:
Main characteristics:
Trend Indicator: Trend Approximator is a trend indicator that helps determine the direction of the current trend and identify potential reversal points.
Finding Pivot Points: It searches for and displays pivot points on a price chart, allowing traders to react to changes in the

BEHOLD!!!
One of the best Breakout Indicator of all time is here. Multi Breakout Pattern looks at the preceding candles and timeframes to help you recognize the breakouts in real time.
The In-built function of supply and demand can help you evaluate your take profits and Stop losses
SEE THE SCREENSHOTS TO WITNESS SOME OF THE BEST BREAKOUTS
INPUTS
MaxBarsback: The max bars to look back
Slow length 1: Period lookback
Slow length 2: Period lookback
Slow length 3: Period lookback
Slow
FREE
Descubre el poderoso aliado que te guiará en el laberinto de los mercados financieros. Este indicador revolucionario te llevará de la incertidumbre a la claridad, permitiéndote identificar con precisión los puntos de inflexión del mercado. Mejora tus decisiones de entrada y salida, optimiza tus operaciones y ¡multiplica tus ganancias con confianza.
Ahora con alertas en tu pc o móvil
¡Para más información, te invitamos a unirte a nuestro canal de Telegram en https://t.me/Profit_Evolution ¡Al
FREE

The Rayol Code Hour Interval Lines indicator was designed to assist your trading experience. It draws the range of hours chosen by the user directly on the chart, so that it enables traders to visualize price movements during their preferred trading hours, providing traders a more comprehensive view of price movements and market dynamics. This indicator allows the user to choose not only the Broker's time, but also the Local time. This way, the user no longer needs to calculate local time in
FREE
Descubre el poderoso aliado que te guiará en el laberinto de los mercados financieros. Este indicador revolucionario te llevará de la incertidumbre a la claridad, permitiéndote identificar con precisión los puntos de inflexión del mercado. Mejora tus decisiones de entrada y salida, optimiza tus operaciones y ¡multiplica tus ganancias con confianza.
¡Para más información, te invitamos a unirte a nuestro canal de Telegram en https://t.me/Profit_Evolution ¡Allí encontrarás contenido exclusivo, an
FREE
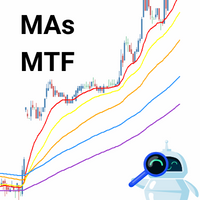
El indicador técnico propuesto es un sistema de medias móviles de múltiples marcos temporales diseñado para ayudar a los operadores del mercado financiero a seguir de cerca los movimientos tendenciales. Al combinar medias móviles de diferentes períodos, este indicador ofrece una visión más completa de la dirección de la tendencia, lo que permite a los traders identificar oportunidades de trading con mayor precisión. Al utilizar este indicador, los operadores pueden maximizar sus ganancias al tom
FREE
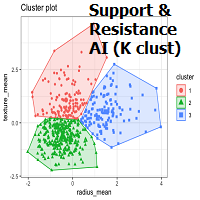
OVERVIEW
K-means is a clustering algorithm commonly used in machine learning to group data points into distinct clusters based on their similarities. While K-means is not typically used directly for identifying support and resistance levels in financial markets, it can serve as a tool in a broader analysis approach.
Support and resistance levels are price levels in financial markets where the price tends to react or reverse. Support is a level where the price tends to stop falling and m
MetaTraderマーケットは自動売買ロボットとテクニカル指標を販売するための最もいい場所です。
魅力的なデザインと説明を備えたMetaTraderプラットフォーム用アプリを開発するだけでいいのです。マーケットでプロダクトをパブリッシュして何百万ものMetaTraderユーザーに提供する方法をご覧ください。

取引の機会を逃しています。
- 無料取引アプリ
- 8千を超えるシグナルをコピー
- 金融ニュースで金融マーケットを探索