 MetaTrader 5
 エキスパート
 インディケータ
 ライブラリ
ライブラリ
 ユーティリティ
 ウィジェット
 ルール
ルール
YouTubeにあるマーケットチュートリアルビデオをご覧ください
ロボットや指標を購入する
仮想ホスティングで
EAを実行
EAを実行
ロボットや指標を購入前にテストする
マーケットで収入を得る
販売のためにプロダクトをプレゼンテーションする方法
MetaTrader 4のための新しいエキスパートアドバイザーとインディケータ - 318
 自動売買ロボットは市場取引を自動的に実行しますが、インジケータを使用すると、相場をより適切に分析し、価格行動を予測できます。
これらのアプリケーションを使用すると、より多くの機会を獲得しながら、より多くの情報に基づいた方法でMetaTrader4で取引を実行できるようになります。
自動売買ロボットは市場取引を自動的に実行しますが、インジケータを使用すると、相場をより適切に分析し、価格行動を予測できます。
これらのアプリケーションを使用すると、より多くの機会を獲得しながら、より多くの情報に基づいた方法でMetaTrader4で取引を実行できるようになります。 
The principle of this indicator is very simple: detecting the trend with Moving Average, then monitoring the return point of graph by using the crossing of Stochastic Oscillator and finally predicting BUY and SELL signal with arrows, alerts and notifications. The parameters are fixed and automatically calculated on each time frame. Example: If you install indicator on EURUSD, timeframe M5: the indicator will detect the main trend with the Moving Average on this timeframe (for example the Moving
The principle of this indicator is very simple: detecting the main direction and trend with Stochastic Oscillator, then confirming the following movement with Moving Average and finally predicting BUY and SELL signal with arrows, alerts and notifications. The parameters are fixed and automatically calculated on each timeframe. Example: If you install indicator on EURUSD, M5 timeframe: the indicator will detect the main direction and trend with Stochastic Oscillator on this timeframe (for example

The Fox EA is a fully automated EA that works on both Classical and ECN accounts on USDCHF pair and is programmed to trade using both level trading and hedging strategies. All you need is to set the risk percent and start trading. The screenshots section shows the back-test results. The minimum balance of $2000 is required for standard accounts or $20 for micro accounts.
Parameters Lots = 0.01 Riskpercent = 0.5 (risk percent and its optimum at 0.5 for balance starting from $2000) Magic Number .

The Simple Worker is a multicurrency Expert Advisor that uses several proven trading strategies. It trades on the M1 timeframe. Few settings make the EA simple and intuitive for users, which allows it to be optimized for a certain currency pair, if necessary. The EA analyzes the market, the EA uses indicators, tick volumes, the Martingale system.
How the EA works It trades only one order at a time. It enters the market with two pending orders with the volume of "Startlot". If one of the orders

Ready Set Go is a combination of Indicators and Candlestick Analysis. Indicators to assess Momentum Candlestick Analysis to look for patterns
How the indicator works The indicator works by assessing the Momentum and direction of a trend with Candlestick analysis to test patterns. With a clear and easy to read display grid for buy and sell patterns the chart shows Ready, Set & Go with a tick mark. BUY - Green tick mark Ready - Momentum is moving upwards Set - Candlestick pattern forming Go - Mom

ED Adviser is specially designed for EURUSD. It uses Japanese ichimoku kinko hyo system and few types of moving average calculations before placing any order. ED Adviser will only work on EURUSD chart.
Input Lots - 2 (use this according to your account balance)
Take profit and stop loss are usually placed by ED Adviser at 30-40 pips. The recommended timeframe is H4.
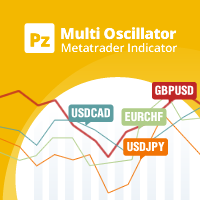
マルチオシレーター は、マルチ通貨およびマルチタイムフレーム取引のための究極のスイスアーミーナイフです。単一のチャートに多くの通貨ペアおよび/またはタイムフレームの目的のオシレーターをプロットします。市場のスクリーニングツールとして、または洗練されたマルチタイムフレームインジケーターとして、統計的裁定取引に使用できます。 [ インストールガイド | 更新ガイド | トラブルシューティング | よくある質問 | すべての製品 ] 簡単な解釈と構成 16個の既知のインジケータをサポート チャートには最大12通貨ペアを表示できます また、単一の機器の複数のタイムフレームを表示できます 入力でシンボルと時間枠をカスタマイズ可能 カスタマイズ可能なオシレーターインジケーター設定 カスタマイズ可能な色とサイズ 幅広い市場の見通しを提供するために、異なるオシレーターを使用して、干渉なしで同じチャートにインジケーターを何度もロードできます。このインジケーターは、次のオシレーターをサポートしています。 RSI CCI ADX ATR MACD オスマ デマーカー 確率的 勢い 強制インデックス マネー
FREE

Do not use Windows 7 with this EA MT4toTLGRM EA only sends text messages from Metatrader4 to a Telegram group or channel of your choice. From version 4.23 it sends messages to Discord, Twitter and Facebook. The messages are customizable to show information about any trading activity in the account. Also it shows a daily PnL report. Several instances of this EA can be used simultaneously in the same MT4 terminal for sending messages to different Telegram group/channel but ensure that each one ha
FREE

This software will give you the possibility to preset your management strategy (both in live markets and in strategy tester).
You will have at your disposal 8 operative buttons. 4 for Buy positions (from left to right): Buy at market. Buy limit. Buy stop. Set buying time. 4 for Sell positions: Sell at market. Sell limit. Sell stop. Set selling time.
After you have decided one of the 4 options you can easily preset: Lot size. Stop loss, both in points and average volatility (D1 timeframe). Take

Risk Manager Pro is a simple utility that calculates the necessary lots with the risk percentage and the pips of stop loss, before opening positions. The web calculators can be useful in some cases but they are not efficient to open operations in real time. In the trading days, there are few opportunities to open positions and when the opportunity arises, the seconds make the difference. This is not possible with conventional web calculators, since to calculate the size of an operation regarding

CandleCrusherX Scalping EA analyses the market situation on volume and strong price movement within internal Timeframe. It works on all major forex pairs and Timeframes (M5 or M15 recommend). The EA has integrated dynamic Take Profit, this means, if you reach your defined TP it gives you the chance to follow on the Trend by dynamic TP & SL and extend your profits. Also a News Filter function is integrated, to prevent miss trades on News events. Dynamic Lot calculation integrated On Request we ad
This demo EA only sends text messages to a predefined Telegram channel ( there is no need to confiure telegram ). The messages can be customized to show information about the trading activity. Also it shows the daily account PnL. Several instances of this EA can be used simultaneously from the same MT4 terminal but ensure that each one has different EA ID number (setting B16) I have tested this EA with forex symbols but it should work fine with any MT4 symbol (e.g. indexes, commodities, stocks,
FREE

The trading system operates on seven pairs and one timeframe. The Expert Advisor uses trading systems for trend-based entries with the help of the Envelopes and CCI indicators. Each indicator uses up to five periods for calculating the trends. The EA uses economic news to calculate the prolonged price movements. The EA has the built-in smart adaptive profit taking filter. The robot has been optimized for each currency and timeframe simultaneously. Real monitoring: https://www.mql5.com/en/signal

The idea of the indicator is based on the ZigZag indicator using a new equation with the addition of volume.
Inputs InpDepth — Depth. InpDeviation — Deviation. InpBackstep — Backstep. Enable_Alert — audio and text notifications on a trend change. Send_Notifications — push notifications to mobile devices. E-mail alert — email notifications. Make sure to configure email parameters in the terminal settings.
Features The indicator does not repaint. The indicator does not recalculate. The indicator

Pattern Finder is a MULTICURRENCY indicator that scans the entire market seeking for up to 62 candlestick patterns in 15 different pairs/currencies all in one chart! You can also filter the scanning by following the trend by a function based on exponential moving average.
Indicator parameters Alerts ON/OFF: Alert on screen ON/OFF : enables or disable screen alters. Notification by email ON/OFF : enable or disable email alerts. Push notification ON/OFF : enable or disable push notification on mo

It is well known that market moves as waves and in cycles. The FutureWaves indicator looks at various such cycles present in the market and projects those cycles into future to give a indication as to what may happen and what can be the biases present in each coming cycle. The indicator can be used for Binary options and fx trading. Green histogram should be seen as the strength of buyers and red histogram that of sellers. Both the bias and the sync waves should be seen as the imbalances between

Info: marcobarbosabots CCI Warrior
CCI is the short name of Commodity Channel Index indicator. The CCI Warrior is an Expert Advisor that get signals using CCI (Commodity Channel Index) levels. A SELL signal is generated above a positive level and a BUY signal is generated below a negative level. When a signal is generated, a Moving Average filter checks it. If the signal is in the same direction of the trend indicated by a Moving Average filter, then it is validated. After the signal was vali
FREE

Opening positions in the direction of the trend is one of the most common trading tactics. The main idea is that the probability of the trend continuation is higher than that of its change. This indicator determines the direction of a local movement, marking the beginning of a trend with a large dot and its continuation with a line of the corresponding color.
Distinctive features No Repaint. Simple and accurate settings. Clear and understandable signals. Works on all timeframes and symbols. Sui

This tool for linking charts in Metatrader 4. Thanks to this tool you have to change symbol only in the main window and all other change automatically. Add this tool to all charts that you want to be linked with each other. Set one chart as a main. Change symbol in the main window and linked windows change automatically to the new symbol.
Input parameter isMainChart - set true only for the main chart window. Set false for all other linked windows.

Do you need to check support and resistance lines? Do you need to find them really fast and automatically? Do you want to set your own settings how to find them? Indicator Lines is developed for finding support and resistance lines on chart. It does its job quickly and fully automatically. Main principle of algorithm is to get all extremes on chart (according to "Density" parameter). Then indicator tries to find minimally 3 points (according to "Minimal count of points" parameter) which can be u

A.Indicator description This indicator tells you ATRs of various time-frame and how much ATR is filled. If ATR is completely filled,this indicator alerts you. Font,color and font size is customizable.
B.Why do you need ATR? ATR tells you how much bars propbably would move. You can use this indicator to set stoploss and take-profit,or enter counter-trend setup. But it is risky to enter trades based on ATR alone. So,you should use ATR with other indicator and price action.
C. Input Parameters Al

The ATR Arrows MTF indicator is built based on the Average True Range (ATR). It provides entry signals as arrows. All signals are generated at the current bar. Signals do not redraw! All signals in MTF mode correspond to the signals of the period specified in the MTF. It is very easy to use both for trading based on one indicator and for use in your trading systems. The indicator timeframe can be set independently of the main window, so you can combine several indicators in one window.
Paramet
This indicator is designed to provide all useful information about symbol, account, positions and profit. It is developed for improving trader's money management.
Parameters Calc can be divided to separate blocks. Each block is possible to hide, set its own color and other properties. Block symbol: This block displays information about actual SPREAD, POINT VALUE (in deposit currency for 1 lot), SWAP LONG and SHORT. Show symbol info - display/hide this block Color of symbol info - color of this
FREE

This indicator allows you to monitor the vitals of your account and notifies of some events, in accordance with user settings. Keep your finger on the pulse of trading.
Control elements
Main panel of the indicator shows the following values: chart symbol, bid/ask prices, spread, free margin, equity, total number of orders and total profit/loss.
There are also two buttons: "Alarm" and "Mute". "Alarm" button starts up a timer, which will notify user in a period of time, defined in the settings. I
FREE

Built To Last is a fully automated ea that works on AUSUSD pair and it is programmed to use a neural network equation to measure the trend stability to buy or sell. It has passed more than 6 years backtest on real tick data with 99.9% Accuracy (check screenshots section). Why AUSUSD? because no flash crush or 1000 pips sudden moves happened on it till now. Minimum Balance required 4000$.
Expert Parameters Target - to be set at 76 for the optimum performance. StopLoss - to be set at 20 for the

The scalper uses the model of a quantum set of algorithms, applying a unique multi-level system of supportive orders. There is no need to optimize the EA, it is already fully configured for work. Signal: EUR/USD Key points Passes the test from 1999 to the current time (20 years). No need to close the robot during news releases; It works with 4 and 5-digit quotes; Uses a medium model of a quantum set .
Operation parameters Currency pair : EURUSD; Timeframe : M5; Broker: any; Торговые счета: l

This EA works in 2 modes. 1 - on the rollback from the important levels, 2 - allows you to trade on breaking important levels. It always uses 6 levels at which signals to open orders are calculated. We recommend you to set Import 1 = 50, Import 2 = 200, Import 3 = 500. This will allow you to select levels that are already well formed and are important for trading. The EA works on any trading instruments, it is better to use a timeframe not lower than H1, leverage from 1:500. You can choose to tr

LevelPAttern is a technical indicator based on the daily levels and Price Action patterns. The indicator is based on the standard ZigZag indicator + reversal candlestick pattens, such as Star, Hammer (also knows as Pin bar), Engulfing and others. The indicator generates audio and text notifications when a pattern is formed and a level is touched. It also supports sending email and push notifications.
Indicator operation features It is suitable for working with any CFD and FOREX trading instrume

Wolfe EA uses indicators to enter and exit orders. Wolfe EA gives you the choice of times to open orders. The EA works on both 4 and 5-digit quotes. When a opposite signal appears: if there is an open order in profit, then the EA closes it; if the open order is in loss, the EA opens opposite orders. The EA has a Overlap Order option, this gives it the ability to use percentage of profit from the last order to reduces losses. News filter option allows Wolfe EA to receive a continuous feed from ne

The main function of the indicator is to draw the target lines (support and resistance lines). The lines are plotted according to a special fractal algorithm. The lines are calculated with consideration of the zero bar. A different, more complicated calculation algorithm is used on the zero bar, in contrast to the other bars. This allows reacting to the market situation in real time, but on the other hand, redrawing is possible on the zero bar. If necessary, the zero bar can be omitted from calc

A scalper with the analysis of the current price dynamics when it deviates from the average value. Uses pending orders in the impulse direction, at a fixed distance, then moves the pending order in the direction of correction. You can configure the number of pending orders to be placed in the signal direction - the distance between the pending orders is LevelDist , the lot value of each new order is equal to a half of the previous one. After the closure of the impulse candlestick, pending orders
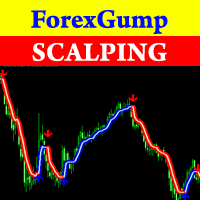
Attention! Friends, since there have been many scammers on the Internet recently selling indicators called ForexGump, we decided to warn you that only on our page is the LICENSE AUTHOR'S VERSION of the INDICATOR sold! We do not sell this indicator on other sites at a price lower than this! All indicators are sold cheaper - fakes! And even more often sold demo versions that stop working in a week! Therefore, in order not to risk your money, buy this indicator only on this site! Forex Gump Scalpin

This EA has been developed for DAX (DE.30) M30 and is based on breakout of the Highest channel after some period of consolidation. It uses Stop pending orders with ATR Stop Loss and Take Profit. In this strategy we are limiting signals from 8:30 am to 9:30 pm. At 9:30 pm we are closing trading every Friday to prevent from weekly gaps. !!!Adjust these times to your broker time. Preset values are for UTC+1 only!!! For every candle the pending orders are modified to adapt the market behavior. Every
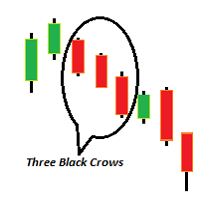
There are total of 11 bullish candlestick patterns and 11 bearish candlestick pattern and 4 different types of indecision bar. Bullish formations Bullish 3 method formation Bullish Engulfing bar Bullish Harami Bullish Separating line Bullish long lower shadow Morning star Morning Doji star Three white soldiers Rising window Piercing line Tweezer tops (MINOR) Bearish formations Bearish 3 method formation Bearish engulfing Bearish Harami Bearish long lower shadow Bearish Separating Lines Evening s
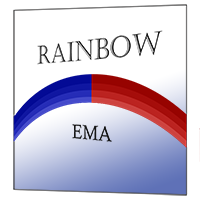
It is based on Multiple EMA indicators. The idea is that how to display multiple Exponential Moving Averages on the chart easily without placing them one by one. It has also BLUE-RED trend lips to define UPTREND and DOWNTREND whichas BLUE is UPTREND and RED is DOWNTREND.You can change the colors by going to Indicator properties --- colors. There are 2 external setting. They are Period and Shift. When you change them (period and or shift ) then all will automatically adjust. For any currency pair
Range Multi Alligators provides Range Channel High Low Information and the market trend indicated by the blue-red Histogram in the middle of range channel. The range channel lines is useful to define stoploss and take profit. This is trend follower indicator based on the Multi Alligators. Attach it on the chart and change one or all setting then all lines will move synchronously with the current one.
Parameters Period : the number of bars used for the indicator calculations. Default: 120 used f

The strategy of this Expert Advisor is based on a hedging system, which implies placing opposite orders. The EA algorithm determines trend beginning and opens a position in the trend direction. In case of a wrong entry, the EA tries to neutralize the drawdown through opposite (hedging) orders at a preset interval (Coefficient of counter orders). Orders are closed when one of the two values is reached - profit in percent or profit in points. The EA does not use lot increase. The EA wast tested
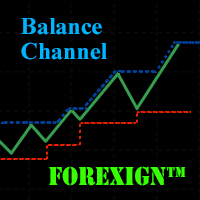
The Balance Channel indicator shows changes in the dynamics of the account balance on closed deals, and also graphically displays the current result of open positions in the form of the last segment on the line. The balance line is enclosed in the boundaries of the price range, the period of which can be set by a separate parameter "Period". This option can clearly show when the drawdown reaches a given critical value. The balance line can be calculated both in the account currency and deals mad

The CSM System is currently fully automated with all the special features and functions, controlled and regularly monitored. Its evolution, parameters and the individual algorithms are professionally evaluated and optimized by experienced development group of programmers who are developing new updated versions of system. Unlike the other systems, we focused to create the system where the backtesting successful results matching the real life situation. Our core lies in identification of these bi

Sniper X is an expert advisor using customized indicators to identify trend reversals. The entries are usually accurate and in case if the trend reverse with a delay the positions will be managed by a smart grid system which can be enabled. The EA is created to handle multiple trades when Grid is enabled by using the same magic number. When the EA reads an open trade the EA will not open another trade. If two trades are opened at the same time which will be very rare, the EA will set both trades

Zero Dog is an intelligent, automatic trading robot, which could scalps between the designate time periods to achieve the results as you set. It is developed base on real trading strategy and is working for the pass 3 years. It is very easy to setup with no much knowledge. You can just start with default set to trade EURUSD instantly. The strategy is well tuned to minimize optimization of setting. Build-in News filter allow you not to worry about stop trading within big news, medium news or low

!!! [CodeBase]でMql4インジケーターコードを公開しました。コードを無料でダウンロードしてください!!! (端末を更新するときにコードを適合させる必要があります)。
このインディケータはトレーダーのツールです。これは、すべての期間と記号でのストキャスティクスの動きを示しています:М1、М5、М15、М30、Н1、Н4毎分(現在から-240分までの時間スケール、つまり最後の4時間)。
Step_Stochは、ストキャスティクス指標の欠点である遅れを克服します。たとえば、H1(またはM30)での落下後の上昇は、H1の場合は60分後、M30の場合は30分後の通常の確率論で見られます。このインジケーターはこの情報を1分で表示し、より良い結果を得ることができます。
すべてのストキャスティクスを組み合わせて、それらの動きを分析し、遅延なく最適な取引決定を行うことができます。これにより、取引の成立時に利益が失われたり、利益の可能性(その大部分)がすでに失われている場合に開始が遅れたりする可能性があります。 。 Step_Stoch行は、トレンド反転プロセスの開始をより速く確認する
FREE
Pointer synchronization is an indicator with which the pointer can be synchronized in all the visible charts of the terminal. It shows a crossed cursor in all the visible charts of the terminal, in position relative to the cursor of the active chart. To activate the indicator, simply press the button that appears in one of the corners of the chart once the indicator is added to the chart. To deactivate the indicator, simply press the button again. Once the indicator has been deactivated, the cr

MCTC is the most advanced multicurrency strength indicator for day trading, that does NOT use moving averages. This versatile strength meter has many settings that can be customized to suit the day traders needs. With up to 12 customization time periods, automatic calculation and graph plotting of previous period high/low values, 2 side meters showing currency strength, pair strength, points movement, points movement from previous periods, percentage, and pressure. Clickable chart for fast switc

The Extreme Breakout EA is a fully automated multi currency Expert Advisor that trades time based breakouts and has various options to improve performance. The Extreme Breakout EA trades using pending orders and has the option to enter using market orders if required. View More Products - https://www.mql5.com/en/users/robots4forex/seller#!category=1
Monitoring Signals - https://www.mql5.com/en/signals/author/robots4forex?orderby=gain Designed for USDJPY. Features Fully automated Not sensitive t
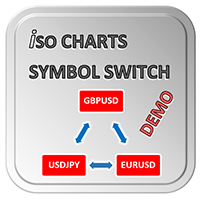
With Symbol Switch you can easily change the symbol of all open charts without losing your analysis or template. Easily monitor many symbols with only one monitor. Auto save\load analysis separately for each symbol (including all graphical analysis and attached indicators). The indicator shows the symbols which are visible in your MT4 "Market Watch" window. To add\remove a symbol just add\remove it from MT4 "Market Watch" window. Monitoring all symbols profit with the panel. Works with all broke
FREE

The BuySellArrows is a seemingly simple and persistent indicator. All traders had come across indicators that contain numerous input parameters that will change Buy and Sell position when you change those parameters value. Many traders asked what parameter's value will be more accurate. So, I decided to make an universal indicator without any input parameters. In this case you will have very stable indicators without any worries that you put some wrong numbers. This indicator will show Buy (colo
The Wave Scalper EA is fully automated scalping system that uses price action to identify good scalping trades and executes them with an invisible trailing stop loss. It also includes a money management feature which calculates lot size based on account size and risk with an option to set a maximum draw down at which the EA will stop trading. This is a long term strategy combined with money management which works well on most pairs, but predominantly GBPUSD, USDCAD, EURUSD, AUDUSD & USDJPY. Plea
FREE
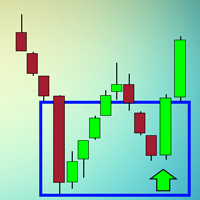
The indicator looks for buying and selling zones, where a deal can be opened with a minimal stop loss and a better Risk Reward Ratio. The indicator is based on qualitative search of the Double top/Double bottom pattern. This version works only on USDCAD! The full version of the indicator can be purchased here - https://www.mql5.com/en/market/product/29820
Indicator operation principle Looks for local tops/bottoms which can potentially become a Reversal zone It waits for an impulse movement that
FREE

EA TradingPanel X advanced is a based on our free product TradingPanel X free version : Integrated News Feature Dynamic Take Profit (Trail Step) Multiple Trade handling Extended Ordermanagement Profit & Lot Informations Market Informations The EA has integrated dynamic Take Profit (Trail), this means, if you reach your defined TP it gives you the chance to follow on the Trend by dynamic TP & SL and extend your profits. Also a News Filter function is integrated. The EA working with real TP & SL n
FREE

Telegram ChartSnap is an utility tool to bridge your MetaTrader 4 activities to your Telegram chat/group/channel. It will screen shot your MetaTrader 4 chart and send it to your dedicated Telegram chat/group/channel through a Telegram bot. The whole process will keep repeating based on a time cycle that predetermined by the user. It is a convenient tool for those who like to get access to their favorite system/dashboard that only available at MetaTrader Desktop. Beside that, trader can easily s

This is an extension of the Average True Range indicator with the breakdown of price gain, loss, and standard deviation; with the price break down into price gain and loss, this can now be used as an oscillator with standard deviation as the queue to time the entry and exit.
Settings ATR Period - Typically set at 12. ExtStdDev Period - This the period for the Standard Deviation and it typically follows the ATR Period.
How to use Buy / Sell Direction - If the green (gain) is higher than the los
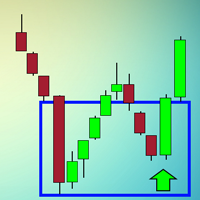
The indicator looks for buying and selling zones, where a deal can be opened with a minimal stop loss and a better Risk Reward Ratio. The indicator is based on qualitative search of the Double top/Double bottom pattern.
Indicator operation principle Looks for local tops/bottoms which can potentially become a Reversal zone It waits for an impulse movement that would exceed the Reversal zone and draws a red/blue wide rectangle Within the Reversal zone, it looks for the strongest area of the zone

Indicator of tick volumes equipped with notification system and the ability to monitor sudden and significant changes in the prices of bars relative to the specified coefficient - Change Factor - to the average value of volumes for a certain period of time (Period Signal) and the bar of the previous trading session. The color of the indicator's histogram characterizes the changes in volume of a bar: 1- relative to the previous session; 2 - relative to the signal line. According to the notificati

Ants Lite ATR allows you to enter and manage your trades based on the market volatility, giving you safer entries and better exits. Based on the work by Daryl Guppy.
Features Ability to define the bar the Long and Short calculation starts from. Can be used to generate both entry or exit signals. Customizable ATR period and multiplier. GMMA is a tried and tested indicator with a long pedigree. Volatility based entry and exit signal rather than time based.
How To Use Simply drag the indicator fr

DYJTRENDWAVE features an advanced algorithm that detects new trends and current trend continuations for use as an entry strategy. DYJTRENDWAVE's volatility is based on the power of buyers and sellers, it grabs total body size of candles and identifies the battle between buyers and sellers as a percentage of the total volume, like Sellers: (-)100% and Buyers: (+)100%. This information can be used for any entry and exit strategy. For bullish/Long Pin bar it is below the price line, for bearish/Sho
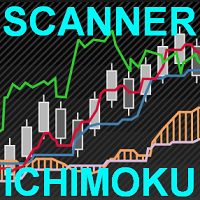
This scanner is a tool used to support trading with the Ichimoku method. Its basic features are: 10 trading setups implemented in accordance with the Ichimoku technique, the possibility of simultaneous scanning, all financial instruments available on the platform, the possibility of simultaneous scanning, in all timeframes available on the platform, two trading modes available: Manual and AutoTrading, the ability to open in Manual mode from the level of the chart, the ability to determine the si

Spread And Swap Dashboard is a nice tool that lets us know all the minimum and maximum spreads of the instruments that we trade. In addition to the spread information we also find the Bid & Ask values that always are very useful. We also considered it important to include positive and negative swap values so that we can better evaluate possible strategies of Carry Trade. The tool proves useful in times of high volatility to record all the values of spreads and have a better understanding of the
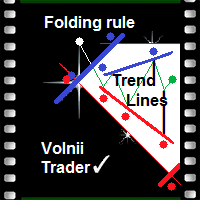
Folding rule of 4 trend lines The indicator has been created based on the "Folding rule" trading strategy. It shows four pairs of inclined resistance and support lines. These lines are plotted based on the nearest High and Low of the ZigZag technical indicator with four given input parameters. The indicator draws dots above and below the price extremums that have been used for plotting the trend lines. The indicator of trend lines facilitates the plotting of trend lines, channels and technical p

Market Profile helps the trader to identify the behavior if major market players and define zones of their interest. The key feature is the clear graphical display of the range of price action, in which 70% of the trades were performed. Understanding of the location of volume accumulation areas can help traders increase the probability of success. The tool can be used as an independent system as well as in combination with other indicators and trading systems. this indicator is designed to suit

Supporta is a trading indicator that automatically identifies support and resistance levels and their strengths from price movements and draws them on price charts. The instrument supports both the MetaTrader 4 and MetaTrader 5 terminals and can be used on any financial instrument and any timeframe. The MetaTrader 5 version is available on the market as Supporta MT5 . For full documentation and quick start, please refer to the official guidebook which is available for download in the comments se
Range Bar Chart — opens range bar charts for MetaTrader 4. The utility allows you to create charts of range bars on which all candlesticks are the same size and may have shadows. Data on the range bar chart are distributed by the bar size, rather than by the time. Each bar represents the price movement instead of time period. It works simple – the bar is not drawn as long as the price does not move. You can add indicators, EAs and scripts to the resulting chart. You get the completely operationa

This indicator is different from the conventional indicator by an additional set of parameters. The ADX line changes color depending on the location of the +DI and -DI lines relative to each other.
Indicator Inputs Period — indicator calculation period; Method — select the averaging method: simple, exponential, smoothed, linear-weighted; Apply to — select the applied price: Close, Open; High; Low; Median; Typical; Average Weighted; By default, the directional lines are colored in the following

The market is constantly fluctuating and almost always gives a roll-back of 5-20 points. If you look closely at the chart, you can see that the price never goes up or down without rollbacks. Thus, these small fluctuations can be earned if you collect a profit on each roll-back of 10 points. This EA was written a long time ago and today I want to share it with нou. When testing, the robot showed excellent results and in two months, the deposit was increased almost 10 times. I constantly took prof
This EA has been developed for DAX (DE.30) M5 and is based on breakout of the Linear Regression channel. It uses Stop pending orders with ATR Stop Loss and Take Profit. In this strategy we are limiting signals from 8:30 am to 9:30 pm. At 9:30 pm we are closing trading every day. Adjust this time to your broker time. Preset values are for UTC+1 only. For every candle the pending orders are modified to adapt the market behavior. Everything is already set up for DAX M5. Strategy is suitable only fo
Fibo Martingale System is martingale grid Expert Advisor, that is specially tailored for EURJPY. It trades long and short positions in the same time using its lot size progression on every grid level. The timeframe is not important, it does not trade on bar close. The most important think to respect is - for 0,01 starting lot you need an account of 25 000 $ at least - using smaller account is at your own risk. The default settings are ready to go, you do not need to change anything. By default t

Endeavor EA does not use indicators. It trades the strategy based on trading by hours and the breakout of support and resistance levels. Logic of the EA: it trades during the active phases of the Asian, European and American sessions and allows you to capture almost all the daily trend. It analyzes the history and places pending orders to follow the market direction in case of a breakout. The EA provides the options to close orders by profit or by time. When the price moves in the favorable dire

This is an automatic 24-hour trading system based on the algorithm of collective behavior of adaptive automata (a kind of algorithms of self-learning of artificial intelligence) that does not require manual intervention and does not use any indicators or well-known trading methods. The principle of the EA is to remember and analyze each step. A step is a price movement for a certain number (BaseStep) of points up or down. The depth of memory (how many steps to remember and analyze) is determined

NN8D Points is one of the indicators included into NN8D ( N ikolsky's N esting D oll) trading system. NN8D Points is an indicator containing multiple tools for analyzing Forex market: candle analysis and area system. Rather than simply averaging by Open, Close, High and Low prices, NN8D Points performs a complex analysis of the current and previous bars by various parameters: bar color; bar body size; bar wicks; bar core (average value between Open and Close, as well as between Lows and Highs);

This indicator alerts for potential buy and sell using exponential moving average. The indicator supports push notifications, terminal alerts, and sound alerts. I am an active developer who studies Forex and will continue to update this indicator with new features. It is customizable for one minute, five minute, fifteen minute, thirty minute, one hour, four hour, daily, weekly, and monthly timeframes.
Recommendations Indicator Settings : Use default settings. If scalping set M1 and M5 to true a
MetaTraderプラットフォームのためのアプリのストアであるMetaTraderアプリストアで自動売買ロボットを購入する方法をご覧ください。
MQL5.community支払いシステムでは、PayPalや銀行カードおよび人気の支払いシステムを通してトランザクションをすることができます。ご満足いただけるように購入前に自動売買ロボットをテストすることを強くお勧めします。

取引の機会を逃しています。
- 無料取引アプリ
- 8千を超えるシグナルをコピー
- 金融ニュースで金融マーケットを探索