MACD Trend Line Alert
- インディケータ
- バージョン: 1.0
- アクティベーション: 5

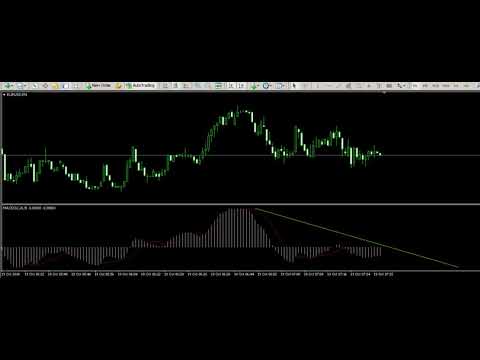
This indicator is an upgrade of traditional MACD on MT4. It can alert and push notificaton (if configured) when :
- MACD line cross Signal Line
-MACD line cross Zero
-MACD cross Trend Line
-MACD cross Horizontal Line
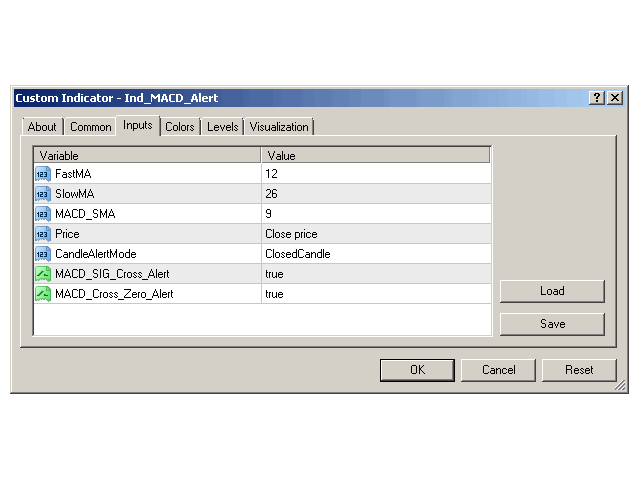
It has two working mode: on ClosedCandle and on RunningCandle. With ClosedCandle mode, it only alert when a candle is closed.
Trader only draw a line (trend line or horizontal line) on MACD indicator window and the indicator will automatically find that line and check if it is crossed.
Very simple and useful. The line (trend line and horizontal line) alert is default turned ON. Trader only decide to use or not the alert for SIG cross or Zero cross.
When alert, it bring its chart to front.

I contacted seller and got no response after few days of purchase. This indicator was NOT what I was expecting with the alert.